FVG fill with immediate rebalance [LuciTech]The "FVG fill with immediate rebalance AKA Golden Arrow" indicator is designed to identify Fair Value Gaps (FVGs) and detect immediate rebalances to highlight potential trading opportunities. It uses colored boxes to mark FVGs and triangular markers to signal bullish or bearish setups, helping traders pinpoint key price levels where imbalances occur and price reactions are likely.
Key Features
FVG Detection: Spots bullish and bearish Fair Value Gaps based on price action, with customizable width settings.
Golden Arrow Signals: Displays triangular markers when price fills an FVG and immediately rebalances, indicating potential reversal or continuation zones.
Customizable Colors: Bullish FVGs appear in green and bearish FVGs in red by default, with options to tweak colors in the settings.
Time Filter: Allows signals to be restricted to a specific time window, highlighted by a background fill for clarity.
Alert System: Supports TradingView alerts for "Bullish Golden Arrow" and "Bearish Golden Arrow" signals to keep traders updated on setups.
How It Works
FVG Calculation: Analyzes gaps between candles to identify FVGs, with user-defined minimum width options (points, percentages, or ATR-based).
Signal Generation: Triggers a Golden Arrow signal when price fills the FVG and rebalances immediately, based on wick penetration and closing conditions.
Visual Aids:
Bullish FVGs are shown as green boxes, bearish FVGs as red boxes.
Upward triangles mark bullish signals, downward triangles mark bearish signals.
Time-Based Filtering: Optionally limits signals to specific hours, with a background fill showing the active period.
Buscar en scripts para "gaps"

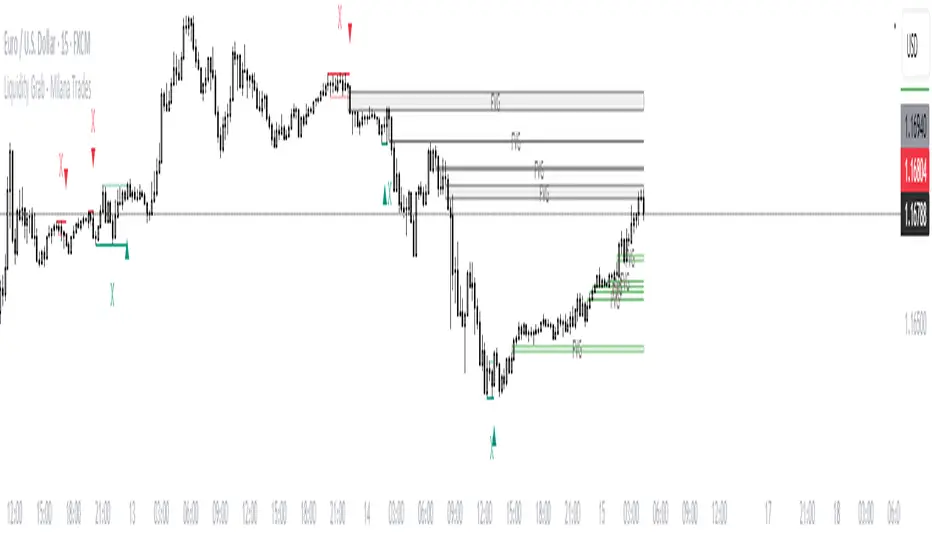
(ICT)Liquidity Grab + FVG + MSS/BOSThis script is a comprehensive educational indicator that combines and enhances several well-known trading concepts:
Liquidity Grabs (Swing Failure Patterns)
Fair Value Gaps (FVG)
Market Structure Shifts / Break of Structure (MSS/BOS)
Alerts
It identifies potential bullish and bearish liquidity grabs, confirms them optionally using volume validation on a lower timeframe, and tracks subsequent price structure changes. The indicator visually marks key swing highs/lows, FVG zones, and BOS/MSS levels—allowing traders to observe how price reacts to liquidity and imbalance zones.
🔍 Features:
Swing Failure Patterns (SFP):
Highlights possible liquidity grabs based on recent highs/lows and candle structure.
Volume Validation (Optional):
Filter signals using relative volume outside the swing on a lower timeframe. Adjustable threshold.
Fair Value Gaps (FVG):
Detects imbalance gaps and extends them for easy visualization.
Market Structure (MSS/BOS):
Displays Break of Structure (BOS) and Market Structure Shift (MSS) based on pivot highs/lows and closing conditions.
Dashboard:
A compact info panel displaying lower timeframe settings and validation status.
Custom Styling:
Adjustable colors, line styles, and label visibility for clean charting.
🧠 Ideal For:
Traders studying ICT concepts, smart money theories, and price-action-based strategies who want a visual tool for analysis and backtesting.
How to Use:
Wait for a Liquidity Grab (SFP) to form
The first condition for a potential entry is the formation of a Stop Hunt / Swing Failure Pattern (SFP).
This indicates that liquidity has been taken above or below a key level (e.g., previous high/low), and the market may be ready to reverse.
Confirmation with Fair Value Gap (FVG) and Market Structure Shift (MSS)
After the SFP, do not enter immediately. Wait for confirmation:
FVG : A Fair Value Gap (an imbalance in price action) must appear, signaling potential institutional activity.
MSS : A Market Structure Shift (break in the current trend) confirms a possible trend reversal or strong corrective move.
Enter the trade
Once both the FVG and MSS are confirmed after the SFP, you can safely enter a trade in the direction of the shift.
Alert Feature
The indicator includes an alert system to notify you when all conditions are met (SFP + FVG + MSS), so you can react quickly without constantly watching the chart.
BAFD (Price Action For D.....s)🧠 Overview
This indicator combines multiple Moving Averages (MA) with visual price action elements such as Fair Value Gaps (FVGs) and Swing Points. It provides traders with real-time insight into trend direction, structural breaks, and potential entry zones based on institutional price behavior.
⚙️ Features
1. Multi MA Visualization (SMA & EMA)
- Plots short-, mid-, and long-term moving averages
- Fully customizable: MA type (SMA/EMA) and length per MA
- Dynamic color coding: green for bullish, red for bearish (based on close >/< MA)
2. Fair Value Gaps (FVG) Detection
Detects bullish and bearish imbalances using multiple logic types:
- Same Type: Last 3 candles move in the same direction
- Twin Close: Last 2 candles close in the same direction
- All: Shows all valid FVGs regardless of pattern
Gaps are marked with semi-transparent yellow boxes
Useful for identifying potential liquidity voids and retest zones
3. Swing Highs and Lows
- Automatically identifies major swing points
- Customizable sensitivity (strength setting)
Marked with subtle colored dots for structure identification or support/resistance mapping
📈 Use Cases
- Trend Identification: Visualize momentum on multiple timeframes
- Liquidity Mapping: Spot potential retracement zones using FVGs
- Confluence Building: Combine MA slope, FVG zones, and swing points for refined setups
🛠️ Customizable Settings
- Moving average type and length for each MA
- FVG logic selection and color
- Swing point strength
🔔 Note
This script does not generate buy/sell signals or alerts. It is designed as a visual decision-support tool for discretionary traders who rely on market structure, trend, and price action.

FVG Detector Modified# FVG Detector Modified
## Description
The FVG Detector Modified is an advanced technical analysis tool designed to identify Fair Value Gaps (FVGs) in the market with enhanced filtering capabilities. FVGs represent imbalances between buyers and sellers, indicating potential areas where price may return to "fill the gap" in the future.
This indicator not only identifies traditional bullish and bearish FVGs but also features a unique pattern recognition system that highlights significant FVGs by detecting consecutive occurrences within a customizable lookback period. The smart visualization system prevents visual clutter by avoiding duplicate markers in close proximity.
## Key Features
- **Bullish & Bearish FVG Detection**: Automatically identifies and displays both bullish (blue) and bearish (red) Fair Value Gaps
- **Customizable Appearance**: Adjust colors, transparency, and extension of FVGs to match your chart setup
- **Width Filtering**: Filter out insignificant FVGs using minimum width thresholds with multiple measurement methods (Points, Percentage, or ATR)
- **Smart Pattern Recognition**: Highlights significant FVGs when multiple gaps occur within a customizable lookback period
- **Anti-Clutter Technology**: Prevents visual overload by avoiding duplicate markers within a 5-candle window
- **Circle Size Options**: Choose from five different circle marker sizes (Tiny to Huge) to suit your chart setup
- **Multiple Alert Types**: Set alerts for basic FVG formations, pattern-based FVGs, and actual circle marker appearances
## Trading Applications
- Identify potential price reversal zones where market may return to "fill the gap"
- Recognize high-probability trading opportunities when multiple FVGs form in succession
- Use as confluence with other indicators for more precise entry and exit points
- Spot market structure shifts by monitoring the frequency and size of FVGs
## Settings
The indicator features comprehensive customization options:
- Toggle FVG visibility and appearance
- Set minimum width filters using various measurement methods
- Adjust lookback periods for pattern recognition
- Customize circle marker appearance and size
- Configure FVG extension for better visibility
*Note: This indicator is based on original work by LuxAlgo, modified with enhanced filtering capabilities to improve signal quality and reduce false positives.*

ZenAlgo - RangerThe core of the indicator is the daily range, anchored around the 1-minute timeframe VWAP (volume-weighted average price), with ±2 standard deviations defining the upper and lower bounds. This range dynamically forms throughout the day and then gets “locked” at 23:59 each day to establish historical reference values.
The indicator calculates this locked VWAP and standard deviation per day, which serves two primary purposes:
Drawing today's real-time evolving range , updated each minute.
Plotting previous daily ranges , based on historical locked VWAPs and standard deviations, providing visual reference boxes on the chart.
This design enables the trader to identify mean-reversion zones and persistent directional biases based on volume-weighted price consensus.
Multiple Standard Deviation Layers
Beyond the ±2.0 deviation bounds, optional lines are available at half-step increments (e.g., ±0.5, ±1.5, ..., ±4.5) and full-step levels beyond ±2.0 (±3.0, ±4.0, ±5.0). These provide a customizable grid to visualize price extremes, tail behavior, or potential breakout zones relative to volume-adjusted price equilibrium.
Users can enable only the levels they need, offering flexibility depending on their strategy (e.g., scalping versus swing trading).
Historical Range Retention
The script stores up to 70 previous daily VWAP + standard deviation values (adjustable). For each, it draws a full range box and standard deviation lines in the past. This historical context helps in understanding how current price interacts with prior days’ balance zones.
These boxes are always drawn from 00:00 to 23:59 UTC , ensuring consistent alignment across instruments and avoiding session-based discrepancies.
Monday Range Reference (Drawn on Tuesdays)
On Tuesdays, the indicator plots the previous Monday's VWAP-based range across the rest of the week. This serves as a persistent contextual anchor for traders watching weekly unfolding behavior. The range is defined identically (VWAP ±2σ) and drawn from Monday 00:00 through the following Monday.
This method assumes Monday often sets the tone or structure for the week, and tracking this level through time may highlight support/resistance confluence or range expansion scenarios.
Each Monday range is extended over 7 days and includes dashed lines at the 25%, 50%, and 75% marks within the range. These midrange markers help traders assess microstructure behaviors (e.g., reversion to median, failure to hold midpoint, etc.).
Daily Volume Delta via 4H Candles
The indicator also integrates daily buy/sell volume deltas , derived from 4-hour candles of the regular session (non-Heikin Ashi). The logic categorizes volume as:
Buy volume when candle closes above the previous close.
Sell volume when it closes below.
Even split when the candle closes flat.
These volumes accumulate each day to derive net delta (buy - sell). This delta is recorded for each day and can optionally be displayed. A similar process tracks the delta for each Monday range on an ongoing basis.
This information quantifies the market’s aggressive buying vs. selling , correlating with price positions inside or outside the VWAP ranges. A strong delta in one direction may justify a price sustaining above/below VWAP, or diverging from the previous range.
Interpretation and Best Usage Practices
VWAP±2σ Range : Considered a high-probability area for consolidation or reversal. Mean-reverting strategies can benefit from signals within this area.
VWAP±3.0 and beyond : Extreme deviations may signal exhaustion or breakout potential, but are less frequent.
Previous Range Overlap : Overlap of today’s price with past VWAP zones may indicate support/resistance zones.
Monday Range on Tuesday : Persistent levels where the week may repeatedly pivot. Best used on instruments that exhibit weekly cyclical behavior (e.g., indices, forex).
Delta Behavior : Sharp positive or negative delta combined with price outside VWAP bands may suggest initiative participation and potential trend continuation.
Added Value Over Free Alternatives
While many free VWAP tools exist, this script differs in several specific and factual ways:
Anchored 1-minute VWAP lock at a consistent daily timestamp (23:59 UTC), enabling historical analysis.
Historical storage of previous VWAP ranges , with adjustable memory depth and visual continuity.
Flexible standard deviation plotting , down to 0.5 increments, tailored to the user's strategy needs.
Dedicated Monday range analysis , not common in freely available scripts.
Volume delta tracking per day and per Monday range , offering a directional volume view unavailable in standard VWAP implementations.
Persistent and visual interpretation framework using extended boxes and dashed lines for easier contextual navigation.
Each of these additions increases the script’s utility for methodical traders relying on volume-weighted statistics, without requiring additional configuration or external calculations.
Limitations and Disclaimers
VWAP based on 1-minute resolution : The indicator uses minute-level data to calculate daily VWAP and standard deviation. This offers high fidelity on liquid instruments but may produce noisy or unreliable levels on illiquid assets or during periods of low volume. For example, microcap stocks or thinly traded altcoins might not yield stable VWAP centers.
Inferred buy/sell volume : Volume delta is estimated using price movement from one candle to the next (close-to-close logic), rather than actual trade-level aggressor data (which is not accessible via TradingView). This approximation may misclassify volume in choppy or low-volatility environments, especially in assets where price changes do not correlate well with order flow (e.g., crypto during low-volume weekends).
Non-continuous markets and price gaps : For assets that do not trade continuously (e.g., stocks, futures), the VWAP calculation starts fresh every day at 00:00 UTC, regardless of the instrument’s official session start. As a result:
Pre-market/post-market trades may be included in VWAP when analyzing equities, even though they are often excluded in professional VWAP tools.
Opening gaps in equities and futures may distort early VWAP values due to lack of volume context, especially if the previous day's session was already closed when new data begins accumulating.
Weekend gaps in crypto, although less frequent due to 24/7 trading, can still influence delta accumulation if abrupt moves happen during low liquidity periods.
Daily session alignment : The VWAP anchoring and box drawing uses 00:00 UTC to 23:59 UTC windows. For instruments with different official session timings (e.g., US equities, CME futures), this may cause mismatches between expected session VWAPs and the ones shown in this script.
Conclusion
The ZenAlgo – Ranger script offers a systematic visualization of volume-adjusted price behavior, combining statistical VWAP ranges with volume delta overlays. By integrating daily and weekly reference zones, this tool supports structured decision-making in various market environments, particularly for traders prioritizing mean reversion, range expansion, or trend confirmation.

DT_KEY_LEVELSDT_Key_Levels: Powerful Market Structure Analysis Indicator
DT_Key_Levels is an advanced indicator for fundamental market structure analysis, optimized for higher timeframes (D1, W, M). The indicator combines three powerful technical analysis tools — fractals, Fair Value Gaps (FVG), and psychological levels — in one comprehensive solution.
Three Components of the Indicator
1. Enhanced Fractal System
The indicator uses an improved version of Bill Williams' classic fractals, allowing for deeper market structure analysis:
Dual Identification System:
Standard 5-bar fractals (displayed with thick lines) for analyzing reliable support/resistance levels
Light 3-bar fractals (displayed with thin lines) for early identification of potential reversal points
Intelligent Tracking System:
Automatic detection and filtering of completed fractals
Marking fractals with corresponding timeframe designation (HTF-1D, HTF-1W, HTF-1M)
Tracking and marking the All-Time High (ATH)
2. Fair Value Gaps (FVG) System
The indicator identifies and visualizes price gaps in market structure — zones that often act as magnets for future price movements:
Precise Identification of Inefficient Zones:
Bullish FVG: when the current candle's low is above the -2 candle's high
Bearish FVG: when the current candle's high is below the -2 candle's low
Detailed Visualization:
Clear display of upper and lower boundaries of each FVG
Midline (0.5 FVG) for determining key reaction levels within the gap
Marking each FVG with "FF" (Fair value Fill) label for quick identification
Dynamic Management:
Automatic removal of FVGs when they are filled by price movement
Customizable line extension for improved tracking of target zones
3. Intelligent Psychological Levels
The indicator automatically determines key psychological levels with adaptation to the type of instrument being traded:
Specialized Calibration for Various Assets:
Forex (EUR/USD, GBP/USD, USD/JPY): optimization for standard figures and round values
Precious metals (XAUUSD): adaptation to typical gold reaction zones with a $50 step
Cryptocurrencies (BTC, ETH): dynamic step adjustment depending on current price zone
Stock indices (NASDAQ, S&P500, DAX): accounting for the movement characteristics of each index
Smart Adaptation System:
Automatic determination of the optimal step for any instrument
Generation of up to 24 key levels, evenly distributed around the current price
Intelligent filtering to display only significant levels
Practical Application
Strategic Analysis
Identifying Key Structural Levels:
Use monthly and weekly fractals to determine strategic support/resistance zones
Look for coincidences of fractals with psychological levels to identify particularly strong zones of interest
Determine long-term barriers using type 5 fractals on higher timeframes
Analysis of Market Inefficiencies:
Track the formation of FVGs as potential targets for future movements
Use FVG midlines (0.5) as important internal reaction levels
Analyze the speed of FVG filling to understand trend strength
Tactical Trading Decisions
Entry Points and Risk Management:
Use bounces from fractals in the direction of the larger trend as a signal for entry
Place stop-losses behind fractal levels or key psychological levels
Monitor the formation of new fractals as a signal of potential reversal
Determining Target Levels:
Use unfilled FVGs as natural price targets
Apply nearby psychological levels for partial position closing
Project higher timeframe fractals to determine long-term goals
Indicator Advantages
Comprehensive Approach: combining three methodologies for a complete understanding of market structure
Intelligent Adaptation: automatic adjustment to the characteristics of different types of assets
Clean Visual Presentation: despite the abundance of information, the indicator maintains clarity of display
Effective Signal Filtering: automatic removal of completed levels to reduce visual noise
Higher Timeframe Optimization: specifically designed for daily, weekly and monthly charts
Usage Recommendations
Use the indicator only on D1, W, and M timeframes for the most reliable signals
Pay special attention to areas where different types of signals coincide (e.g., fractal + psychological level)
Use higher timeframe fractals as key zones for medium and long-term trading
Track FVGs as potential target zones and focus on their filling

Inner Circle Toolkit [TakingProphets]Inner Circle Toolkit — A Complete ICT Trading Companion
The Inner Circle Toolkit is a closed-source, all-in-one trading tool designed for traders following ICT (Inner Circle Trader) and Smart Money Concepts strategies. Every part of this script is built with purpose — not just a mashup of indicators, but a structured framework to help you follow price through the lens of institutional behavior and liquidity theory.
Let’s walk through what it does and how it can help you:
🕒 Session Liquidity Levels (Asia, London, New York, NY Lunch)
The indicator automatically marks the highs and lows of the major trading sessions:
-Asian Session
-London Session
-New York AM Session
-New York Lunch
These levels are important because price often returns to these points to grab liquidity before making a move. This gives traders clear areas to watch for potential sweeps, rejections, or reversals — without having to manually track session timings every day.
REQHs and REQLs — Equal Highs and Lows
This script detects Relatively Equal Highs and Lows (REQHs/REQLs), which are often used by institutions as stop-run targets.
It’s not just looking for copy-paste double tops or bottoms — it uses a tolerance-based algorithm that checks for clusters of similar highs or lows over a given time period. These are likely to hold stops and become magnets for price. When you see these on the chart, you’ll know where the “juice” is sitting.
Fair Value Gaps (FVG) — Multi-Timeframe
The script automatically plots Fair Value Gaps (FVGs) on both:
-Your current chart timeframe
-One or more higher timeframes (like H1 or H4)
These are three-candle gaps that form when price moves aggressively without filling in value. Price often comes back to these areas to rebalance. Seeing both local and higher-timeframe FVGs on your chart gives better context and helps with entries and exits.
The script is optimized so your chart doesn’t get messy — higher timeframe FVGs show up in a cleaner format with visual labels and lighter shading.
SMT Divergence — With Session Logic
This tool includes a real-time SMT divergence detector, based on the behavior of correlated markets like ES vs. NQ.
Here’s how it works:
If ES sweeps a liquidity level (like Asia Low), but NQ doesn’t, the script detects and marks that divergence.
This often signals institutional accumulation or distribution — a high-probability setup.
You won’t have to flip between charts or manually compare — the SMT logic runs automatically and only fires when it matters (at key session levels). It’s a smarter, more focused way to track intermarket divergences.
Daily Highs and Lows — Week-to-Week Structure
The indicator keeps track of the high and low for each day of the week — Monday through Friday — helping you understand how price is evolving across the week.
This helps build a weekly profile:
Did Monday set the high of the week?
Are we sweeping Tuesday’s low on Thursday?
These levels stay visible and labeled, helping you frame daily setups inside the bigger picture.
🕛 Midnight Open & 8:30 AM Open Levels
These two levels are core ICT concepts used to judge whether price is in premium or discount:
Midnight Open (00:00 EST): Used to determine daily bias
New York Open (08:30 EST): Often a launch point for key moves
Both are drawn automatically and extend throughout the day. This helps you align your trades with potential algorithmic bias, especially during NY session volatility.
⏰ 9:45 AM Vertical Marker — Macro Time Reminder
The script draws a subtle vertical line at 9:45 AM EST, which is the start of the NY AM macro session — one of the most likely times to see setups play out.
This is more than just a timer — it’s a visual cue that something important might be setting up soon, especially if you’re already watching SMT, FVGs, or liquidity zones from earlier.
How It All Connects — A Workflow, Not a Mashup
Every feature in this script is connected to the same goal: helping you trade with the Smart Money.
Here’s how the pieces work together:
Session levels → potential stop hunts
Equal highs/lows → targets
FVGs → entry points
SMT divergence → confirmation or warning
Daily highs/lows → Weekly structure frames bias
Open levels → premium vs. discount
Macro line → timing clue for execution
It’s built to help you flow with price action and trade the story, not just random signals.
Why It’s Closed Source — and Original
This script is closed-source because it contains:
A proprietary system for real-time SMT logic (with intermarket sweep detection)
Multi-timeframe FVG detection that auto-filters overlaps
Smart equal-high/low detection using range-based clustering
Optimized UI that shows a lot without overwhelming the chart
There are no moving averages, no public-domain indicators, and no mashup of standard tools. Everything here is purpose-built for traders who follow ICT strategies.
Let us know how we can improve!

Imbalance(FVG) DetectorImbalance (FVG) Detector
Overview
The Imbalance (FVG) Detector is a technical analysis tool designed to highlight price inefficiencies by identifying Fair Value Gaps (FVGs). These gaps occur when rapid price movement leaves an area with little to no traded volume, which may later act as a zone of interest. The indicator automatically detects and marks these imbalances on the chart, allowing users to observe historical price behavior more effectively.
Key Features
- Automatic Imbalance Detection: Identifies bullish and bearish imbalances based on a structured three-bar price action model.
- Customizable Sensitivity: Users can adjust the minimum imbalance percentage threshold to tailor detection settings to different assets and market conditions.
- Real-time Visualization: Marked imbalances are displayed as colored boxes directly on the chart.
- Dynamic Box Updates: Imbalance zones extend forward in time until price interacts with them.
- Alert System: Users can set alerts for when new imbalances appear or when price tests an existing imbalance.
How It Works
The indicator identifies market imbalances using a three-bar price structure:
- Bullish Imbalance: Occurs when the high of three bars ago is lower than the low of the previous bar, forming a price gap.
- Bearish Imbalance: Occurs when the low of three bars ago is higher than the high of the previous bar, creating a downward gap.
When an imbalance is detected:
- Green Boxes indicate bullish imbalances.
- Red Boxes indicate bearish imbalances.
- Once price interacts with an imbalance, the box fades to gray, marking it as tested.
! Designed for Crypto Markets
This indicator is particularly useful in crypto markets, where frequent volatility can create price inefficiencies. It provides a structured way to visualize gaps in price movement, helping users analyze historical liquidity areas.
Customization Options
- Min Imbalance Percentage Size: Adjusts the sensitivity of the imbalance detection.
- Alerts: Users can enable alerts to stay notified of new or tested imbalances.
Important Notes
- This indicator is a technical analysis tool and does not provide trading signals or financial advice.
- It does not predict future price movement but highlights historical price inefficiencies.
- Always use this tool alongside other market analysis methods and risk management strategies.

TR FVG Finder 1.0TR FVG Finder 1.0 - Identify High-Probability Trading Zones
Unlock the power of Fair Value Gaps (FVGs) with this advanced TradingView indicator! Designed for traders seeking high-probability setups, the Fair Value Gap Detector identifies key price imbalances on your chart, helping you spot potential reversal and continuation zones with precision.
Key Features:
Accurate FVG Detection: Automatically detects bullish and bearish Fair Value Gaps based on a proven 3-candle pattern, highlighting areas where price is likely to return.
Customizable Display: Shows the most recent 3 FVGs by default (combined bullish and bearish), with an option to adjust the number of FVGs displayed.
Visual Clarity: Draws semi-transparent boxes (green for bullish FVGs, red for bearish FVGs) that extend 15 candles to the right, making it easy to track key levels.
Versatile for All Markets: Works on any timeframe and instrument—perfect for forex, stocks, crypto, and commodities like XAU/USD (gold).
User-Friendly: Simple to use with customizable settings, ideal for both beginner and experienced traders.
How It Works:
The indicator identifies FVGs by analyzing a 3-candle pattern:
- Bullish FVG: When the high of the candle two bars back is below the low of the current candle.
- Bearish FVG: When the low of the candle two bars back is above the high of the current candle. These gaps often act as magnets for price, making them powerful zones for trading strategies like breakouts, pullbacks, or reversals.
Why Use This Indicator?
- Enhance your technical analysis with a proven concept used by institutional traders.
- Spot high-probability trading opportunities with clear visual cues.
- Save time by automating FVG detection—no manual drawing required.
Best Practices:
- Use on lower timeframes (e.g., 15-minute or 1-hour) for more frequent FVGs, especially in volatile markets like forex or crypto.
- Combine with other indicators (e.g., support/resistance, volume) for confirmation.
- Ideal for strategies like ICT (Inner Circle Trader) concepts, Smart Money trading, and price action analysis.
Regards,
Trader Riaz

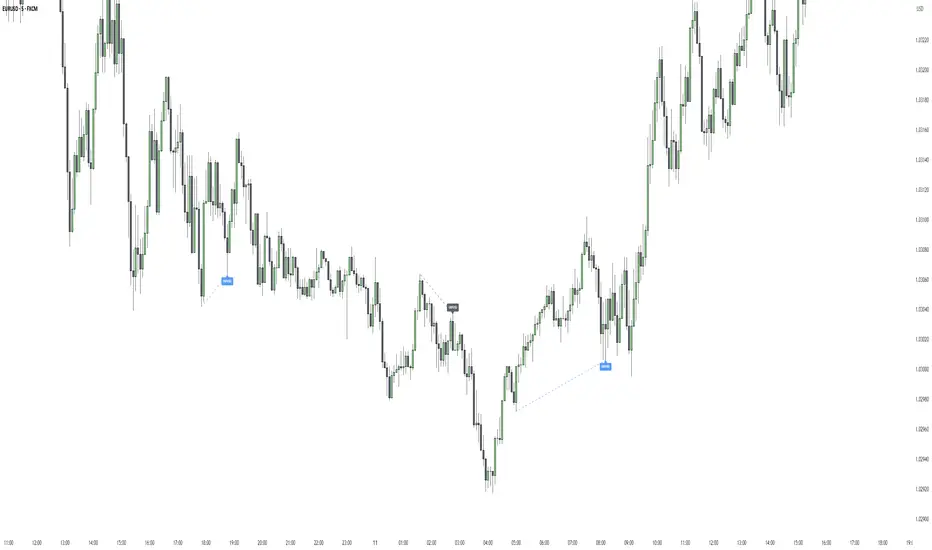
Quarterly Theory ICT 03 [TradingFinder] Precision Swing Points🔵 Introduction
Precision Swing Point (PSP) is a divergence pattern in the closing of candles between two correlated assets, which can indicate a potential trend reversal. This structure appears at market turning points and highlights discrepancies between the price behavior of two related assets.
PSP typically forms in key timeframes such as 5-minute, 15-minute, and 90-minute charts, and is often used in combination with Smart Money Concepts (SMT) to confirm trade entries.
PSP is categorized into Bearish PSP and Bullish PSP :
Bearish PSP : Occurs when an asset breaks its previous high, and its middle candle closes bullish, while the correlated asset closes bearish at the same level. This divergence signals weakness in the uptrend and a potential price reversal downward.
Bullish PSP : Occurs when an asset breaks its previous low, and its middle candle closes bearish, while the correlated asset closes bullish at the same level. This suggests weakness in the downtrend and a potential price increase.
🟣 Trading Strategies Using Precision Swing Point (PSP)
PSP can be integrated into various trading strategies to improve entry accuracy and filter out false signals. One common method is combining PSP with SMT (divergence between correlated assets), where traders identify divergence and enter a trade only after PSP confirms the move.
Additionally, PSP can act as a liquidity gap, meaning that price tends to react to the wick of the PSP candle, making it a favorable entry point with a tight stop-loss and high risk-to-reward ratio. Furthermore, PSP combined with Order Blocks and Fair Value Gaps in higher timeframes allows traders to identify stronger reversal zones.
In lower timeframes, such as 5-minute or 15-minute charts, PSP can serve as a confirmation for more precise entries in the direction of the higher timeframe trend. This is particularly useful in scalping and intraday trading, helping traders execute smarter entries while minimizing unnecessary stop-outs.
🔵 How to Use
PSP is a trading pattern based on divergence in candle closures between two correlated assets. This divergence signals a difference in trend strength and can be used to identify precise market turning points. PSP is divided into Bullish PSP and Bearish PSP, each applicable for long and short trades.
🟣 Bullish PSP
A Bullish PSP forms when, at a market turning point, the middle candle of one asset closes bearish while the correlated asset closes bullish. This discrepancy indicates weakness in the downtrend and a potential price reversal upward.
Traders can use this as a signal for long (buy) trades. The best approach is to wait for price to return to the wick of the PSP candle, as this area typically acts as a liquidity level.
f PSP forms within an Order Block or Fair Value Gap in a higher timeframe, its reliability increases, allowing for entries with tight stop-loss and optimal risk-to-reward ratios.
🟣 Bearish PSP
A Bearish PSP forms when, at a market turning point, the middle candle of one asset closes bullish while the correlated asset closes bearish. This indicates weakness in the uptrend and a potential price decline.
Traders use this pattern to enter short (sell) trades. The best entry occurs when price retests the wick of the PSP candle, as this level often acts as a resistance zone, pushing price lower.
If PSP aligns with a significant liquidity area or Order Block in a higher timeframe, traders can enter with greater confidence and place their stop-loss just above the PSP wick.
Overall, PSP is a highly effective tool for filtering false signals and improving trade entry precision. Combining PSP with SMT, Order Blocks, and Fair Value Gaps across multiple timeframes allows traders to execute higher-accuracy trades with lower risk.
🔵 Settings
Mode :
2 Symbol : Identifies PSP and PCP between two correlated assets.
3 Symbol : Compares three assets to detect more complex divergences and stronger confirmation signals.
Second Symbol : The second asset used in PSP and correlation calculations.
Third Symbol : Used in three-symbol mode for deeper PSP and PCP analysis.
Filter Precision X Point : Enables or disables filtering for more precise PSP and PCP detection. This filter only identifies PSP and PCP when the base asset's candle qualifies as a Pin Bar.
Trend Effect : By changing the Trend Effect status to "Off," all Pin bars, whether bullish or bearish, are displayed regardless of the current market trend. If the status remains "On," only Pin bars in the direction of the main market trend are shown.
Bullish Pin Bar Setting : Using the "Ratio Lower Shadow to Body" and "Ratio Lower Shadow to Higher Shadow" settings, you can customize your bullish Pin bar candles. Larger numbers impose stricter conditions for identifying bullish Pin bars.
Bearish Pin Bar Setting : Using the "Ratio Higher Shadow to Body" and "Ratio Higher Shadow to Lower Shadow" settings, you can customize your bearish Pin bar candles. Larger numbers impose stricter conditions for identifying bearish Pin bars.
🔵 Conclusion
Precision Swing Point (PSP) is a powerful analytical tool in Smart Money trading strategies, helping traders identify precise market turning points by detecting divergences in candle closures between correlated assets. PSP is classified into Bullish PSP and Bearish PSP, each playing a crucial role in detecting trend weaknesses and determining optimal entry points for long and short trades.
Using the PSP wick as a key liquidity level, integrating it with SMT, Order Blocks, and Fair Value Gaps, and analyzing higher timeframes are effective techniques to enhance trade entries. Ultimately, PSP serves as a complementary tool for improving entry accuracy and reducing unnecessary stop-outs, making it a valuable addition to Smart Money trading methodologies.

[TehThomas] - ICT SMT DivergencesIntroduction
SMT Divergences is a cutting-edge trading tool designed for traders who utilize Smart Money Techniques (SMT), a core concept in the Inner Circle Trader (ICT) methodology. This indicator is specifically built to detect SMT divergences by comparing price action across multiple correlated assets. It helps traders identify institutional activity, liquidity grabs, and inefficiencies in the market, offering valuable insights for high-probability trade setups.
Smart Money Techniques revolve around the idea that institutional traders and large market participants leave behind footprints in the form of price divergences. By analyzing multiple asset pairs simultaneously, this indicator helps traders pinpoint areas where one market structure contradicts another, revealing potential trade opportunities before the majority of retail traders notice them.
What is SMT Divergence?
Smart Money Divergence (SMT) occurs when correlated assets or markets behave differently in key areas of interest. These divergences often indicate market inefficiencies caused by liquidity grabs or institutional order flow. There are two main types of SMT divergences:
1. Bearish SMT Divergence (Smart Money Distribution) 🔴
Occurs when:
One asset makes a higher high, while another correlated asset makes a lower high.
This signals underlying weakness in the price action of the first asset.
Institutions may be offloading positions, preparing for a downward move.
📉 Example: If GBP/USD makes a higher high, but EUR/USD makes a lower high, it indicates potential weakness in GBP/USD and a possible short opportunity.
2. Bullish SMT Divergence (Smart Money Accumulation) 🔵
Occurs when:
One asset makes a lower low, while another correlated asset makes a higher low.
This suggests strength and potential accumulation by institutional traders.
Smart Money may be positioning for a bullish reversal.
📈 Example: If NASDAQ (US100) makes a lower low, but S&P 500 (US500) makes a higher low, it could indicate bullish strength in the stock market, suggesting a possible long trade.
How This Indicator Works
The SMT Divergences automatically identifies and plots SMT divergences on your chart, allowing you to spot hidden market imbalances at a glance.
🔍 Key Features
✅ Compare Up to 4 Assets Simultaneously – Select up to four correlated pairs to compare against the main charted asset.
✅ Automatic Detection of SMT Divergences – The script finds divergences in swing highs and swing lows and visually marks them on the chart.
✅ Customizable Line Styles & Colors – Adjust the appearance of the divergence lines and labels to suit your trading style.
✅ Smart Labeling System – Displays which asset pairs are diverging, making it easy to analyze market conditions.
✅ Works Across Multiple Markets – Use for Forex, Indices, Crypto, and Commodities, giving traders flexibility in different asset classes.
✅ Designed for ICT Traders – Aligns perfectly with other ICT concepts such as Liquidity Zones, Order Blocks, and Fair Value Gaps (FVGs).
🛠 Indicator Settings & Customization
The indicator provides various settings to tailor it to your trading preferences:
Pivot Lookback Length: Adjusts how many bars the indicator looks back to determine swing highs/lows.
Symbol Selection: Choose up to four additional assets to compare against your main trading pair.
Divergence Line Colors: Customize the color of bearish (red) and bullish (blue) divergences for better visibility.
Line Styles: Choose between solid, dotted, or dashed lines to highlight divergences in your preferred way.
Label Customization: Modify text color and display preferences for a clean and informative chart layout.
How to Use This Indicator in Your Trading Strategy
This indicator is best used in combination with other ICT concepts to improve confluence and increase trade accuracy. Here’s how you can integrate it into your trading strategy:
🔹 Step 1: Identify SMT Divergences
Wait for bullish or bearish SMT divergences to appear on your chart.
Check if the divergence aligns with key liquidity zones, fair value gaps (FVGs), or order blocks.
🔹 Step 2: Confirm Institutional Activity
Look for liquidity sweeps (stop hunts) before a potential reversal.
If a bearish SMT divergence forms near a major resistance level, it may signal Smart Money selling.
If a bullish SMT divergence forms near a support zone, it could indicate accumulation.
🔹 Step 3: Enter a Trade with Confluence
Combine SMT divergences with market structure shifts to time entries.
Use additional ICT tools like Premium & Discount Arrays, Volume Profile, and Market Maker Models for confirmation.
Set stop-losses above liquidity zones and aim for high-risk reward ratios.
🔹 Step 4: Manage Risk & Take Profits
Always use proper risk management, keeping an eye on liquidity grabs and market sentiment.
Consider taking partial profits at key structural points and letting the rest of the trade run.
Why This Indicator is a Game-Changer for ICT Traders
Traditional retail traders often fail to spot Smart Money footprints, which is why many struggle with false breakouts and liquidity traps. The - ICT SMT Divergences indicator eliminates this problem by providing a clear, visual representation of SMT divergences, allowing traders to track institutional movements in real-time.
🔹 Save Time – No need to manually compare charts; the script does the work for you.
🔹 Improve Accuracy – Get high-probability trade setups by following institutional footprints.
🔹 Enhance Your Trading Edge – Use SMT divergences in combination with liquidity grabs, order blocks, and fair value gaps to refine your strategy.
🔹 Universal Market Compatibility – Works for Forex, Indices, Crypto, Commodities, and even Stocks, giving you flexibility in different markets.
Final Thoughts
The SMT Divergences is a must-have tool for traders who rely on Smart Money Techniques (SMT) and ICT methodologies. By identifying SMT divergences across multiple correlated markets, this indicator provides unparalleled insights into institutional trading behavior and enhances your ability to trade with Smart Money.
Whether you are a day trader, swing trader, or position trader, this indicator will help you make more informed decisions, avoid liquidity traps, and improve your overall profitability.
__________________________________________
Thanks for your support!
If you found this idea helpful or learned something new, drop a like 👍 and leave a comment, I’d love to hear your thoughts! 🚀
Make sure to follow me for more price action insights, free indicators, and trading strategies. Let’s grow and trade smarter together! 📈
cd_mtg_CxThis indicator is designed to show discount / premium zones and price gaps (fvg) on the screen within a rule.
Overview:
As it is known, the price continues its movement with swings and uses some zones to continue or reverse its movement. Commonly used of these zones are named by different traders such as supply / demand, order block, suport/ resistance zone. And again, many traders prefer to be involved in the entry when the price determined with the help of market structure reaches the premium / discount zones.
Expectation from the indicator and how it works:
Identify areas where the price is likely to react.
Zones to be determined for this purpose:
1- Discount / premium zones
2- Mitigation zones with price retesting
3- Price gaps (FVG's)
How is it determined?
1- Tracks the price in the higher timeframe it is alignment with, when the price violates the previous candle in the new candle (high/low), the previous candle's zones between top/bottom - middle levels.
high - middle => premium zone
low - middle => discount zone
and displays it on the screen.
2- Mitigation zones: When the price retests the discount/premium zones, those zones appear on the screen by extending to the last bar and are named as mitigation zones in the indicator.
3- Price gaps (FVG's): It is shown on the screen with known rules and higher time frame option.
Zones where the price does not respect are deleted from the display.
Settings:
- HTF for mitigation zones : Alignment high time frame selection
- HTF for FVG zones : Alignment high time frame selection
- Show HTF boxes : Show / hide
- Show Mitigation zones : Show / hide
- Show Discount/Premium zones: Show / hide
- Show FVG zones : Show / hide
And colors….
Screenshots and example :
The 15m chart is open on the screen and I select the alignment time zone H4. I select the higher time zone H1 in FVGs.
Screenshot with Show HTF boxes and Show FVG zones selected:
With show discount / premium zones selected :
With show mitigation zones selected :
Final Word : When the price comes to our zone, we take action together with other confirmations.
Our expectation from the zones is to send the price back to the region it came from.
If it is not successful, we should plan a reverse transaction.
Cheerful trades...
-- Türkçe Açıklama
Bu indikatör, bir kural dahilinde ucuzluk / pahalılık bölgelerini ve fiyat boşluklarını (fvg) ekranda göstermek ve traderlara en uygun yerde işlem fırsatı sunmak üzere tasarlanmıştır.
Genel Bakış :
Bilindiği gibi fiyat hareketine salınımlarla devam eder ve hareketine devam etmek ya da tersine dönmek için bazı bölgeleri kullanır. Bu bölgelerin yaygın şekilde kullanılanları supply / demand, order block , support /resistance zone gibi farklı ekollerce adlandırılmıştır. Ve yine birçok trader market yapısı yardımla belirlediği fiyatın ucuzluk / pahalılık bölgelerine gelmesiyle işleme dahil olmayı tercih eder.
İndikatörden beklenti ve nasıl çalışır:
Beklenti; Fiyatın tepki alması muhtemel bölgeleri belirlemesidir.
Bu amaçla belirleyeceği bölgeler:
1- Ucuzluk / pahalılık bölgeleri
2- Fiyatın tekrar test etmesiyle “mitigasyon bölgeleri/mitige”
3- Fiyat boşlukları (FVG ler)
Nasıl belirler ?
1- Fiyatı uyumlu olduğu üst zaman diliminde takip eder, fiyat yeni mumda bir önceki mumu ihlal ettiğinde (high/low), önceki mumun tepe/dip - orta seviyeleri arasında kalan bölgeleri
high - middle => premium zone
low - middle => discount zone
olarak belirler ve ekranda gösterir.
2- Mitigasyon bölgesi: Fiyat ucuzluk/ pahalılık bölgeleri yeniden test ettiğinde, o bölgeler son bara uzatılarak ekranda görünür ve indikatörde ismi “mitigation zone” olarak geçer.
3- Fiyat boşlukları (FVG) : Bilinen kurallarla ve üst zaman dilimi seçeneğiyle ekranda gösterilir.
Fiyatın saygı göstermediği bölgeler ekrandan silinir.
Ayarlar:
- HTF for mitigation zones : Uyumlu üst zaman dilimi seçimi
- HTF for FVG zones : Uyumlu üst zaman dilimi seçimi
Gösterim ve renk seçenekleri.
Ekran görüntüleri ve örnek : (İngilizce kısımda)
Son söz : Fiyat bölgemize geldiğinde diğer konfirmelerle birlikte işlem alıyoruz.
Bölgelerden beklentimiz fiyatı geldiği bölgeye tekrar göndermesidir.
Eğer başarılı olamazsa tersi yönde işlem planlamalıyız.
Neşeli tradeler...

TJR SEEK AND DESTROYTJR SEEK AND DESTROY – Intraday ICT Trading Tool
Built for day traders, TJR SEEK AND DESTROY combines Smart Money concepts like order blocks, fair value gaps, and liquidity sweeps with structure breaks and daily bias to pinpoint high-probability trades during US market hours (9:30–16:00). Ideal for scalping or intraday strategies on stocks, futures, or forex.
What Makes It Unique?
Unlike standalone ICT indicators, this script integrates:
Order Blocks with volume and range filters for precise support/resistance zones.
Fair Value Gaps (FVG) to spot pre-market price imbalances.
Break of Structure (BOS) and Liquidity Sweeps for trend and reversal signals.
A 1H MA-based Bias to align trades with the day’s direction.
BUY/SELL Labels triggered only when bias, BOS, and sweeps align, reducing noise.
How Does It Work?
Order Blocks: Marks zones with high volume (>1.5x 20-period SMA) and low range (<0.5x ATR20) as teal boxes—potential reversal points.
Fair Value Gap: Compares the prior day’s close to the current open (pre- or post-9:30), shown as a purple line and label (e.g., "FVG: 0.005").
Pivot Point: Calculates (prevHigh + prevLow + prevClose) / 3 from the prior day, plotted as an orange line for equilibrium.
Break of Structure: Detects crossovers of 5-bar highs/lows (gray lines), marked with red triangles.
Liquidity Sweeps: Tracks breaches of the prior day’s high/low (yellow lines), marked with yellow triangles.
Daily Bias: Uses 1H close vs. 20-period MA (blue line) for bullish (green background), bearish (red), or neutral (gray) context.
Signals: BUY (green label) when bias is bullish, price breaks up, and sweeps the prior high; SELL (red label) when bias is bearish, price breaks down, and sweeps the prior low.
How to Use It
Setup: Apply to 1M–15M charts for US session trading (9:30–16:00 EST).
Trading:
Wait for a BUY label after a yellow sweep triangle above the prior day’s high in a green (bullish) background.
Wait for a SELL label after a yellow sweep triangle below the prior day’s low in a red (bearish) background.
Use order blocks (teal boxes) as support/resistance for stop-loss or take-profit.
Markets: Best for SPY, ES futures, or forex pairs with US session volatility.
Underlying Concepts
Order Blocks: High-volume, low-range bars suggest institutional activity.
FVG: Gaps between close and open indicate imbalance to be filled.
BOS & Sweeps: Price breaking key levels signals momentum or stop-hunting.
Bias: 1H MA filters trades by broader trend.
Chart Setup
Displays order blocks (teal boxes), pivot (orange), open (purple), bias (colored background), BOS/sweeps (triangles), and signals (labels). Keep other indicators off for clarity.

Advanced Market Structure & Order Blocks (fadi)Advanced Market Structure & Order Blocks indicator provides a new approach to understanding price action using ICT (Inner Circle Trader) concepts related to candle blocks to analyze the market behavior and eliminate much of the noise created by the price action.
This indicator is not intended to provide trade signals, it is designed to provide the traders with to support their trading strategies and add clarity where possible.
There are currently three main elements to this indicator:
Market Structure
Order Blocks
Liquidity Voids
Market Structure
In trading, market structure is often identified by observing higher highs and higher lows. An uptrend is characterized by a series of higher highs, where each peak surpasses the previous one, and higher lows, where each trough is higher than the preceding one. Conversely, a downtrend is marked by lower highs and lower lows.
Other indicators usually determine these peaks by calculating the highest or lowest levels within a predefined number of candles. For example, identifying the highest price level within the last 15 candles and marking it as a higher high or a lower high. While this approach offers some structure to price action, it can be arbitrary and random due to price fluctuations and the lack of proper structure analysis beyond finding the highest peaks and valleys within candle ranges.
In his 2022 mentorship, episode 12, ICT introduced an alternative approach focusing on three-candle pivots called Short Term High and Low (STH/STL), which are then used to calculate the Intermediate Term High and Low (ITH/ITL), and in turn, the Long Term High and Low (LTH/LTL). ICT’s approach provides better structure than the traditional method mentioned above. However, it can be confusing and difficult to track. There are great indicators that track and label ICT’s levels, but traders still find it challenging to follow and understand.
The Advanced Market Structure indicator takes a unique approach by analyzing candle formations, using ICT concepts, to identify possible turning points that mimic a real trader’s analysis of price action as closely as possible. However, it should be expected that Market Makers may use market manipulation to induce traders to make failed trades, and no tooling can eliminate these situations.
Advanced Market Structure tracks true Peaks and Valleys as they form, confirms them, and marks the chart with corresponding labels using traditional labeling methods (HH/HL/LH/LL), as such labeling makes it easier for traders to follow and understand. The indicator also draws levels to help identify possible liquidity areas and trade targets.
The indicator uses different calculation methods for the different type of market structure length, however all calculations are based on the same ICT candle blocks concepts.
Market Structure Settings
Other than the display settings, there are four (4) settings, mainly under the Level Settings section.
Allow Nested Candles
This option is only available on the Short Market Structure due to the methods used in calculating highs and lows. When used, the indicator will attempt to detect smaller fluctuations in price by tracking smaller candle moves, if any.
Level Settings
Level Settings allows the trader to decide two main calculations:
1. A new pivot point will form when a candle’s is crossed by the following candle’s
2. For a liquidity sweep and marking a level as mitigated, a candle’s must cross that level
Order Blocks
ICT (Inner Circle Trader) defines an Order Block as the last down-closing candle, or series of candles, before a significant upward price move or the last up-closing candle, or series of candles, before a significant downward price move. These key price levels, marked by substantial buy or sell orders from institutional traders or "smart money," create a block or zone on the price chart. When the price revisits these levels, it often leads to a strong market reaction. Order Blocks can consist of one or multiple consecutive candles of the same color, signaling areas of significant buying or selling interest. ICT's approach to Order Blocks provides traders with a structured method to identify potential areas of support or resistance, where price movements are more likely to change direction. Although ICT has shared some criteria for identifying Order Blocks publicly, the full details are reserved for his upcoming books. This indicator leverages the publicly available information to provide traders with valuable insights into these crucial price levels.
The Advanced Market Structure indicator is designed to be highly flexible, allowing traders to define their own combination of rules for identifying Order Blocks, thus customizing it to fit their unique trading strategies.
Order Block Configuration
Can be nested
An Order Block is defined as the last down candle or candles before a strong move higher, and vice versa for bearish Order Blocks. However, larger-than-usual candles resulting from news events or price action may not qualify as Order Blocks and can mute any Order Block within their range.
The "Can be nested" flag ensures that each Order Block is treated as an independent entity, even if it appears within the body of another Order Block.
Forms at swing point
Order Blocks formed at swing points typically have higher probabilities but are less frequent, assuming the same rules are applied. Additionally, Order Blocks at swing points may become Breaker and Mitigation blocks if they fail, providing more trading opportunities.
Forms a simple pivot point
A simple pivot point corresponds to ICT Short Term High and Low (STH/STL). Order Blocks using simple pivot points can occur in the middle of a move, not just at swing points. These are useful for identifying IOFED setups and supporting blocks that can bolster the price move.
Causes Market Structure Shift
Order Blocks that result in a break above or below a short swing point can help narrow down target order blocks, but they are less frequent. An Order Block causing a break above or below a pivot point does not necessarily indicate a strong Order Block. For example, an Order Block formed at a Lower Low is more likely to fail in a downtrend.
A clean close above order block
When the first candle breaks above an Order Block and closes above its high, this indicates a stronger Order Block. On the other hand, if a candle merely wicks through the Order Block without a solid close above it, it suggests a weaker Order Block. This may indicate hesitation or an impending reversal, as the wick represents a temporary and unsustained price movement.
Has displacement more than X the body
While some traders may capitalize on the initial break above an Order Block's CISD level, others prefer to focus on the return to an Order Block after displacement. Displacement is determined by the body size of the Order Block, and an Order Block cannot be tested until this level has been achieved.
Has a Fair Value Gap
When an Order Block is combined with a Fair Value Gap (FVG), it signifies a strong Order Block. The Fair Value Gap indicates a strong price movement away from the Order Block.
Has a liquidity void
A Liquidity Void occurs when two consecutive candles of the same color do not overlap, creating a gap similar to a Fair Value Gap, but involving one or more middle candles. Liquidity Voids can be utilized in combination with, or as an alternative to, the displacement setting.
Maximum number of OBs
The maximum number of Order Blocks to display.
Mitigated at block’s
An Order Block is considered mitigated when price reaches one of the main Order Block levels.
Liquidity Void
Liquidity Void refers to areas on a price chart where there is one-sided trading activity. This phenomenon occurs when the price of an asset moves sharply in one direction, leaving gaps where two consecutive candles of the same color do not overlap. These gaps can comprise one or more middle candles and indicates a pronounced lack of trading within that price range. Liquidity Voids are important because they highlight areas of minimal resistance, where price is more likely to return to fill the void and balance the market.
Liquidity Void vs Fair Value Gap
While both concepts are related to gaps in price action, they are distinct. A Fair Value Gap is a specific three-candle pattern where the middle candle creates a gap between the first and third candles. In contrast, a Liquidity Void represents a broader area on the chart where there is little to no trading activity, often encompassing multiple candles and indicating a more pronounced imbalance between buy and sell orders.
A FVG can be part of a Liquidity Void, a Liquidity Void can exist without necessarily including an FVG. Both concepts highlight areas of minimal resistance and potential price movement, but they differ in their formation and implications.
Advanced Market Structure and Order Blocks indicator focus on liquidity voids since a liquidity void can substitute for a FVG and it is usually less addressed by other indicators.

18:00 Wick Gap Rectangles18:00 wick gaps, the upper and lower wick gaps are marked out on each 18:00 candle with a customization feature to have all 18:00 wick gaps spanning over a certain time period on your chart.

ICT NY Kill Zone Auto Trading### **ICT NY Kill Zone Auto Trading Strategy (5-Min Chart)**
#### **Overview:**
This strategy is based on Inner Circle Trader (ICT) concepts, focusing on the **New York Kill Zone**. It is designed for trading GBP/USD exclusively on the **5-minute chart**, automatically entering and exiting trades during the US session.
#### **Key Components:**
1. **Time Filter**
- The strategy only operates during the **New York Kill Zone (9:30 AM - 11:00 AM NY Time)**.
- It ensures execution only on the **5-minute timeframe**.
2. **Fair Value Gaps (FVGs) Detection**
- The script identifies areas where price action left an imbalance, known as Fair Value Gaps (FVGs).
- These gaps indicate potential liquidity zones where price may return before continuing in the original direction.
3. **Order Blocks (OBs) Identification**
- **Bullish Order Block:** Occurs when price forms a strong bullish pattern, suggesting further upside movement.
- **Bearish Order Block:** Identified when a strong bearish formation signals potential downside continuation.
4. **Trade Execution**
- **Long Trade:** Entered when a bullish order block forms within the NY Kill Zone and aligns with an FVG.
- **Short Trade:** Entered when a bearish order block forms within the Kill Zone and aligns with an FVG.
5. **Risk Management**
- **Stop Loss:** Fixed at **30 pips** to limit downside risk.
- **Take Profit:** Set at **60 pips**, providing a **2:1 risk-reward ratio**.
6. **Visual Aids**
- The **Kill Zone is highlighted in blue** to help traders visually confirm the active session.
**Objective:**
This script aims to **capitalize on institutional price movements** within the New York session by leveraging ICT concepts such as FVGs and Order Blocks. By automating trade entries and exits, it eliminates emotions and ensures a disciplined trading approach.

Turtle Soup Model [PhenLabs]📊 Turtle Soup Model
Version: PineScript™ v6
Description
The Turtle Soup Model is an innovative technical analysis tool that combines market structure analysis with inter-market comparison and gap detection. Unlike traditional structure indicators, it validates market movements against a comparison symbol (default: ES1!) to identify high-probability trading opportunities. The indicator features a unique “soup pattern” detection system, comprehensive gap analysis, and real-time structure breaks visualization.
Innovation Points:
First indicator to combine structure analysis with gap detection and inter-market validation
Advanced memory management system for efficient long-term analysis
Sophisticated pattern recognition with multi-market confirmation
Real-time structure break detection with comparative validation
🔧 Core Components
Structure Analysis: Advanced pivot detection with inter-market validation
Gap Detection: Sophisticated gap identification and classification system
Inversion Patterns: “Soup pattern” recognition for reversal opportunities
Visual System: Dynamic rendering of structure levels and gaps
Alert Framework: Multi-condition notification system
🚨 Key Features 🚨
The indicator provides comprehensive analysis through:
Structure Levels: Validated support and resistance zones
Gap Patterns: Identification of significant market gaps
Inversion Signals: Detection of potential reversal points
Real-time Comparison: Continuous inter-market analysis
Visual Alerts: Dynamic structure break notifications
📈 Visualization
Structure Lines: Color-coded for highs and lows
Gap Boxes: Visual representation of gap zones
Inversion Patterns: Clear marking of potential reversal points
Comparison Overlay: Inter-market divergence visualization
Alert Indicators: Visual signals for structure breaks
💡Example
📌 Usage Guidelines
The indicator offers multiple customization options:
Structure Settings:
Pivot Period: Adjustable for different market conditions
Comparison Symbol: Customizable reference market
Visual Style: Configurable colors and line widths
Gap Analysis:
Signal Mode: Choice between close and wick-based signals
Box Rendering: Automatic gap zone visualization
Middle Line: Reference point for gap measurements
✅ Best Practices:
🚨Use comparison symbol from related market🚨
Monitor both structure breaks and gap inversions
Combine signals for higher probability trades
Pay attention to inter-market divergences
⚠️ Limitations
Requires comparison symbol data
Performance depends on market correlation
Best suited for liquid markets
What Makes This Unique
Inter-market Validation: Uses comparison symbol for signal confirmation
Gap Integration: Combines structure and gap analysis
Soup Pattern Detection: Identifies specific reversal patterns
Dynamic Structure Management: Automatically updates and removes invalid levels
Memory-Efficient Design: Optimized for long-term chart analysis
🔧 How It Works
The indicator processes market data through three main components:
1. Structure Analysis:
Detects pivot points with comparison validation
Tracks structure levels with array management
Identifies and processes structure breaks
2. Gap Analysis:
Identifies significant market gaps
Processes gap inversions
Manages gap zones visualization
3. Pattern Recognition:
Detects “soup” patterns
Validates with comparison market
Generates structure break signals
💡 Note: The indicator performs best when used with correlated comparison symbols and appropriate timeframe selection. Its unique inter-market validation system provides additional confirmation for traditional structure-based trading strategies.

LRLR [TakingProphets]LRLR (Low Resistance Liquidity Run) Indicator
This indicator identifies potential liquidity runs in areas of low resistance, based on ICT (Inner Circle Trader) concepts. It specifically looks for a series of unmitigated swing highs in a downtrend that form without any bearish fair value gaps (FVGs) between them.
What is an LRLR?
- A Low Resistance Liquidity Run occurs when price creates a series of lower highs without any bearish fair value gaps in between
- The absence of bearish FVGs indicates there is no significant resistance in the area
- These formations often become targets for smart money to collect liquidity above the swing highs
How to Use the Indicator:
1. The indicator will draw a diagonal line connecting a series of qualifying swing highs
2. A small "LRLR" label appears to mark the pattern
3. These areas often become targets for future price moves, as they represent zones of accumulated liquidity with minimal resistance
Key Points:
- Minimum of 4 consecutive lower swing highs
- No bearish fair value gaps can exist between these swing highs
- The diagonal line helps visualize the liquidity run formation
- Can be used for trade planning and identifying potential reversal zones
Settings:
- Show Labels: Toggle the "LRLR" label visibility
- LRLR Line Color: Customize the appearance of the diagonal line
Best Practices:
1. Use in conjunction with other ICT concepts and market structure analysis
2. Pay attention to how price reacts when returning to these levels
3. Consider these areas as potential targets for smart money liquidity grabs
4. Most effective when used on higher timeframes (4H and above)
Note: This is an educational tool and should be used as part of a complete trading strategy, not in isolation.

Line Break Chart StrategyHello All!
We should not pass this year without a gift!
My last publication in 2024 is Complete Line Break Chart Strategy with many features!
What is Line Break Chart?
" Line Break is a Japanese chart style that disregards time intervals and only focuses on price movements, similar to the Kagi and Renko chart styles. Line Break charts form a series of up and down bars (referred to as lines). Up lines represent rising prices, and down lines represent falling prices. New confirmed lines only form on the chart when closing prices break the range covered by previous lines. Users can control the number of past lines used in the calculation via the "Number of Lines" input in the chart settings. The typical "Number of Lines" setting is 3, meaning the chart forms a new up line when the closing price is above the high prices of the last three lines, and it forms a new down line when the closing price is below the past three lines' low prices. If the current price is higher, it is an up line and if it is lower, it is a down line. If the current closing price is the same or the move in the opposite direction is not large enough to warrant a reversal, l then no new line is draw n" by Tradingview. You can find it here
Now let's start examining the features of the indicator:
By using Line break reversals it shows trend on the main chart. You can create alert .
Moreover, you can decide which trade should be taken by using Risk Management in the indicator. You can set the " Maximum Risk " and then if the risk is more than you set then the trade is not taken. When trend changed it checks the distance between reversal level and open price and compare it with the Maximum Risk
Breakout:
It can find breakouts and shows on the chart. You can create alert for breakouts
It can show breakouts on the main chart:
Flip-Flops:
Upon looking at set of price break charts, the trader will notice that there are instances when uptrend blocks is followed by one reversal block, and then by a reversal to a series of uptrend blocks. The opposite is also possible: a series of downtrend blocks is followed by one reversal box and then by an immediate reversal to downtrend. This price action is called a " Flip-Flop ". This structure usually produces trend continuation signal. when we see this then we better use Buy/Sell stop order. lets see this on the chart:
Temporal Sequence Table:
Sequence frequency shows the frequency distribution of the number of sequential highs and the number of sequential lows that have been generated. This is quite important to the trader who is seeking to join a trend or put on a trade when the price break reverses into a new trend direction. For example, if the pattern over the past year has been that there never were more than nine consecutive high closes, it would make sense not to enter a position late into the sequence of new high closes.
also you can see market structure. I have tried to formalize it and show it under the table. so you can understand if it's choppy market.
"Number of Lines" has very important role. While using low time frames such seconds/minutes time frame you may want to choose higher number of lines such 5,6. ( this may minimize the risk of a whipsaw )
Gaps feature:
You can set Gaps on/off. if Gaps on then you can see how long it takes for each box
Reversal and Continuation Probability:
The script calculated Reversal level and Continuation probability of the trend by using Sequence frequency.
It also shows unconfirmed box and current closing price level:
Last but not least it has Overlay option for all items, and can show all items in the main chart!
P.S. I added alerts :)
Wish you all a happy new year!
Enjoy!

FVG - Fair Value Gap Detector with Large Movement FilterScript Description: Fair Value Gap (FVG) Detector with Large Movement Filter
This indicator is designed to identify Fair Value Gaps (FVG), which are price imbalances observed between three consecutive candles. Fair Value Gap detection is commonly used by traders to locate areas of imbalance where demand and supply temporarily lose equilibrium. This imbalance often draws price back to these zones, making them potential points of interest for buy or sell opportunities.
Key Features of the Indicator
FVG Detection Based on Three Consecutive Candles:
The script identifies a Fair Value Gap between three consecutive candles. This gap appears when the high of the first candle is below the low of the third candle (or vice versa). These gap zones are significant as they indicate an imbalance in price between buyers and sellers, with the expectation that price may revisit these areas in the future.
Large Movement Filter Using ATR:
To improve accuracy and avoid false signals in minor price fluctuations, this indicator includes a large movement filter based on the Average True Range (ATR). The ATR is calculated over a configurable period, and a multiplier is applied to set the minimum required range for a large movement. This helps ensure that only gaps in areas with significant price movement are identified.
Visual Differentiation with Customizable Colors:
The script allows users to configure FVG box colors for easy gap visualization. Identified zones on the chart are highlighted with a colored box, making it easy for the trader to identify imbalance points and observe potential mitigation.
FVG Mitigation and Capture:
The indicator continuously checks if the price is within the FVG zone, indicating that the gap has been mitigated or “captured” by the price. The mitigation or capture status is displayed visually on the chart, using a color scheme to indicate whether the gap has been retested by price after its creation.
How to Use the Indicator
Configuring Parameters:
ATR Multiplier: Defines how large a movement relative to ATR is required for the gap to be considered significant. Higher values require larger movements.
ATR Period: Sets the number of candles used in the ATR calculation, affecting the sensitivity to large movements.
Customizable Colors: Traders can adjust the FVG box colors and labels indicating mitigation and capture of the imbalance zones.
Visual Interpretation:
FVG Boxes: Colored boxes will appear on the chart to highlight gap zones. These boxes only display following the detection of a large movement, as defined by ATR.
Mitigation and Capture Labels: The indicator places a label below the bar when a gap is identified, highlighting zones where gaps may be mitigated or captured. The color scheme helps traders quickly interpret the status of a gap.
Underlying Concepts and Practical Application
The Fair Value Gap is widely used in liquidity analysis and price reversal zones. By identifying FVG zones based on large price movements, this script enables traders to monitor potential gap-fill areas. With the large movement filter, the indicator is ideal for strategies that prioritize liquidity and price zone mitigation, making it useful for both short-term (scalping) and long-term strategies.
This indicator provides a solid foundation for traders interested in observing price imbalances and future mitigations.

Candle Range Theory | Flux Charts💎 GENERAL OVERVIEW
Introducing our new Candle Range Theory Indicator! This powerful tool offers a strategy built around the Candle Range Theory, which analyzes market movements through the relative size and structure of price candles. For more information about the process, check the "HOW DOES IT WORK" section.
Features of the new Candle Range Theory Indicator :
Implementation of the Candle Range Theory
FVG & Order Block Entry Methods
2 Different TP / SL Methods
Customizable Execution Settings
Customizable Backtesting Dashboard
Alerts for Buy, Sell, TP & SL Signals
📌 HOW DOES IT WORK ?
The Candle Range Theory (CRT) indicator operates by identifying significant price movements through the relative size and structure of candlesticks. A key part of the strategy is determining large candles based on their range compared to the Average True Range (ATR) in a higher timeframe. Once identified, a breakout of either the high wick or the low wick of the large candle is required. This breakout is considered a liquidity grab. After that, the indicator waits for confirmation through Fair Value Gaps (FVGs) or Order Blocks (OBs). The confirmation structure must be the opposite direction of the breakout, for example if the high wick is broken, a bearish FVG is required for the short entry. After a confirmation signal is received, the indicator will trigger entry points based on your chosen entry method (FVG or OB), and exit points will be calculated using either a dynamic ATR-based TP/SL method or fixed percentages. Alerts for Buy, Sell, Take-Proft, and Stop-Loss are available.
🚩 UNIQUENESS
This indicator stands out because it combines two highly effective entry methods: Fair Value Gaps (FVGs) and Order Blocks (OBs). You can choose between these strategies depending on market conditions. Additionally, the dynamic TP/SL system uses the ticker's volatility to automatically calculate stop-loss and take-profit targets. The backtesting dashboard provides metrics about the performance of the indicator. You can use it to tune the settings for best use in the current tiker. The Candle Range Theory approach offers more flexibility compared to traditional indicators, allowing for better customization and control based on your risk tolerance.
⚙️ SETTINGS
1. General Configuration
Higher Timeframe: Customize the higher timeframe for analysis. Recommended combinations include M15 -> H4, H4 -> Daily, Daily -> Weekly, and Weekly -> Monthly.
HTF Candle Size: Define the size of the higher timeframe candles as Big, Normal, or Small to filter valid setups based on their range relative to ATR.
Entry Mode: Choose between FVGs and Order Blocks for your entry triggers.
Require Retracement: Enable this option if you want a retracement to the FVG or OB for entry confirmation.
Show HTF Candle Lines: Toggle to display the higher timeframe candle lines for better visual clarity.
2. Fair Value Gaps
FVG Sensitivity: You may select between Low, Normal, High or Extreme FVG detection sensitivity. This will essentially determine the size of the spotted FVGs, with lower sensitivities resulting in spotting bigger FVGs, and higher sensitivities resulting in spotting all sizes of FVGs.
3. Order Blocks
Swing Length: Swing length is used when finding order block formations. Smaller values will result in finding smaller order blocks.
4. TP / SL
TP / SL Method:
a) Dynamic: The TP / SL zones will be auto-determined by the algorithm based on the Average True Range (ATR) of the current ticker.
b) Fixed : You can adjust the exact TP / SL ratios from the settings below.
Dynamic Risk: The risk you're willing to take if "Dynamic" TP / SL Method is selected. Higher risk usually means a better winrate at the cost of losing more if the strategy fails. This setting is has a crucial effect on the performance of the indicator, as different tickers may have different volatility so the indicator may have increased performance when this setting is correctly adjusted.

LIT_Globas_sys - Liquidity Inducement Theorem (SMC, IDM)LIT_GLOBAL_SYS Trading Tool Documentation, is a comprehensive market analysis tool that includes all components needed for trading according to Liquidity Inducement Theorem (LIT). LIT differs from classical trading methods and is considered a highly effective and profitable strategy.
What can LIT_GLOBAL_SYS do?
--- Market Structure
The main feature of Liquidity Inducement Theorem is building the correct structure, specifically construction taking into account inducement (IDM). Thus, a new HH or LL can only form when the price has taken the first correct pullback - inducement (IDM), and after this, we understand the location of BoS (break of structure) and CHoCH (change of character).
LIT_GLOBAL_SYS automatically and perfectly displays the correct structure following all LIT rules. Looking at the indicator, a trader always understands which range the price is currently in and where it's trending at the moment. The indicator also shows dynamic (live) levels, providing a clear understanding of the market structure in real-time.
The indicator settings allow customization of each structural element according to trader preferences. For example, you can change the style, color, and shape of structural objects.
--- Correct Pullbacks and Inside Bars
In Liquidity Inducement Theorem, correct pullbacks are fundamental. The structure, order blocks, liquidity levels, order flow, and single candle order blocks (CSOB) are all built based on pullbacks.
What is a pullback?
- When the next candle updates the low of the previous candle, we can finish drawing an upward pullback
- We can start drawing a downward correct pullback when the next candle updates the low of the previous candle
- The downward movement will continue until the opposite occurs - updating the high of the previous candle
There are complexities in determining pullbacks - these are inside bars. In Liquidity Inducement Theorem, inside bars are completely ignored!
For example, in an upward movement, at some point, candles may stop updating the high and low of the previous candle and remain within the boundaries of the previous candle. Theoretically, there could be any number of such candles from 1 to infinity. In such cases, it's important to wait for the price to exit the mother candle (the candle after which other candles remained within its high and low range).
LIT_GLOBAL_SYS easily handles this and displays both pullbacks and inside bars correctly.
--- Order Blocks and Fair Value Gaps (FVG)
In Liquidity Inducement Theorem, order blocks are defined differently from classical order blocks:
1. The order block must take liquidity from the previous candle
2. The order block must have Fair Value Gaps (FVG) before it
3. Inside bars are completely ignored for both Order Blocks and FVG
4. If an OB fulfills the first condition (taking liquidity from the previous candle) but doesn't have FVG before it, this block is moved forward along the candles until there is an imbalance before it
There are two most important order blocks in LIT strategy:
1. Inducement order block (idm ob) - the first order block after Inducement
2. Extreme order block (Ext ob) - the first order block before CHoCH
LIT_GLOBAL_SYS perfectly displays correct order blocks and Fair Value Gaps following all rules. It offers full customization options:
- Specify the number of displayed OBs
- Disable all order blocks except idm ob and Ext ob
- Change block frame color and style
- Disable or modify text display in blocks
--- Single Candle Order Block (Scob)
Rules for building Scob:
1. The candle takes liquidity from the previous candle and closes within the body of the previous candle
2. The candle following the Scob candle must close its body below the previous candle
3. Scob forms in continuation of the trend movement
4. Scob completely ignores inside bars
LIT_GLOBAL_SYS accurately displays Scob as triangles and fully ignores inside bars both left and right. The menu allows complete customization of display and quantity of displayed Scobs.
--- Liquidity Lines, Order Flow, and Three-Minute Rule
Auxiliary functions include:
- Liquidity Lines -
Each pullback is marked with a line, showing where unclosed liquidity exists. Completed lines can be hidden to help predict price movement and enter trades correctly.
- Order Flow -
The indicator implements order flow by drawing a line when a pullback is broken (closed by body) in the opposite direction until the second touch. If price moves away without a second touch, the line remains, showing unclosed OF and potential price return zones.
- Three-Minute Rule -
Some LIT traders use the three-minute rule: price manipulations in the last and first three minutes of each 15-minute candle are additional entry factors, especially in the last quarter of an hourly candle. LIT_GLOBAL_SYS displays this rule only on the one-minute timeframe with symbols below for M15 and H1.
--- Trading Sessions, PDH/PDL, and EMA
The system includes:
- Trading sessions (Tokyo, Frankfurt, London, New York) with customizable time settings
- Previous Day High and Previous Day Low (pdh/pdl) levels
- Exponential Moving Average (EMA) with adjustable length
- Equilibrium display between current BoS and CHoCH levels
--- Alert System
LIT_GLOBAL_SYS includes all necessary alerts for Liquidity Inducement Theorem:
1. SCOB
2. EMA
3. BoS, ChoCh, Sweep
4. IDM
5. IDM OB and Ext OB
Users can simply check the desired alerts in the menu and activate them to receive notifications when price reaches specified zones.

HTF Inversion Fair Value Gap | Flux Charts💎 GENERAL OVERVIEW
Introducing our new Higher Timeframe Inversion Fair Value Gaps (IFVG) indicator! Inversion Fair Value Gaps occur when a Fair Value Gap becomes invalidated. They reverse the role of the original Fair Value Gap, making a bullish zone bearish and vice versa. This indicator finds the latest IFVG in a higher timeframe and renders it in the current chart with it's divergence. For more information about the process, read the "HOW DOES IT WORK" section of the description.
Features of the new Higher Timeframe IFVG Indicator :
Renders The Higher Timeframe IFVG
Invalidation Borders
Variety Of Zone Detection / Sensitivity / Filtering / Invalidation Settings
High Customizability
🚩 UNIQUENESS
This indicator lets you take a look at the bigger picture by rendering the latest IFVG in a higher timeframe. You can see the current IFVG divergence to see how is the price action acting around the IFVG. You also can customize the FVG Filtering method, FVG & IFVG Zone Invalidation, Detection Sensitivity etc. according to your needs to get the best performance from the indicator.
📌 HOW DOES IT WORK ?
A Fair Value Gap generally occur when there is an imbalance in the market. They can be detected by specific formations within the chart. An Inversion Fair Value Gap is when a FVG becomes invalidated, thus reversing the direction of the FVG.
This indicator then renders the IFVG in a higher timeframe in your chart like this :
The opaque dashed lines at the top and the bottom of the IFVG indicate the bars that formed the original FVG. The middle dashed line that is semi-transparent shows the candlestick that invalidated the original FVG, thus created the current IFVG. The vertical solid top & bottom wicks indicate the current divergence of the highest & lowest points to the current IFVG.
The IFVGs can act as strong support & resistance points, depending on their creation volume and invalidation volume. Traders can use them for confirmation signals to their positions.
⚙️ SETTINGS
1. General Configuration
Higher Timeframe -> The higher timeframe to detect latest IFVG from. Keep in mind that his setting must be higher than the current timeframe.
IFVG Zone Invalidation -> Select between Wick & Close price for IFVG Zone Invalidation.
2. Fair Value Gaps
FVG Zone Invalidation -> Select between Wick & Close price for FVG Zone Invalidation.
Zone Filtering -> With "Average Range" selected, algorithm will find FVG zones in comparison with average range of last bars in the chart. With the "Volume Threshold" option, you may select a Volume Threshold % to spot FVGs with a larger total volume than average.
FVG Detection -> With the "Same Type" option, all 3 bars that formed the FVG should be the same type. (Bullish / Bearish). If the "All" option is selected, bar types may vary between Bullish / Bearish.
Detection Sensitivity -> You may select between Low, Normal or High FVG detection sensitivity. This will essentially determine the size of the spotted FVGs, with lower sensitivities resulting in spotting bigger FVGs, and higher sensitivities resulting in spotting all sizes of FVGs.
3. Dasboard
You can enable / disable the mitigation dashboard and customize it here.
4. Customization
Offset -> The number of candlesticks the IFVG will be rendered to the right of the latest bar.
Width -> The width of the rendered IFVG in candlesticks.
