[MF] Auto Fibonacci LevelsDescription:
Automatically draw Fibonacci Pivot levels based on the previous (day's, week's or month's)
Range ( High-Low ). The HLC3 is used as the default Pivot level.
Unlike the "Auto Fibonacci Levels", this variation does not update
Levels on current day even if the price goes past the R3/S3 levels.
Timeframes: 1D, 1W, 1M
Range = (High - Low) - From previous Day, Week or month.
FIB LEVELS:
- Yellow = Pivot and Pivot Zone (HLC3 by default)
- red = R1,S1 Levels 0.236 * Range
- Green = R2,S2 Levels 0.368 * Range
- Lime = R3,S3 Levels 0.618 * Range
- Blue = R4,S4 Levels 0.786 * Range
- Gray = R5,S5 Levels 1.000 * Range
- Lime = R6,S6 Levels 1.236 * Range
- Red = R7,S7 Levels 1.382 * Range
- Blue = R8,S8 Levels 1.618 * Range
- Green = R9,S9 Levels 2.000 * Range
CLASSIC LEVELS:
- Yellow = Pivot and Pivot Zone (HLC3)
- Green = R1,S1 Levels (Pivot*2 - Low), (Pivot*2 - High)
- Lime = R2,S2 Levels ( Pivot + Range), ( Pivot - Range)
- Lime = R3,S3 Levels (High + 2*( Pivot - Low)), (Low - 2*(High - Pivot ))
- Blue = R4,S4 Levels (High + 3*( Pivot - Low)), (Low - 3*(High - Pivot ))
Refrences:
- Auto Daily Fib Levels R3.0 by JustUncleL
- Auto Fib by TheYangGuizi
- Monthly Dynamic Range Levels (Fibonaci) V0 by RicardoSantos
Modifications:
- Added next FIB Levels. (changes during the current cycle)
- Added FIB 0.236 Levels
- Added Option to change the colors of the Fib Levels
- Changed Default colors to the colors of Tradingview
- Upgraded to Version4 Pinescript
Buscar en scripts para "fib"

Fibonacci LevelsThe 420 VWMA (Volume Weighted Moving Average) per period selected of the low price (Fib 0) and the high price (Fib 1). They are labeled in Color of the line they represent.
The other Fib lines are calculated using common fib ratios as follows:
longRange_fib2618 = highestHighperLongRange +
(highestHighperLongRange - lowestLowperLongRange) * 1.618
longRange_fib1618 = highestHighperLongRange +
(highestHighperLongRange - lowestLowperLongRange) * .618
longRange_fib786 = highestHighperLongRange -
(highestHighperLongRange - lowestLowperLongRange) * 0.236
longRange_fib618 = highestHighperLongRange -
(highestHighperLongRange - lowestLowperLongRange) * 0.382
longRange_fib50 = highestHighperLongRange -
(highestHighperLongRange - lowestLowperLongRange) * 0.500
longRange_fib382 = highestHighperLongRange -
(highestHighperLongRange - lowestLowperLongRange) * 0.618
longRange_fib236 = highestHighperLongRange -
(highestHighperLongRange - lowestLowperLongRange) * 0.764
Those lines are drawn and labeled to right of chart
The 2 heavy whites and the short range of the Fib1 (Top) and Fib0 (Bottom). Eyes on chart when it approaches one those two points. This is where I look for continuation or reversal patterns, especially near a Longterm Fib
The Red, Green, Yellow and Blue are colored ratio lines that I am experimenting with and will later combine with a multiple time frames to show discernable patterns of potential near future movements.
The prices interacts with the fib lines and each of the the colored ratio lines as you go from small to larger time frames.
I will be publishing this soon to allow the community to improve on it.

TradeChartist ZigZag & Auto Fibonacci Retracement™TradeChartist ZigZag & Auto Fibonacci Retracement is a visually engaging script that generates ZigZag and Auto-Fibonacci lines/labels based on user defined sensitivity factor.
===================================================================================================================
█ ™TradeChartist ZigZag & Auto Fibonacci Retracement Features
=========================================
Plots completed and developing ZigZag based on 𝐙𝐢𝐠𝐙𝐚𝐠/𝐀𝐮𝐭𝐨-𝐅𝐢𝐛𝐬 𝐅𝐚𝐜𝐭𝐨𝐫 (Minimum - 1, Maximum - 10, Default - 5) that adjusts the sensitivity of the ZigZag with 1 being High Sensitivity and 10 being Low Sensitivity.
Option to enable or disable 𝐙𝐢𝐠𝐙𝐚𝐠 𝐂𝐨𝐧𝐧𝐞𝐜𝐭𝐨𝐫 which can be helpful for Harmonic traders.
Option to display 𝐙𝐢𝐠𝐙𝐚𝐠 𝐇𝐢𝐠𝐡𝐬/𝐋𝐨𝐰𝐬 and 𝐑𝐒𝐈 𝐚𝐭 𝐇𝐢𝐠𝐡𝐬/𝐋𝐨𝐰𝐬 in one of two styles.
Two types of Fibonacci to choose from - 𝐀𝐮𝐭𝐨-𝐅𝐢𝐛𝐬 and 𝐅𝐢𝐛𝐬 𝐛𝐚𝐬𝐞𝐝 𝐨𝐧 𝐋𝐨𝐨𝐤𝐛𝐚𝐜𝐤.
𝐀𝐮𝐭𝐨-𝐅𝐢𝐛𝐬 option plots Auto Fibonacci levels based on 𝐙𝐢𝐠𝐙𝐚𝐠/𝐀𝐮𝐭𝐨-𝐅𝐢𝐛𝐬 𝐅𝐚𝐜𝐭𝐨𝐫.
𝐅𝐢𝐛𝐬 𝐛𝐚𝐬𝐞𝐝 𝐨𝐧 𝐋𝐨𝐨𝐤𝐛𝐚𝐜𝐤 plots Fibonacci levels based on the highest high and lowest low of the lookback period (𝐃𝐚𝐲𝐬 or 𝐂𝐚𝐧𝐝𝐥𝐞𝐬).
Fibonacci levels can be reversed by enabling 𝐑𝐞𝐯𝐞𝐫𝐬𝐞 from settings.
Enabling 𝐂𝐮𝐫𝐫𝐞𝐧𝐭 𝐏𝐫𝐢𝐜𝐞 𝐅𝐢𝐛 𝐋𝐚𝐛𝐞𝐥 displays the current Fib level of the developing price bar.
Option to customize Fib levels and colours.
4 Colour themes and option to enable/disable bar colouring.
===================================================================================================================
█ Example charts
1. ZigZag/AutoFibs Factor can make a big difference to ZigZag and AutoFibs plot as shown in the OANDA:XAUUSD Daily chart below.
2. RSI can be quite useful in analysing the Highs and Lows as shown in the BINANCE:BTCUSDT 1hr chart below.
3. Developing or Current Trend means the Low/High is unconfirmed and can move as shown in the OANDA:EURUSD 1hr chart below with bar colouring.
4. Current Price Fib Level label showing PTC means Potential Trend Change. Confirmation at candle close will reverse the Auto-Fibs as shown in BINANCE:ETHUSDT 15m chart below
5. Fibonaci Levels and colours can be customised using 𝐔𝐬𝐞 𝐂𝐮𝐬𝐭𝐨𝐦 𝐅𝐢𝐛 𝐋𝐞𝐯𝐞𝐥𝐬 from the settings as shown in the AMEX:SPY 15m chart below
█ Note:
Rarely, a steep high/low wick doesn't get accounted in the ZigZag High/Low detection as they are filtered using momentum.
If momentum doesn't slow down, the fibs can extend beyond 1 and may continue way beyond 4.618 fib level. These are quite rare depending on how distant the near high/low is based.
ZigZag and Fibonacci are good reference indicators and should always be used as confirmations rather than standalone indicators.
===================================================================================================================
Best Practice: Test with different settings first using Paper Trades before trading with real money
===================================================================================================================

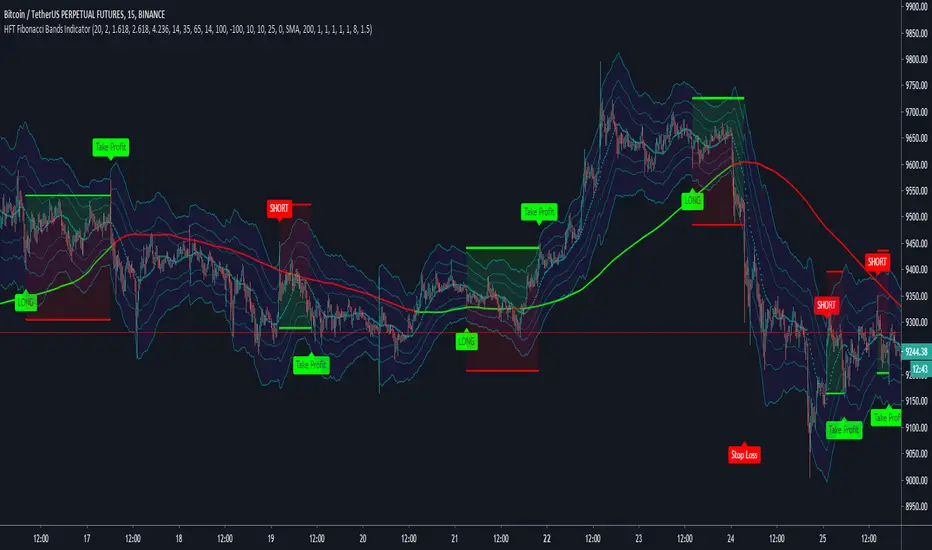
HFT Fibonacci Bands Indicator
Default Settings are meant to be used in XBT/USD chart on 15 min time frame. If you want to use for another asset on another time frame YOU MUST CHANGE THE SETTINGS
This is a Fibonacci bands based trading indicator developed by HFT Research. It is a highly customizable indicator and provided endless opportunities to find profitable trades in the market.
Use Fib BB
This is the main decision maker of the strategy. Tuning the settings of this portion of the strategy will change the outcome the most. We have provided default settings. However, they are only good for 15min chart on Bitcoin. Please adjust accordingly.
Fib BB Length: This setting adjusts the middle line of your Fibonacci Bands. It is the moving average that you take it as base for your Fibonacci bands. Default value is currently 20.
Fib Level to Use for Entry: Here, you adjust which one of the Fibonacci Ratio levels you would like to use for your entry. You can only choose one of the following options.
Fibonacci Ratio 1
This is your Fib ratio level 1 and you can put any number here you would like
Fibonacci Ratio 2
This is your Fib ratio level 2 and you can put any number here you would like
Fibonacci Ratio 3
This is your Fib ratio level 3 and you can put any number here you would like
Please keep in mind that Ratio 1 should be higher than Ratio 2 and Ratio 2 should be higher than Ratio 3.
Use RSI
You can also turn on and off the RSI as well. Alternatively, there is an option to use RSI on a different time frame than you are currently on. For example, if you are looking at the 5min chart to use Bollinger bands but you would like to look at the RSI value on the 15min chart. You can do so by selecting the custom RSI timeframe as well as adjusting the Oversold and Overbought value.
Use CCI
Commodity Channel Index is an indicator developed by Donald Lambert. It is a momentum-based oscillator used to help determine when an investment vehicle is reaching conditions of being overbought or oversold. It also used to asses price trend direction and strength. Default settings are usually the safest and the best fit.
Use VWAP
VWAP stands for volume weighted average price. It is an extremely useful indicator when trading intra-day. It does reset every trading session which is at 00:00 UTC. Instead of looking at x number of candles and providing an average price, it will take into consideration volume that’s traded at a certain price and weigh it accordingly.
Use ADX
ADX stands for average directional index. It is an indicator that measures volatility in the market. Unfortunately, the worst market condition for this strategy is sideways market. ADX becomes a useful tool since it can detect trend. If the volatility is low and there is no real price movement, ADX will pick that up and will not let you get in trades during a sideways market. It will allow you to enter trades only when the market is trending.
Use MA Filters
Lookback: It is an option to look back x number of candles to validate the price crossing. If the market is choppy and the price keeps crossing up and down the moving average you have chosen, it will generate a lot of “noisy” signals. This option allows you to confirm the cross by selecting how many candles the price needs to stay above or below the moving average. Setting it 0 will turn it off.
MA Filter Type: There is a selection of moving averages that is available on TradingView currently. You can choose from 14 different moving average types to detect the trend as accurate as possible.
Filter Length: You can select the length of your moving average. Most commonly used length being 50,100 and 200.
Filter Type: This is our propriety smoothing method in order to make the moving averages lag less and influence the way they are calculated slightly. Type 1 being the normal calculation and type 2 being the secret sauce.
Reverse MA Filter: This option allows you to use the moving average in reverse. For example, the strategy will go long when the price is above the moving average. However, if you use the reserve MA Filter, you will go short when the price is above the moving average. This method works best in sideways market where price usually retraces back to the moving average. So, in an anticipation of price reverting back to the moving average, it is a useful piece of option to use during sideway markets.
If you want to get access to this indicator please DM me or visit our website.
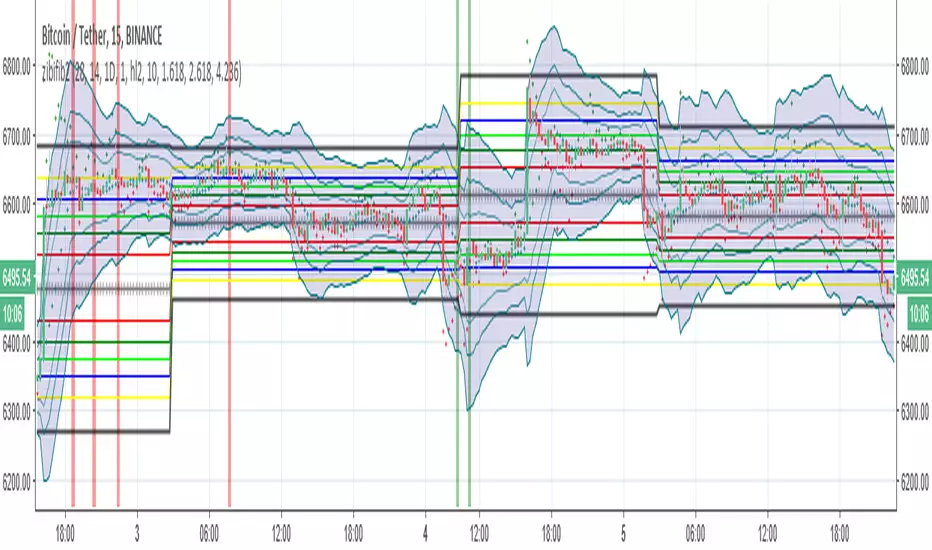
zibi fib2so how this system work:
1. zibi is a volume indicator that similar to obv but it calculate volume per candle differently (my idea)
2.fib
3.bolliger fib
zibi is overshooting indicator since it a volume indicator per candle its signal is before the price candles and its allow us to cross the fib in a smart way
when ever zibi is bellow lowest fib it also in lowest volume possible so buy will be only if it volume start to increase and then we expect the price to move up
since we buy in lowest fib then the cycle will go from down to up as the sell will be exact the opposite.
next we add Bollinger fib to constrain the overshooting of zibi so optimal point only are selected
inside there are alerts ready
for testing check the strategy version of this indicator that combine volume and fib
have fun
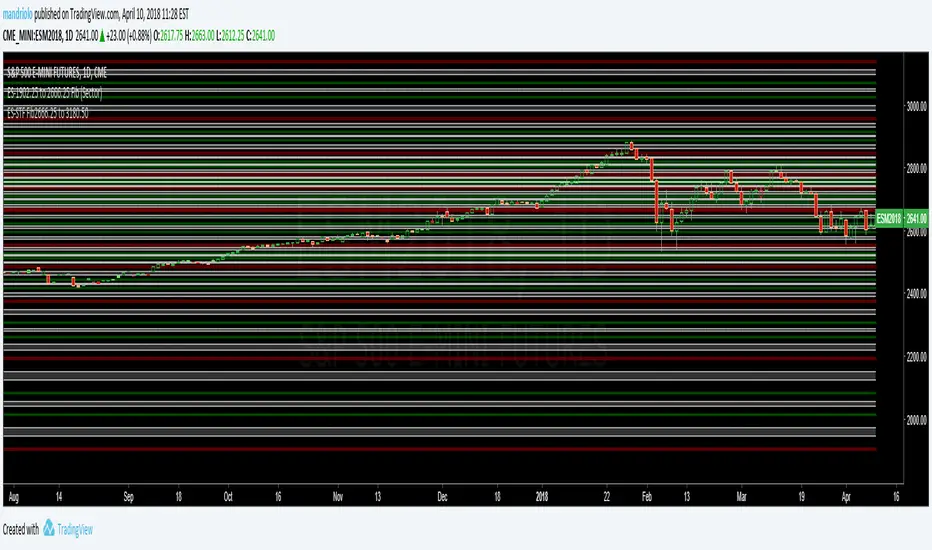
BTCUSD-4720to7640 LongerTimeFrame (LTF)This is a Shorter Time Frame Fib level indicator. It shows where the BTCUSD market is looking to go and where it has been. When the market get above one level ( white bar, for example) look for price action to continue to the next level. If it breaks below the white bar look for it to go the next level below for support. It is great for having targets. It helps in knowing why the market may continue in a direction. For example: When the price action has already moved up, why does it keep going up, because it hasn't reached targeted fib level yet. Same reason price action may move lower. It is looking for its fib level support. You can find them yourself by taking the red level fibs as plug numbers. This makes it fractal in nature. Find the fractal or/of inner fibs by plugging in two consecutive red level fib numbers as the plug numbers. With two plug number it will work for any instrument at any level.

BTCUSD-zero to 20K LongerTimeFrame (LTF) -(BTCUSD)This is a Longer Time Frame Fib level indicator. It shows where the market is looking to go and where it has been. When the market get above one level ( white bar, for example) look for price action to continue to the next level. If it breaks below the white bar look for it to go the next level below for support. I will also publish levels inside these levels for those looking to see them on smaller time frames. You can find them yourself by taking the red level fibs as plug numbers. This makes it fractal in nature. I hope it will impress! It is great for having targets. It helps in knowing why the market may continue in a direction. For example: When the price action has already moved up, why does it keep going up, because it hasn't reached targeted fib level yet. Same reason price action may move lower. It is looking for its fib level support. Find the fractal or/of inner fibs by plugging in two consecutive red level fib numbers as the plug numbers. With two plug number it will work for any instrument at any level. I'm looking for 5400 for support higher on Bitcoin.

ES-STF Fib2666.25 to 3180.50 (STF) - Maroon, Green, White (ES)This is a Shorter Time Frame Fib level indicator. To be used with Longer Time frame Indicator. Though it can be used independently. It shows where the market is looking to go and where it has been. When the market get above one level ( white bar, for example) look for price action to continue to the next level. If it breaks below the white bar look for price action to go the next level below for support. It is fractal in nature. It is fib levels inside longer time frame fib levels. I hope it will impress! It is great for having targets and support levels. It helps in knowing why the market may continue in a direction. For example: When the price action has already moved up, why does it keep going up, because it hasn't reached targeted fib level, yet. Same reason price action may move lower once it breaks a particular level. It is looking for its fib level support. Use with ES-STF 1902.25 to 2666.25 fib levels also, depending on price action is.
MagickMynd EMAs: Credit to TECHIE/Philakone EMAI have taken Techie and Philakone's original EMA script and have taken the idea to a slightly different level. Originally the script added the 8, 13, 21 and 55 day EMAs, which match the Fibonacci numbers sequence. I have added the 144 day and edited the 200 day to be 233 days instead, to more closely match the fib numbers sequence. Think of it as kind of a moving exponential fib chart. Combine it with the regular horizontal fib tools and maybe some fib channels and you have a whole lot of fib data with only 1-2 indicators! (suggest combining with the Magick RSI/Stoch tool for maximum efficiency). I have also added the 4 day EMA. While it does not match the number 3 that you would see in the fib sequence, it does have a special use in relation to price action. Let's see if you can notice what it is ;). Happy trading!

Black Arrow Wave Trend
Summary:
Goal was to add FIB Levels to the "WaveTrend with Crosses ". This tool is trying to identify if FIB levels in the "WaveTrend" oscillator has any relation to price action in candles.
Details:
1) Made FIB levels adjustable in the input sections under settings. Adjust to your needs.
2) Blue ribbon represents bullish waves and red ribbons represents bearish waves.
3) Purple line is at .5 "Fair Value", Two Gold lines represent "Golden Pocket", Red line represents the .786
How to use:
1) Observe either bullish or bearish waves enter FIB levels that are color coded.
2) Observe as momentum slows if following waves mark lower FIB levels.
3) Zero line is at the bottom color = grey.
4) As momentum ribbons momentum slows, this may indicate a reversal in momentum.
Probability levels:
1) Lowest: Purple line is "Fair Value" at 50% pullback. Reversal in momentum chance is weak.
2) Medium: Gold Double lines are the "Golden Pocket". Reversal in momentum chance is medium.
3) Highest: Red Line as a higher Probability for a Reversal in momentum.
Please let me know if there are any changes or items I should add.
This would be best used if combined with a support and resistance indicator.

Fibonacci Projection with Volume & Delta Profile (Zeiierman)█ Overview
Fibonacci Projection with Volume & Delta Profile (Zeiierman) blends classic Fibonacci swing analysis with modern volume-flow reading to create a unified, projection-based market framework. The indicator automatically detects the latest swing high and swing low, builds a complete Fibonacci structure, and then projects future extension targets with clear visual pathways.
What makes this tool unique is the integration of two volume-based systems directly into the Fibonacci structure. A Fib-aligned Volume Profile shows how bullish and bearish volume accumulated inside the swing range, while a separate Delta Profile reveals the imbalance of buy–sell pressure inside each Fibonacci interval. Together, these elements transform the standard Fibonacci tool into a multi-dimensional structural and volume-flow map.
█ How It Works
The indicator first detects the most recent swing high and swing low using the Period setting. That swing defines the Fibonacci range, from which the script draws retracement levels (0.236–0.786) and builds a forward projection path using the chosen Projection Level and a 1.272 extension.
Along this path, it draws projection lines, target boxes, and percentage labels that show how far each projected leg extends relative to the previous one.
Inside the same swing range, the script builds a Fib-based Volume Profile by splitting price into rows and assigning each bar’s volume as bullish (close > open) or bearish (close ≤ open). On top of that, it calculates a Volume Delta Profile between each pair of fib levels, showing whether buyers or sellers dominated that band and how strong that imbalance was.
█ How to Use
This tool helps traders quickly understand market structure and where the price may be heading next. The projection engine shows the most likely future targets, highlights strong or weak legs in the move, and updates automatically whenever a new swing forms. This ensures you always see the most relevant and up-to-date projection path.
The Fib Volume Profile shows where volume supported the move and where it did not. Thick bullish buckets reveal zones where buyers stepped in aggressively, often becoming retestable support. Thick bearish buckets highlight zones of resistance or rejection, particularly useful if projected levels align with prior liquidity.
The Delta Profile adds a second dimension to volume reading by showing where buy–sell pressure was truly imbalanced. A projected Fibonacci target that aligns with a strong bullish delta, for example, may suggest continuation. A projection into a band dominated by bearish delta may warn of reversal or hesitation.
█ Settings
Period – bars used to determine swing high/low
Projection Level – chosen Fib ratio for projection path
-----------------
Disclaimer
The content provided in my scripts, indicators, ideas, algorithms, and systems is for educational and informational purposes only. It does not constitute financial advice, investment recommendations, or a solicitation to buy or sell any financial instruments. I will not accept liability for any loss or damage, including without limitation any loss of profit, which may arise directly or indirectly from the use of or reliance on such information.
All investments involve risk, and the past performance of a security, industry, sector, market, financial product, trading strategy, backtest, or individual's trading does not guarantee future results or returns. Investors are fully responsible for any investment decisions they make. Such decisions should be based solely on an evaluation of their financial circumstances, investment objectives, risk tolerance, and liquidity needs.

HT Sentinel MatrixHT Sentinel Matrix is a HTF liquidity architecture — a sentry that projects the intent of the larger range directly into your execution window.
Instead of guessing where price might be reaching for, the Sentinel Matrix turns the chart into a multi-layered grid of dealing ranges, prior ranges, and refined premium/discount arrays, so you can read context, not candles.
Core Idea
The tool revolves around one premise:
Intraday precision comes from HTF truth.
HT Sentinel Matrix fuses HTF PO3 candles, composite Dealing Ranges (DR), Prior Candles Range (PCR), and a refined Fib matrix into a single, coherent framework you can trade from without clutter.
1. HTF PO3 Candles – The Structural Spine
The HTF PO3 engine builds a stack of HTF candles and projects them to the right of current price:
Automatic timeframe selection relative to your chart (or manual override).
True HTF or Heikin Ashi representation for structural clarity.
Projection of open, high, low, and PO3 data with optional OHLC labels.
Adjustable size, margin, colors, and offset for a minimal yet elegant visual.
This creates a visible structural spine of the dealing range you’re actually trading inside, rather than reacting to noise on your lower timeframe.
2. DR Mode – Composite Dealing Range Engine
Tracks completed HTF candles and the active developing one as well.
Automatically computes DR High, DR Low, DR EQ, DR 25%, and DR 75%.
Optionally extends HTF opens, treating them as structural points of interest.
Projects all levels forward with clean, consistent padding.
The result is a living DR framework that reveals where the true range is being negotiated and which portions are being repriced or accumulated.
3. PCR Mode – Prior Candles Range
Builds a single or stack of prior HTF ranges (PCR1, PCR2, PCR3, etc.).
Plots PH, PL, PEQ with optional 25% and 75% liquidity bands.
Automatically renames and organizes each PCR for clarity.
Shows how current price is interacting with previous HTF footprints.
This gives a true multi-session context showing reclaim, rejection, continuation, or distribution against prior HTF ranges.
4. DR/FIB + PCR – Project a Multi-HTF Liquidity Grid
Up to four HTF ranges plotted simultaneously.
Each HTF range displays PH, PL, PEQ, and optional 25%/75% bands.
Creates a stacked liquidity ladder across multiple HTFs.
This mode highlights multi-timeframe confluence, where DR structure, PCR footprints, and HTF ranges align.
5. FIB Mode – Refined Premium/Discount Matrix
Anchored to the composite HTF range.
Plots unique Fib levels.
Full control over visibility, style, and labeling.
A more precise alternative to generic Fibonacci tools, giving nuanced liquidity brackets for entries, partials, and reversals.
Conceptual Use
HT Sentinel Matrix is not a signal generator — it is an execution environment for traders who think in terms of:
Dealing Ranges, not isolated candles.
Liquidity bands, not random lines.
Multi-timeframe alignment, not single-frame bias.
Use HTF PO3 + DR/FIB to define the larger dealing range, stack PCR to understand HTF footprints, and execute your own model within these structural boundaries.
Disclaimer
This is an analytical tool for educational purposes only. It does not provide signals, financial advice, or guaranteed outcomes. Its edge lies in delivering clarity of context — the rest is your model, your discipline, and your execution.

Fibonacci Retrace + 50 EMA Hariss 369This indicator combines 3 concepts:
Fibonacci retracement zones
50 EMA trend filter
Price interaction with specific Fib zones to generate Buy/Sell signals
Let’s break everything down in simple language.
1. Fibonacci Retracement Logic
The script finds:
Most recent swing high
Most recent swing low
Using these two points, it draws Fibonacci levels:
Fibonacci Levels Used
Level Meaning Calculation
0% Swing Low recentLow
38.2% Light retracement high - (range × 0.382)
50% Mid retracement high - (range × 0.50)
61.8% Deep retracement high - (range × 0.618)
100% Swing High recentHigh
🔍 Why only these levels?
Because trading signals are generated based ONLY on:38.2%, 50%,61.8%
These 3 levels define the golden retracement zones.
2. Trend Filter — 50 EMA
A powerful rule:
Trend Up (bullish)
➡️ Price > 50 EMA
Trend Down (bearish)
➡️ Price < 50 EMA
This prevents signals against the main trend.
3. BUY Conditions (Retracement + EMA)
A BUY signal appears when:
Price is above the 50 EMA (trend is up)
Price retraces into the BUY ZONE:
🔵 BUY ZONE = between 50% and 38.2% Fibonacci i.e.,close >= Fib50 AND close <= Fib38.2
This means:
Market is trending up
Price corrected to a healthy retracement level
Buyers are stepping back in
📘 Why this zone?
This is a moderate retracement (not too shallow, not too deep).
Smart money often enters at 38.2%–50% in a strong trend.
📘 BUY Signal Appears With:
Green “BUY” label
Green arrow below the candle
4. SELL Conditions (Retracement + EMA)
A SELL signal appears when:
Price is below the 50 EMA (trend is down)
Price retraces upward into the SELL ZONE:
🔴 SELL ZONE = between 50% and 61.8% Fibonacci i.e.,close <= Fib50 AND close >= Fib61.8
This means:
Market is trending down
Price made a pullback
Sellers regain control in the golden zone
📘 Why this zone?
50–61.8 retracement is the ideal bearish pullback level.
📘 SELL Signal Appears With:
Red “SELL” label
Red arrow above the candle
5. STOP-LOSS (SL) RULES
For BUY trades,
Place SL below 61.8% level.SL = Fib 61.8%
OR
more safe:SL = swing low (Fib 0%)
For SELL trades
Place SL above 38.2% level.SL = Fib 38.2%
OR conservative:
SL = swing high (Fib 100%)
6. TAKE-PROFIT (TP) RULES
Based on common Fibonacci extensions.
BUY Trade TP Options
TP Level Meaning
TP1 Return to 38.2% Quick scalping target
TP2 Return to swing high Full trend target
TP3 Breakout above swing high Trend continuation
Practical suggestion:
TP1 = 1× risk
TP2 = 2× risk
TP3 = trailing stop
SELL Trade TP Options
TP Level Meaning
TP1 Return to 61.8% Moderate bounce
TP2 Return to swing low Trend target
TP3 Break below swing low Trend continuation
7. Recommended Trading Plan (Simple)
BUY PLAN
Price > 50 EMA (uptrend)
Enter at BUY signal in 38.2–50% zone
SL at 61.8%
TP at swing high or structure break
SELL PLAN
Price < 50 EMA (downtrend)
Enter at SELL signal in 50–61.8% zone
SL above 38.2%
TP at swing low
🟩 Summary (Very Easy to Remember)
🔵 BUY
Trend: above 50 EMA
Zone: between 50% and 38.2%
SL: below 61.8%
TP: swing high
🔴 SELL
Trend: below 50 EMA
Zone: between 50% and 61.8%
SL: above 38.2%
TP: swing low

Auto Fibonacci RetraceNOTE: This script is for educational purposes only.
This Pine Script v6 indicator automates the drawing of Fibonacci retracement levels on a TradingView chart based on detected pivot highs and lows. It's designed to identify the most recent swing points in a price trend and plot horizontal lines at standard Fibonacci ratios (0%, 23.6%, 38.2%, 50%, 61.8%, 78.6%, 100%), along with optional labels for each level. The script is useful for traders who want dynamic, hands-free Fib retracements that update as new pivots form, helping to spot potential support/resistance zones without manual intervention.
Key Features
Automatic Pivot Detection: Uses TradingView's built-in ta.pivothigh and ta.pivotlow functions to find recent swing highs and lows. The sensitivity is adjustable via user inputs for "Left Bars" and "Right Bars" (default: 5 each), which define how many bars are checked on either side to confirm a pivot.
Trend Direction Awareness: Determines if the current swing is an uptrend (recent high after low) or downtrend (recent low after high) and orients the Fib levels accordingly—starting from the low in uptrends or high in downtrends.
Dynamic Drawing:
Plots dashed horizontal lines extending to the right of the chart for each Fib level.
Colors are predefined for visual distinction (e.g., blue for 23.6%, orange for 61.8%).
Lines and labels are cleared and redrawn only when a new pivot is detected or on initial load to prevent chart clutter.
Customizable Labels: Optional labels show the percentage (e.g., "61.8%") and can be positioned on the "Left" (at the swing start) or "Right" (pinned to the current bar, updating dynamically). Labels use semi-transparent backgrounds for readability.
Performance Optimizations: Uses arrays to manage lines and labels efficiently, with reverse-indexed loops for safe deletion. The max_bars_back=500 ensures it handles historical data without excessive computation.
User Inputs:
Left/Right Bars: Tune pivot detection (higher values for major trends, lower for shorter swings).
Show Fib Levels/Labels: Toggle visibility.
Label Position: "Left" or "Right" for placement flexibility.
Usage Instructions
Adding to Chart: Copy-paste into TradingView's Pine Editor, save as a new indicator, and add it to your chart via the "Indicators" menu.
Customization: Adjust inputs in the indicator settings panel. For example, set Left/Right Bars to 10 for daily charts in strong trends.
Best Practices:
Use on trending markets (e.g., stocks, forex, crypto like BTC/USD); avoid choppy sideways action.
Combine with other indicators (e.g., RSI for overbought/oversold confirmation) for better trade signals.
Test on historical data—zoom out to see how it redraws on past swings.
Limitations: Relies on pivot functions, so it may lag slightly (pivots confirm after "Right Bars"). Not a trading strategy—use for analysis only. No alerts built-in, but you can add alertcondition if extending it.
Potential Enhancements: Add extensions (e.g., 161.8%), user-defined levels, or alerts on price touches via simple modifications.
This script provides a clean, efficient way to visualize Fib retracements automatically, saving time compared to manual drawing. If you need further tweaks or integration into a full strategy, let me know!

Kootch EMA MapKootch EMA overlays the 200 EMA from M1, M5, M15, M30, H1, H4, and D1 on any chart so you always see where higher and lower-timeframe trend gravity actually is. It also builds an optional Fib channel between the most extreme MTF 200 EMAs (min/max), giving you clean intrachannel targets and confluence zones.
What it does
• Plots seven 200 EMAs (M1 → D1) simultaneously via MTF pulls
• Color/weight hierarchy: thicker lines = higher timeframe (clear priority)
• Right-edge TF tags (M1, M5, … D1) so you know exactly what you’re looking at
• Optional Fib levels between min/max MTF 200 EMAs (0 → 1 band) for entries, adds, and take-profit scaling
Why traders use it
• Immediate read on trend alignment vs. chop across timeframes
• Mean-reversion & continuation cues when price stretches from/returns to key EMAs
• Level stacking: use M30/H1/H4/D1 as bias, trade entries around lower-TF reactions
Inputs
• EMA Length (default 200)
• Label offset (push tags off the last bar)
• Show Fib channel toggle + color control
How I use it
• Bias from D1/H4/H1; execution from M5/M15.
• Fade or follow at Fib 0.382 / 0.618 inside the EMA envelope; scale out near Fib 1.0 into HTF EMAs.
• Skip trades when EMAs are braided and distances are compressed.
Notes
• Works on any symbol/timeframe; all TF EMAs are requested explicitly.
• This is a map, not a crystal ball: combine with your playbook (structure breaks, FVGs, liquidity, volume).

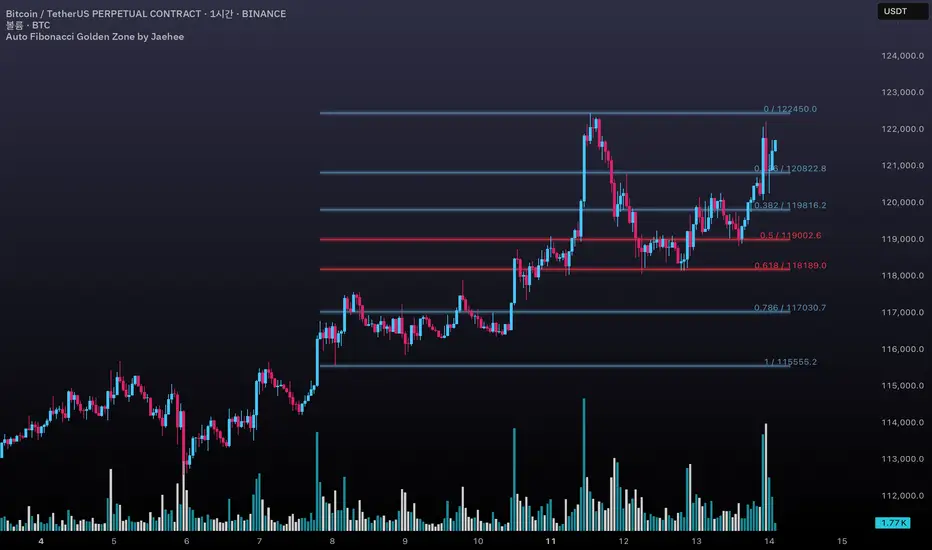
Auto Fibonacci Golden Zone by Jaehee📌 AUTO FIBONACCI GOLDEN ZONE — Auto Swing Detection with Key Level Highlights
WHAT THIS DOES
• Automatically detects the latest swing high and swing low within your chosen lookback range.
• Plots Fibonacci retracement levels: 1.000, 0.786, 0.618, 0.500, 0.382, 0.236, 0.000.
• Highlights 0.618 (“golden pocket”) and 0.500 as high-interest zones.
• Displays ratio + price labels to the right for quick reference without moving the cursor.
HOW IT WORKS
• Scans the last N bars (default 150) to locate the highest high and lowest low.
• Determines swing direction automatically: if the low forms first → up-leg, if the high forms first → down-leg.
• Calculates retracement prices and plots each level with a thin core line plus two glow layers (opacity adjustable).
• Clears and redraws lines and labels whenever a new swing is found — keeping the chart clean.
WHY THIS SETUP
• Saves time compared to manually anchoring Fib tools for each new swing.
• Highlights the golden pocket (0.618) and midpoint (0.500) — zones many traders watch for pullbacks or reactions.
• Positions labels to the right so they never overlap active candles.
HOW IT’S DIFFERENT FROM THE STANDARD FIB TOOL
• Automatic swing detection — no manual point selection.
• Built-in highlight logic for key levels.
• Clean redraw to prevent leftover lines or labels.
• Right-side label offset for readability in volatile price zones.
HOW TO READ IT (CONTEXT ONLY)
• In an up-leg, the 0.382–0.618 zone is often monitored for pullback reactions; 0.500 can act as a midpoint marker.
• In a down-leg, retracements into the 0.382–0.618 zone can be watched for selling pressure.
• Always confirm with structure, volume, and momentum tools — this indicator is not a standalone trade signal.
INPUTS
• Lookback Bars — swing detection range.
• Fib Line Color / Highlight Line Color — control standard vs. key level colors.
• Label Offset Bars — shift labels away from current price.
• Glow 1 & Glow 2 Opacity — adjust background glow visibility.
DESIGN NOTES
• Thin lines for precision, glow layers for visibility without overpowering candles.
• Overlay display — no extra panel needed.
• All elements clear and redraw automatically to avoid clutter.
LIMITATIONS & BEST PRACTICES
• Levels update whenever a new swing forms within the lookback range — historical lines are not fixed.
• Fib retracements are reference zones only, not guarantees of reversal.
• Best used with confluence factors like S/R flips, market structure, and volume analysis.
• No alerts, no performance claims — purely a market context tool.
DEFAULTS & SCOPE
• Works on all OHLCV instruments and timeframes.
• No repainting after swing confirmation.
AUTHOR’S NOTE FOR REVIEW
This is not a repackaged Fib tool. It combines automatic swing detection, golden pocket highlighting, and a clean redraw process to make retracement analysis faster and clearer. It provides context only, with no predictive or performance claims.
XAUMO MEGABAR Detector]XAUMO MegaBar Detector – Breakout Candle Identification Tool
Purpose:
The XAUMO MegaBar Detector is built to highlight rare, high-impact candles where strong price movement and high trading volume occur together. These moments often reflect aggressive market activity and can be used to confirm potential breakouts or reversals.
How It Works (High-Level Overview)
The tool continuously monitors two primary conditions:
Price Expansion – Identifies large-bodied candles compared to recent averages.
Volume Expansion – Confirms that the move is supported by above-average trading activity.
When both conditions are present, the candle is marked:
🟢 Mega Bull – Strong bullish pressure.
🔴 Mega Bear – Strong bearish pressure.
Key Features
Automatic Timeframe Adjustment – Detection sensitivity changes based on chart timeframe, so results stay relevant from 1-minute scalps to multi-day swing setups.
Clear Visual Output – Significant candles are highlighted directly on the chart for easy recognition.
Optional Labels – Toggle on/off text labels (“Mega Bull” / “Mega Bear”) for a cleaner chart view.
Alert Integration – Set TradingView alerts to be notified immediately when a qualifying candle appears.
Universal Compatibility – Works on Forex, Commodities, Indices, Crypto, Stocks, ETFs, and Futures.
Practical Uses for Traders
As a confirmation tool when price approaches support/resistance or Fibonacci levels.
To filter low-quality setups by focusing only on moments where both price and volume confirm the move.
As part of a trend-following or breakout strategy when combined with other analysis methods.
Using the Indicator
Add the indicator to any chart and select your preferred timeframe.
Watch for highlighted candles – they indicate significant combined momentum and liquidity.
Use as a signal filter or confirmation alongside your existing trading system.
Optional: Set alerts to receive push/email/webhook notifications.
===================================
📌 MEGA BAR TRADING CHEAT SHEET
Spot Big Money. Ride the Move.
===================================
🧠 WHAT’S A MEGA BAR?
A Mega Bar is a candle so big it makes the rest look tiny — and it often means institutions are making a move.
Check the 4 Rules:
✅ Body size ≥ 2x average
✅ High relative volume (vs. last 20 bars)
✅ Closes near high (bull) or low (bear)
✅ Comes after sideways chop or price squeeze
📈 WHY IT MATTERS
Mega Bars = intent, not random spikes.
🟢 Mega Bull near support/Fib pullback → Likely accumulation
🔴 Mega Bear near resistance/Fib extension → Likely distribution or trap
🔧 HOW TO TRADE IT
1. WAIT FOR IT
No Mega Bar → No trade.
Mega Bull (big green) → BUY bias.
Mega Bear (big red) → SELL bias.
2. FIND THE SPOT
Fib levels: 61.8% / 78.6% / 138.2%
Major Support/Resistance
3. CONFIRM ON BIGGER TIMEFRAME
Example: 15M Mega Bar → Check 1H trend direction.
4. SET YOUR LEVELS
Stop-Loss:
Long → Below Mega Bull low (+0.2×ATR)
Short → Above Mega Bear high (+0.2×ATR)
Take-Profit:
Fib extensions: 127.2% / 161.8% / 261.8%
Prior highs/lows
5. RISK SMART
Risk 1–2% max per trade
Aim for 2:1+ R:R
🌍 WORKS ON:
Forex • Commodities • Stocks • Crypto • Indices
THE RETAILER’S FORMULA:
🟢 Big Green → Buy
🔴 Big Red → Sell
🎯 Fibs = Payday
One setup. One signal. Discipline = profit.

Fibonacci retracementHi all!
This indicator will show you the most recent Fibonacci retracement in the current trend. So if the trend is bullish the Fibonacci retracement will be drawn from swing low to high and from swing high to low in a bearish trend.
The uniqueness in this script lies in the adaptation to trend. To only plot the Fibonacci retracements according to the current market trend.
The trend is determined through break of structures (BOS) and change of characters (CHoCH). A change of character can be of type change of character plus (with a failed swing) and will then be shown as CHoCH+. This is possible through my library 'MarketStructure' (). It only uses break of structures and change of characters to be able to determine the trend, if you want a more detailed picture of the market structure you can use my script 'Market structure' ().
History and what to look for
Fibonacci retracement levels are used by many traders and are levels that are not Fibonacci sequence numbers themselves but they deriver from them. Some examples are:
23,6% - Divide a number by one three places ahead (e.g. 13/55)
38,2% - Divide a number by the one two places ahead (e.g. 21/55)
50% - Not from the Fibonacci sequence, but it's a number that price has reacted from in the past. Markets tend to retrace half a move before continuing
61,8% - The "golden retracement level". It derives from the "golden ratio" and is a core component of the Fibonacci sequence. The further you go in the Fibonacci sequence the preceding number divided by the current number will get closer and closer to this "golden ratio". This level is considered the most important Fibonacci retracement level by many traders
78,6% - Square root of 61.8%. This is often considered a deep correction (but not a trend reversal) and are often used for late entries
These levels are considered "key" and most significant. You want to look for a retracement of the price (down in a bullish trend and up in a bearish trend) to give you good entries.
Settings
For the trend you can set the pivot/swing lengths (right and left) and use the checkbox if you want these pivots to have labels. This can be done in the 'Market strucure' section.
In the 'Fibonacci retracement' section there is settings for the actual Fibonacci retracement. You can enable the trendline, set the color and the style of it. You can select which levels that should be shown by the indicator. There are 11 levels enabled by default, they are; 0-4.236. All settings in this section tries to be as similar to the "Fib Retracement" tool in Tradingview. You can also select the style of these lines (solid, dashed or dotted) and if you want them to extend to the right or not.
After this you can select if the Fibonacci retracement should be reversed or not, if prices should be displayed, if levels should be displayed and if to show the decimal levels or percentages and lastly the font size of these labels.
All defaults are based on the "Fib Retracement" tool by Tradingview.
Visualization
This indicator aims to be as visually similar to the default ("Fib Retracement") tool here on Tradingview. It will plot the Fibonacci retracement (called Auto Fibonacci/Auto fib) according to the trend from the library 'MarketStrucure'. The big differences from the "Fib Retracement" tool by Tradingview is that it's automatic (that adapts to trend), the market structure is visualized through lines and labels (showing 'BOS' for break of structures and 'CHoCH'/'CHoCH+' for change of characters) and that the labels showing information about the levels are positioned to be highly visible (left if <50% otherwise right if in a bullish trend, vice versa in a bearish trend or if reversed).
Don't hesitate if you have any feedback or nice feature suggestions!
Best of trading luck!

Fibonacci Extension Strt StrategyCore Logic and Steps:
Weekly Trend Identification:
Find the last significant Higher High (HH) and Lower Low (LL) or vice-versa on the Weekly timeframe.
Determine if it's an uptrend (HH followed by LL) or a downtrend (LL followed by HH).
Plot a Fibonacci Extension (or Retracement in reverse order) from the swing point determined to the other significant swing point.
Weekly Retracement Levels:
Display horizontal lines at the 0.236, 0.382, and 0.5 Fibonacci levels from the weekly extension.
Monitor price action on these levels.
Daily Confirmation:
When price hits the Fib levels, examine the Daily chart.
Look for a rejection wick (indicating the pull back is ending) on the identified weekly retracement levels.
Confirm that the price is indeed starting to continue in the direction of the original weekly trend.
Four-Hour Entry:
On the 4H timeframe, plot a new Fib Extension in the opposite direction of the weekly.
If it's an uptrend, the Fib is plotted from last swing low to its swing high. If the weekly trend was bearish the Fib will be plotted from last swing high to the swing low.
Generate an entry when price breaks the high of that candle.
Trade Management:
Entry is on the breakout of the current candle.
Stop Loss: Place the stop loss below the wick of the breakout candle.
Take Profit 1: Close 50% of the position at the 0.5 Fibonacci level. Move the stop loss to breakeven on this position.
Take Profit 2: Close another 25% of the position at the 0.236 Fib level.
Trailing Take Profit: Keep the last 25% open, using a trailing stop loss. (You'll need to define the logic for the trailing stop, e.g., trailing stop using the last high/low)
How to Use in TradingView:
Open a TradingView Chart.
Click on "Pine Editor" at the bottom.
Copy and paste the corrected Pine Script code.
Click "Add to Chart".
The indicator should now be displayed on your chart.

Anchored Three Sigma RangeThis indicator serves to display the standard deviation model based on open price from the selected anchored timeframe. Per statistics the price may stay within the three sigma range most of the time, most significantly within first sigma range 68% of the time.
If price breaks the statistical probabilities and out of the three sigma range entirely it could be considered anomalous and perhaps useful for trade planning, use the fib extensions in various ways to have dynamic profit targets, support or resistance.
How is this different
This indicator differs from others in that I've not really seen any others generating solely horizontal levels, anchored from open price and including fib extensions.
How to use
To use this indicator add to the chart, select anchor timeframe, fib display mode and adjust style to liking. Depending on trade plans use the range breaks, consolidations or fib extensions as required.
One could utilize range consolidation for advanced options neutral trades, range breaks for scalping directionally or high fib extensions for rejection based trades. Based on timeframe anchorage there could be some really amazing combinations for any style of trading, comment any unique findings!
What markets
This indicator can be used on anything that has a price :D
Conditions
Any condition is applicable.

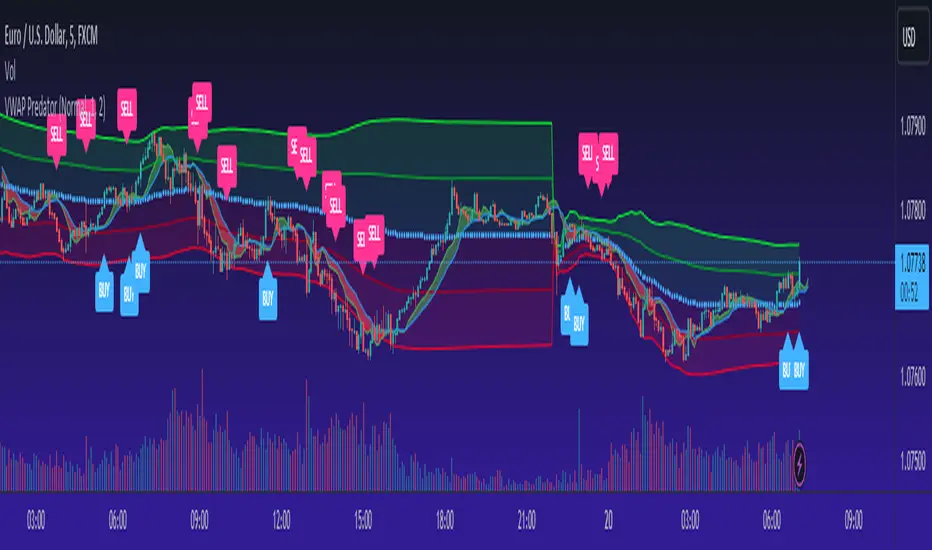
VWAP PredatorUsing VWAP as a start point, the VWAP Predator uses proprietary Fibonacci bands to help determine signal criteria. Most traders use VWAP in a simple way to determine whether an instrument is in a bearish or bullish state, but that doesn't help choosing the correct time to go long or short.
The xBat VWAP Predator uses behavioural analysis with volume, price action with open and close proximities to the Fibonacci bands/zones (Fib Zones). The following describes how the xBrat VWAP Predator is different to any standard use of Volume Weighted Average Price and uses xBrat Proprietary Behavioural logic to determine high probability long and Short signals. All of this heavy lifting and logic is done behind the scenes, keeping traders charts clean.
Long Trading Signals - Candle Coloured in Blue - There are many states with the logic to produce these signals, which are briefly described below:
1. The only standard criteria here - The price action must be above the VWAP Line
2. The Price must open below the boundary of one Fib Zone and close into the next Fib Zone
3. That Same Candle has to be an Accumulation Candle (more volume than the preceding candle and More Buyers) - This is determined with our proprietary logic coding
4. The Same signal candle also has to be higher than average volume. Again, our proprietary xBrat Logic just doesn't look back over a set number of bars, it looks at times of day and day of week, plus more to determine a true valuation of higher, lower or equal to average volume.
5. Only when these states are met, plus two more ema proximity logic, Does the xBrat VWAP predator give a Long Signal.
6. Trade Management is either set targets or indeed a simple ema cross which we provide as a ribbon on the chart to help traders. These ema's are different to entry logic. When the Ribbon turns from green to red, the trader should consider exiting the trade
Short Trading Signals - Candle Coloured in Pink - There are many states with the logic to produce these signals, which are briefly described below:
1. The only standard criteria here - The price action must be below the VWAP Line
2. The Price must open above the boundary of one Fib Zone and close into the next Fib Zone
3. That Same Candle has to be a Distribution Candle (more volume than the preceding candle and More Sellers) - This is determined with our proprietary logic coding
4. The Same signal candle also has to be higher than average volume. Again, our proprietary xBrat Logic just doesn't look back over a set number of bars, it looks at times of day and day of week, plus more to determine a true valuation of higher, lower or equal to average volume.
5. Only when these states are met, plus two more ema proximity logic, Does the xBrat VWAP predator give a Short Signal.
6. Trade Management is either set targets or indeed a simple ema cross which we provide as a ribbon on the chart to help traders. These ema's are different to entry logic. When the Ribbon turns from red to green, the trader should consider exiting the trade.
VWAP Predator is a day trading and scalping signals trading indicator.
Auto Fibonacci Retracement - Real-Time (Expo)█ Fibonacci retracement is a popular technical analysis method to draw support and resistance levels. The Fibonacci levels are calculated between 2 swing points (high/low) and divided by the key Fibonacci coefficients equal to 23.6%, 38.2%, 50%, 61.8%, and 100%. The percentage represents how much of a prior move the price has retraced.
█ Our Auto Fibonacci Retracement indicator analyzes the market in real-time and draws Fibonacci levels automatically for you on the chart. Real-time fib levels use the current swing points, which gives you a huge advantage when using them in your trading. You can always be sure that the levels are calculated from the correct swing high and low, regardless of the current trend. The algorithm has a trend filter and shifts the swing points if there is a trend change.
The user can set the preferred swing move to scalping, trend trading, or swing trading. This way, you can use our automatic fib indicator to do any trading. The auto fib works on any market and timeframe and displays the most important levels in real-time for you.
█ This Auto Fib Retracement indicator for TradingView is powerful since it does the job for you in real-time. Apply it to the chart, set the swing move to fit your trading style, and leave it on the chart. The indicator does the rest for you. The auto Fibonacci indicator calculates and plots the levels for you in any market and timeframe. In addition, it even changes the swing points based on the current trend direction, allowing traders to get the correct Fibonacci levels in every trend.
█ How does the Auto Fib Draw the levels?
The algorithm analyzes the recent price action and examines the current trend; based on the trend direction, two significant swings (high and low) are identified, and Fibonacci levels will then be plotted automatically on the chart. If the algorithm has identified an uptrend, it will calculate the Fibonacci levels from the swing low and up to the swing high. Similarly, if the algorithm has identified a downtrend, it will calculate the Fibonacci levels from the swing high and down to the swing low.
█ HOW TO USE
The levels allow for a quick and easy understanding of the current Fibonacci levels and help traders anticipate and react when the price levels are tested. In addition, the levels are often used for entries to determine stop-loss levels and to set profit targets. It's also common for traders to use Fibonacci levels to identify resistance and support levels.
Traders can set alerts when the levels are tested.
-----------------
Disclaimer
Copyright by Zeiierman.
The information contained in my Scripts/Indicators/Ideas/Algos/Systems does not constitute financial advice or a solicitation to buy or sell any securities of any type. I will not accept liability for any loss or damage, including without limitation any loss of profit, which may arise directly or indirectly from the use of or reliance on such information.
All investments involve risk, and the past performance of a security, industry, sector, market, financial product, trading strategy, backtest, or individual's trading does not guarantee future results or returns. Investors are fully responsible for any investment decisions they make. Such decisions should be based solely on an evaluation of their financial circumstances, investment objectives, risk tolerance, and liquidity needs.
My Scripts/Indicators/Ideas/Algos/Systems are only for educational purposes!

TradeChartist Actuator™TradeChartist Actuator is an extremely functional indicator that converts the price action volatility and momentum into a meaningful trading system (based on user defined Standard Deviation Factor), that consists of expanding/contracting Volatility Range Bands, Dynamic Trend Support/Resistance Bands and 2 types of Breakout Signals in a visually stunning design. The script also neatly packs in ZigZag & manual/automatic Fibonacci Retracement tools, option to filter the signals using an external filter and other useful extras like ™TradeChartist Dollar Candles and much more.
===================================================================================================================
™TradeChartist Actuator User Manual
█ Actuator Range Bands
Actuator Range Bands consists of a Mean line, an Upper Band and a Lower Band which are based on user defined Standard Deviation Factor (Default - 1.618, Min - 0.5, Max - 2). The 1.618 factor works extremely well as the unnecessary volatility data of the bands are eliminated by Actuator's logic. In my personal tests, 1.618 works consistently better than any other value in visually showcasing the true volatility range. By eliminating the unnecessary volatility data from the original non-stabilized bands, Actuator helps detect price momentum by detecting two types of breakouts.
Bands Breakout - Filtered
When the price breaks out of the upper or lower band after a trend, there is a strong possibility of a reversal especially when the volatility expansion/contraction takes place. This is detected using a built in filter with the Filtered Bands Breakout and the user can choose to use the closing price or High/Low price as the trigger for breakouts. This trade setup is very useful especially at zones where the Actuator Range Bands contract or squeeze after an expansion as shown in the OANDA:XAUUSD 1hr chart below.
Also, after a consistent expansion of the bands with price trending in the upper channel or the lower channel, users can spot good profit taking or Short trade opportunities with confirmation of overbought price and if possible a strong bear divergence as show in the BINANCE:LUNAUSDTPERP 1hr chart below.
It can be seen from the chart above that even though Actuator is designed to detect Extreme Bands Breakout using High/Low price, it is done with a little bit of filtering by the script logic and hence didn't generate a Bear signal at the lower band support zone.
Mean Breakout - Filtered
In most Mean Reversion models, mostly oscillators, the mean plays an important role in helping traders predict the price dynamic, but it also presents a challenge whether that mean will act as support or resistance so the trader can take a position that will have a high probability of success. Filtered Mean Breakout helps exactly to identify the price dynamic at the mean zone and helps reduce the dilemma. Actuator uses Volatility Trend and Momentum of the price action at mean to determine Bull/Bear breakouts. Following NASDAQ:AAPL 1hr chart shows an example of 2 instances of Filtered Mean Breakout detection, one bull and one bear and further area where no Breakout was detected in spite of price crossing the mean.
This Breakout type is really helpful in spotting early moves and also reduces the high volatility risk of Extreme Bands Breakout in some cases.
===================================================================================================================
█ External Filter
Actuator breakout signals can be further filtered using the feature of connecting an external signal as a trade filter.
External filter like RSI , MACD etc. can be used to filter breakouts by connecting to ™TradeChartist Actuator under ╔═══ 𝗣𝗹𝘂𝗴 𝗙𝗶𝗹𝘁𝗲𝗿 𝗵𝗲𝗿𝗲 ═══ 🔌 dropdown by enabling 𝐔𝐬𝐞 𝐄𝐱𝐭𝐞𝐫𝐧𝐚𝐥 𝐅𝐢𝐥𝐭𝐞𝐫.
To get the external filter to work, 𝐒𝐢𝐠𝐧𝐚𝐥 𝐓𝐲𝐩𝐞 must be set right. For plots that are non oscillatory like Moving Averages, Super Trend etc., choose type as Non Oscillatory and for Oscillators like RSI , CCI , MACD etc., choose type as Oscillatory .
For Oscillators, levels must be specified for 𝐎𝐬𝐜𝐢𝐥𝐥𝐚𝐭𝐨𝐫 𝐁𝐮𝐥𝐥 𝐅𝐢𝐥𝐭𝐞𝐫 𝐯𝐚𝐥𝐮𝐞 and 𝐎𝐬𝐜𝐢𝐥𝐥𝐚𝐭𝐨𝐫 𝐁𝐞𝐚𝐫 𝐅𝐢𝐥𝐭𝐞𝐫 𝐯𝐚𝐥𝐮𝐞, especially if the Oscillator doesnt have 0 as midline, like RSI . Even for 0 mid oscillators like CCI , filter levels like 100/-100 work effectively to filter noise.
Use 𝐁𝐮𝐥𝐥/𝐁𝐞𝐚𝐫 𝐁𝐚𝐜𝐤𝐠𝐫𝐨𝐮𝐧𝐝 𝐅𝐢𝐥𝐥 under Actuator Visuals section to paint the trade zones background. It helps visually see the effect of filters on the breakout entries and also the trade performance.
The following chart shows the Filter settings with ™TradeChartist Momentum Drift Oscillator connected to Actuator as Oscillatory signal with filter values 0.
The two example charts of 1hr BINANCE:BTCUSDT below shows the difference in Actuator signals based on Oscillatory signal from ™TradeChartist Momentum Drift Oscillator and the difference can be seen from the highlighted Bull/Bear Background Fill.
Without External Filter
With External Filter
===================================================================================================================
█ Dynamic Trend Support/Resistance Bands
In addition to Volatility Range Bands, Actuator also plots Dynamic Trend Support and Resistance bands that are more sensitive to price action and helps the user determine growing support/resistance which is indicated by coloured dots. These dots normally appear when the Support or Resistance stays at the same level for a few bars and change between Bull and Bear colours based on how the price interacts with them as shown below.
===================================================================================================================
█ Useful Trade Tools
™TradeChartist Dollar Candles
Dollar Candles help detect the volatility exhaustion prices and plots $ signs to help the trader take profits or move stop loss levels to secure gains. The $ signs do not appear for every trade zone, but whenever price hits a critical level, it shows up above price bar (for Bull trend) or below price bar (for Bear trend) in real time. Users can also set alerts for Dollar Candles with Once Per Bar setting. The Daily NASDAQ:TSLA chart below shows the Dollar Candles on both Bull and Bear trends.
It is important to note that taking pockets of profits on a leveraged trade position or moving up stop loss to maximize trend gains at $ candles will help increase Average Profitability Per Trade (APPT) .
Bull/Bear Background Fill
Bull/Bear Background Fill paints the trade zones in Bull and Bear colours. This helps visualize the difference in trade zones when testing various settings and also helps analyze past performance of Actuator Signals with or without the use of External Filter.
Entry Stop Loss Reference
Reference zone for stop loss has always been a tricky one for traders. Using a fixed percentage stop at entry may not be best during high volatility moves. Over the extensive period of Actuator testing, a simple solution to this problem was found. The previous trend's Range Bands Mean Line served as a perfect reference point for Entry Stop. Also while analysing this Mean line, it was found to be a perfect horizontal support/resistance line and also helped detect unproductive trades. The example 15m chart of NASDAQ:AMD shows how the Entry Stop Loss Reference performed.
Stop Line Touch Points plot orange touch points on the Stop Line whenever the price hits it during the trade.
Actuator Colour Bars
Actuator Colour Bars paints the Momentum Strength on the price bars. This helps visually see the price bars venturing into the Overbought or the Oversold zones. Also, this feature also helps spot divergences as higher highs or lower lows with less intense Bull/Bear colour than the previous high/low shows diminishing momentum as shown in the 1h chart of OANDA:GBPJPY below.
===================================================================================================================
█ ZigZag & Fibonacci Toolkit
Actuator plots developing and completed ZigZags based on Bull and Bear trend depending on the Breakout Type and Breakout Price from the settings.
Option to enable or disable 𝐙𝐢𝐠𝐙𝐚𝐠 𝐂𝐨𝐧𝐧𝐞𝐜𝐭𝐨𝐫 which can be helpful for Harmonic traders.
Option to display 𝐙𝐢𝐠𝐙𝐚𝐠 𝐇𝐢𝐠𝐡𝐬/𝐋𝐨𝐰𝐬 and 𝐑𝐒𝐈 𝐚𝐭 𝐇𝐢𝐠𝐡𝐬/𝐋𝐨𝐰𝐬 in one of two styles.
Two types of Fibonacci to choose from - 𝐀𝐮𝐭𝐨-𝐅𝐢𝐛𝐬 and 𝐅𝐢𝐛𝐬 𝐛𝐚𝐬𝐞𝐝 𝐨𝐧 𝐋𝐨𝐨𝐤𝐛𝐚𝐜𝐤.
𝐀𝐮𝐭𝐨-𝐅𝐢𝐛𝐬 option plots Auto Fibonacci levels based on Bull/Bear trend depending on user specified Breakout Type and Breakout Price.
𝐅𝐢𝐛𝐬 𝐛𝐚𝐬𝐞𝐝 𝐨𝐧 𝐋𝐨𝐨𝐤𝐛𝐚𝐜𝐤 plots Fibonacci levels based on the highest high and lowest low of the lookback period (𝐃𝐚𝐲𝐬 or 𝐂𝐚𝐧𝐝𝐥𝐞𝐬).
Fibonacci levels can be reversed by enabling 𝐑𝐞𝐯𝐞𝐫𝐬𝐞 from settings.
Enabling 𝐂𝐮𝐫𝐫𝐞𝐧𝐭 𝐏𝐫𝐢𝐜𝐞 𝐅𝐢𝐛 𝐋𝐚𝐛𝐞𝐥 displays the current Fib level of the developing price bar.
Option to customize Fib levels and colours.
4hr chart of BINANCE:BTCUSDT showing Auto Fibonacci levels, Zig-Zag with Trend High/Lows, Zig-Zag connectors with Fib Ratios and RSI at Trend High/Low prices.
Note:
If momentum doesn't slow down, the fibs can extend beyond 1 and may continue way beyond 4.618 fib level. These are quite rare depending on how distant the near high/low is based.
ZigZag and Fibonacci are good reference indicators and should always be used as confirmations rather than standalone indicators.
===================================================================================================================
█ Actuator Colour Scheme
Actuator employs 3 built in colour schemes namely Chilli , Flame and Sublime Grayscale and a versatile colour scheme Custom which enables the user to customise the colour combinations of the components of the Actuator script.
===================================================================================================================
█ Alerts
Alerts can be created for the following.
Actuator Bull Breakout Signal - Once Per Bar Close
Actuator Bear Breakout Signal - Once Per Bar Close
Actuator Long Dollar - Take Profit - Once Per Bar
Actuator Short Dollar - Take Profit - Once Per Bar
Actuator Stop Line Hit - Once Per Bar
Note: The script doesn't repaint, so the alerts can be used with confidence. To check this, users can do bar replays to check if the plots and markers stay in the same place.
===================================================================================================================
Best Practice: Test with different settings first using Paper Trades before trading with real money
===================================================================================================================
