Buscar en scripts para "btc期权交割时间"
BTC Price Spread - Coinbase & Futs - Premiums & DiscountsThis indicator takes the price of Bitcoin on Coinbase and the futures price on Mex, and compares it the average price of Bitcoin across other major exchanges.
This essentials give us a spread at which Bitcoin is going for.
In turn, this could be a possible tool to help determine market sentiment.
This indicator was created for experimental purposes.
Use at your own digression.

BTC Futures Settlement DatesShows the CBOE and CME settlement dates as horizontal lines, with the option to show a 7 day warning in the background. This should hopefully give ample warning.
I intend to update the script as new dates become available but please PM if I've forgotten.

BTC: CME Futures vs. Exchange SpreadsAs you can see, this script plots the current (10-min. delayed) CME Futures price versus Bitfinex, Bitstamp, and Coinbase prices.
It's displayed here on a 30 minute view because at the time of writing the futures have been alive for approximately one day. The script will likely be more useful on longer time frames as a macro-level indicator.
It's pretty simple to adapt this to additional exchanges


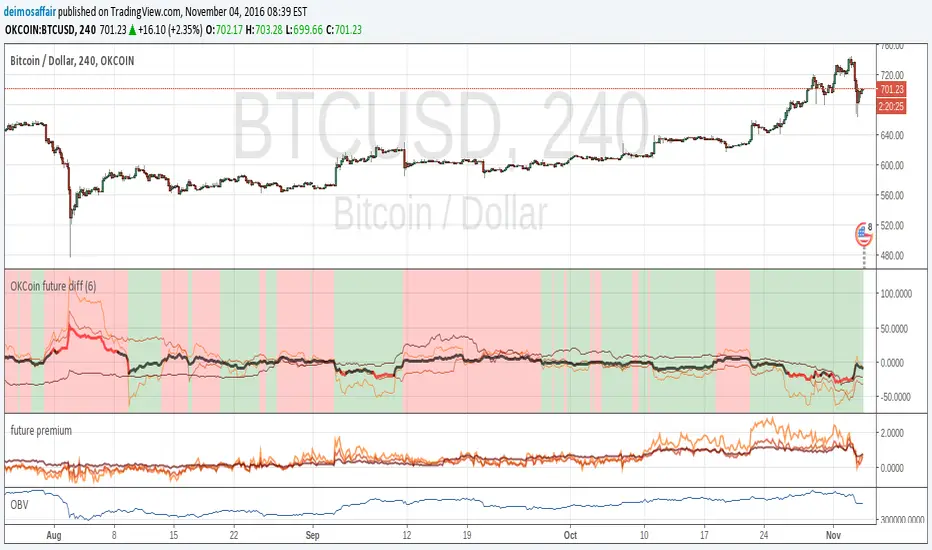
OKCoin future diffThis indicator checks the accuracy of okcoin futures against the current index. Example, check how the 1W future from 7 days ago matches the current spot value. The matches are on the 1W, 2W, 3M futures
The indicator bundles them together, makes a weighted average and shows it all.
the thin lines are the futures deltas for each of the futures(check the code to see the color of each).
the thick line is the compound indicator, the line is red when the value is too far off the spot price, black when it's <5%
background is green on "bullish", red for "bearish", take it as you want with many grains of salt :)
there is an input value (default = 1) to adjust time scales. the value is a multiplier for the number of periods in a day.
Example:
1D chart, input = 1
4h chart, input = 4h * 6 = 24h
using the incorrect adjustment for the wrong time scale, makes the indicator (even more) meaningless ;)
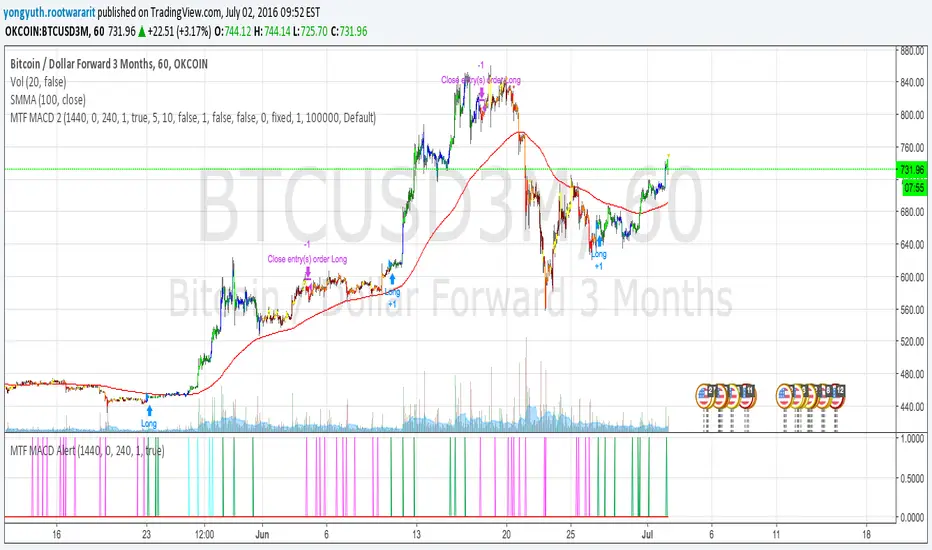
MTF MACD 2 By YuthavithiIf you want a good strategy without repaint. This one might be for you. Excellent profitable for BTCUSD3M for OKCoin.
It uses multiple time frame MACD for trading decision. To avoid repaint, set the delay period = 1 for both long term and midterm.
The idea is that, if long term, mid term and current time frame all agree on traidng direction, the trade will take place.
I also uses it in my automated trading bot with good result.
www.tradingview.com
(CRISIS) aggregateBTCvol v0.2.4Aggregate multiple exchange volumes into single indicator
This update adds:
*Moving Average
*Add/change/disable to up 6 securities without touching code.
*Monochrome mode for dark themes.

BTC Volume Index 1.1 beta [Dia]Indicator calculates total volume across multiple bitcoin exchanges. The influence of each exchange can be adjusted seperately.
0 fee exchanges default to 50%
0 fee futures default to 10%
Define custom lookback periods for price breakout detection.
Look for low-volume price reversals in those candles immediately following high volume peaks. The lower the volume and the greater the open/close price difference of that 2nd candle is compared to the previous one, the higher the likelihood of a local top/bottom being in.
Note:
Bar highlighting is still experimental, future versions will include better filtering options.
Use for confirmation only, not as standalone trading system.


Buy/Sell Signal v3
BTC/Gold Scalping Strategy - 5M 1H Timeframe
Description
Advanced trading indicator specifically designed for scalping BTC and Gold on 5-minute and 1-hour timeframes. It uses EMA crossovers with automatic risk management (Stop Loss and Take Profit) based on ATR.
Main Features
- Automatic entry signals: Identifies optimal buy and sell points based on EMA crossovers
- Integrated risk management: Automatically calculates SL and TP according to your preferred risk/reward ratio
- Smart invalidation: Cancels previous positions when a new opposite signal appears
- Clear visualization: Horizontal lines showing entry, stop loss, and take profit in real time
- Informative panel: Table with all information about the active position
- Complete alert system: Notifications for entries, exits, and invalidations
How It Works
The indicator detects trend changes through the crossover of two EMAs:
- Fast EMA (default 5 periods): Quickly responds to price changes
- Slow EMA (default 13 periods): Filters market noise
- BUY Signal: When the fast EMA crosses above the slow EMA
- SELL Signal: When the fast EMA crosses below the slow EMA
Risk Management
- Stop Loss: Placed below/above the low/high of the entry candle, adjusted by ATR
- Take Profit: Automatically calculated according to your configured R:R ratio (default 3:1)
- Invalidation: If an opposite signal appears before TP or SL is hit, the position closes automatically
Visual Elements
- 🟢 BUY Label: Buy signal (lime green)
- 🔴 SELL Label: Sell signal (red)
- ⚠️ INV Icon: Invalidated entry (yellow)
- 🎯 TP Icon: Take Profit reached (green)
- ❌ SL Icon: Stop Loss triggered (red)
- ⚪ White dotted line: Entry price
- 🔴 Red line: Stop Loss level
- 🟢 Green line: Take Profit level
Recommended Settings
For BTC:
- Fast EMA: 5
- Slow EMA: 13
- ATR: 14
- SL Multiplier: 0.5
- Risk:Reward: 3.0
- Candle confirmation: Enabled
For Gold (XAU/USD):
- Fast EMA: 5
- Slow EMA: 13
- ATR: 14
- SL Multiplier: 0.4–0.6 (adjust depending on volatility)
- Risk:Reward: 2.5–3.5
- Candle confirmation: Enabled
Available Alerts
1. 🟢 BUY Signal: Triggered when a new buy opportunity appears
2. 🔴 SELL Signal: Triggered when a new sell opportunity appears
3. 🎯 Take Profit: Notifies when the profit target is reached
4. ❌ Stop Loss: Alerts when stop loss is triggered
5. ⚠️ Invalidated Entry: Alerts when a position is canceled by an opposite signal
Important Notes
- ⏰ Recommended timeframe: 5 minutes and 1 hour
- 📊 Optimized assets: Bitcoin (BTC/USD) and Gold (XAU/USD), including Futures
- ⚠️ No repaint*: Signals do not change once confirmed
- 🎓 Educational use: Always perform your own analysis before trading
- 💰 Capital management: Never risk more than 1–2% of your account per trade
Customizable Parameters
Indicators:
- Fast EMA period (1–50)
- Slow EMA period (1–50)
- ATR period (1–50)
- Stop Loss multiplier (0.1–5.0)
- Risk:Reward ratio (1.0–10.0)
- Candle confirmation (On/Off)
EMA Visualization:
- Show/Hide Fast EMA
- Customizable Fast EMA color
- Show/Hide Slow EMA
- Customizable Slow EMA color
How to Use
1. Add the indicator to your 5-minute chart
2. Adjust parameters according to your trading style
3. Set up alerts to receive notifications
4. Wait for clear BUY or SELL signals
5. Manage the trade following the SL and TP levels displayed
Disclaimer: This indicator is a technical analysis tool. It does not constitute financial advice. Trading carries significant risks and you may lose your capital. Always trade responsibly with proper risk management.

Crypto Correlation Oscillator# Crypto Correlation Oscillator
**Companion indicator for Tri-Align Crypto Trend**
## Overview
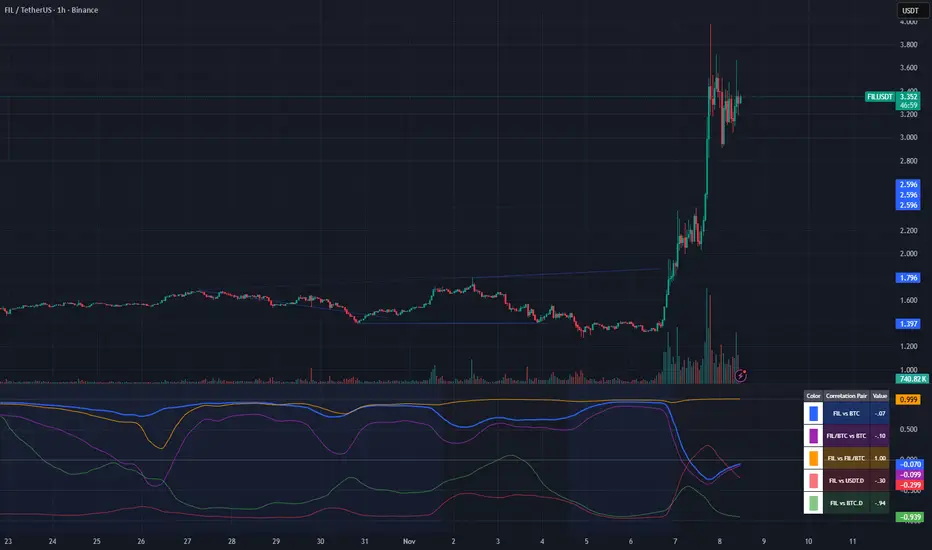
The Crypto Correlation Oscillator helps you identify **alpha opportunities** and **market regime changes** by showing how closely your coin follows Bitcoin and other assets over time. It displays rolling correlations as an oscillator in a separate pane below your price chart.
## What It Does
This indicator calculates **Pearson correlations** between different trading pairs on a rolling window (default: 100 bars). Correlations range from **-1.0** (perfect inverse relationship) to **+1.0** (perfect positive relationship), with **0** meaning no correlation.
### The 5 Correlation Lines
1. **Blue (thick line) - Coin vs BTC**: The most important metric
- **High correlation (>0.7)**: Your coin is just following BTC - no independent movement
- **Low correlation (<0.3)**: Your coin has **alpha** - it's moving independently from BTC
- **Negative correlation**: Your coin moves opposite to BTC (rare but powerful)
2. **Purple - Coin/BTC vs BTC**: Inverse relationship check
- **Negative values**: When BTC rises, your coin weakens relative to BTC
- **Positive values**: When BTC rises, your coin strengthens against BTC
3. **Orange - Coin vs Coin/BTC**: Structural consistency check
- Shows how well the Coin/USDT and Coin/BTC pairs maintain their mathematical relationship
- Unusual values can indicate liquidity issues or market inefficiencies
4. **Light Red - Coin vs USDT.D** (optional): Stablecoin dominance correlation
- Shows how your coin correlates with USDT dominance
- Useful for understanding flight-to-safety dynamics
5. **Light Green - Coin vs BTC.D** (optional): Bitcoin dominance correlation
- Shows how your coin correlates with BTC dominance
- Helps identify altcoin season vs BTC dominance cycles
## How to Read It
### Finding Alpha Opportunities
- **Low blue line (<0.3)**: Your coin is decoupled from BTC → potential alpha
- **Blue line dropping**: Coin is gaining independence from BTC
- **Blue line spiking to >0.9**: Coin is a "BTC clone" with no independent movement
### Regime Change Detection
- **Blue line crossing 0.5**: Major shift in correlation behavior
- **Purple line turning negative**: Coin starting to weaken when BTC rises (warning sign)
- **Sharp correlation changes**: Market structure is shifting - adjust strategy
### Visual Zones
- **Blue background**: High correlation zone (>0.7) - coin just following BTC
- **Red background**: Inverse correlation zone (<-0.5) - coin moving opposite to BTC
### Reference Lines
- **+1.0 / -1.0**: Perfect correlation boundaries (dotted gray)
- **+0.5 / -0.5**: Moderate correlation thresholds (dotted gray)
- **0.0**: Zero correlation line (solid gray)
## Dynamic Legend
The legend table (top-right) automatically shows the actual symbol names based on your chart:
- **Example on SOLUSDT**: Shows "SOL vs BTC", "SOL/BTC vs BTC", "SOL vs SOL/BTC", etc.
- **Color boxes**: Match the plot colors for easy identification
- **Live values**: Current correlation numbers update in real-time
- **Tooltips**: Hover over labels for interpretation guidance
## Configuration
### Key Inputs
- **Correlation Lookback** (default: 100): Number of bars for rolling correlation window
- Shorter = more reactive, noisier
- Longer = smoother, slower to detect changes
- **Correlation Smoothing** (default: 5): EMA smoothing period for raw correlations
- Reduces noise while preserving trends
- **Symbol Detection**: Auto-detects symbols from your chart, or use manual overrides
- **Dominance Pairs**: Toggle USDT.D and BTC.D correlations on/off
## Usage Tips
1. **Combine with main Tri-Align indicator**: Use correlation for context, Tri-Align for entry/exit signals
2. **Watch for divergences**: Correlation changing while price moves in sync can signal upcoming shift
3. **Adjust lookback period**: Use shorter (50-70) for day trading, longer (150-200) for position trading
4. **Focus on the blue line**: It's your primary alpha indicator
## Technical Details
- **Calculation**: Pearson correlation coefficient with EMA smoothing
- **Data source**: Close prices from `request.security()` (multi-timeframe capable)
- **Update frequency**: Every bar on your selected timeframe
- **Overlay**: False (displays in separate pane)
## Quick Interpretation Guide
| Blue Line Value | Interpretation | Action |
|----------------|----------------|--------|
| > 0.9 | Coin is a BTC clone | Avoid - no alpha opportunity |
| 0.7 - 0.9 | High correlation | Standard altcoin behavior |
| 0.3 - 0.7 | Moderate correlation | Some independence emerging |
| < 0.3 | Low correlation | **Strong alpha opportunity** |
| < 0 | Inverse correlation | Rare - potential hedge asset |
| Purple Line | Interpretation |
|-------------|----------------|
| Strongly negative | Coin weakens when BTC rises - risky |
| Near zero | Coin/BTC pair moves independently of BTC |
| Positive | Coin strengthens with BTC - ideal |
## Version History
### v1.0 (Initial Release)
- Pearson correlation calculation with configurable lookback
- 5 correlation pairs: Coin vs BTC, Coin/BTC vs BTC, Coin vs Coin/BTC, USDT.D, BTC.D
- EMA smoothing to reduce noise
- Visual zones for high/inverse correlation
- Dynamic legend with symbol name extraction
- Auto-symbol detection matching main Tri-Align indicator
Other alts compensated capitalization [Peregringlk]DISCLAIMER: I'm not a native English speaker, so let me know please about mistakes in my wording.
Introduction
==========
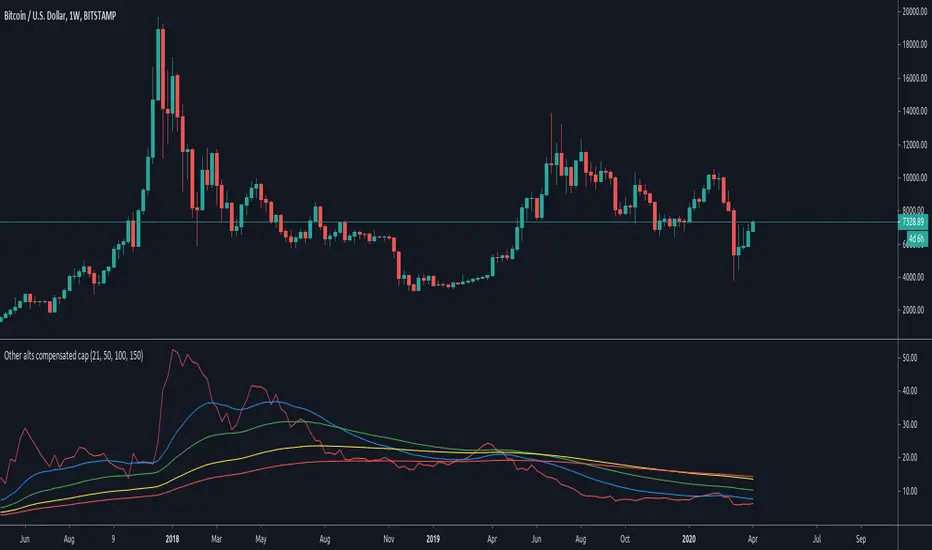
This indicator (the middle one in the image) shows how the "others altcoins" (all altcoins except coins with high capitalization) are adding own value to its capitalization by removing BTC price changes. By "own value" I mean USD value gaining by actual buys in BTC markets beyong arbitrage effects of BTC price changes.
The main idea is that, if bitcoin has increased is value by 20%, and the other altcoins has increased its capitalization by 30%, the chart will only plot an increased of 10%. In other words, it will show its increased capitalization measured in BTC (the combined altcoin/BTC market is uptrending). Its purpose is to try to identify altseasons. A bit more concisely, the graph will only grow when both USD and BTC capitalization are growing. If any of them are going down, the graph will go down as well.
Rationale
========
- Altseasons are characterized by an incresed in BTC value of almost every altcoin during some period of time, although not all at once, but distributed over the altseason. For example, in the crazy altseason of Dec17/Jan18, almost every (low capitalized) altcoin increased its BTC value by a minimum of +300%, some at the beginning of the season, some at the end.
- When this happens, BTC loss capitalization dominance, but this also can happen if BTC is downtrending while altcoins are being bought in BTC markets but its USD value doesn't change too much. This happens when altcoins are uptrending in BTC price, but there are actually no gain of USD value because the BTC gain in value is not enough to compensate the BTC fall in price. Since BTC is losing USD price, but altcoins are not, dominance falls. So, looking at BTC dominance is not enough to spot possible beginnings of altseasons, because of arbitrage of other effects.
- The "big altcoins" are removed from the counting because one single big capitalized altcoin that grows, let's say, a 20%, will have an observable effect on the total altcoin capitalization, even if the rest of the altcoins are stagnated in price. For example, at today's date (8th April 2020), Ethereum by itself has the 23.89% of the total altcoins capitalization. A +10% in Ethereum price will increase the total altcoin capitalization by a +2.38%. I wanted to remove that effect to focus on generalized price changes of all altcoins. Remember that there are only 9 big altcoins 9 coins representing the 71% of the alts capitalization, while there are exists more than 5000 altcoins in total.
- Another key factor is that I want to focus on what happens in alt/BTC markets, because almost every altcoin can be traded against BTC, and most of them can only be traded against BTC. However, big altcoins can usually be traded against USD or other alt coins or fiat currencies as well. Removing the big alts from the equation helps (just a bit) to simplify the interpretation of the chart because arbitrage effects of those "impactfull" alts are limited (although not removed, because arbitrage also happens cross-markets).
- There are situations where BTC price is going up, alts USD capitalization is going up as well, but alts BTC capitalization is going down because altcoins are being sold in BTC markets, it just happens that the speed of the selling is not high enough as to compensated the increased in BTC price. That makes the USD capitalization grows, while alts are really being dumped in BTC markets. I wanted to reflect that effect as well by making sure that the graph is growing only when both USD and BTC capitalization of alts are growing.
Interpretation
============
If you want, you can see this chart as if plotting the Other alts capitalization as if priced against a fictional coin FCOIN, that start by having a price of 1, that combines the up and downs of both BTC price and alts USD capitalization in a very conservative way: if FCOIN price goes up, means that the other alts are gained USD value but only when they have overcome BTC price changes. Otherwise, it goes down.
If this fictional FCOIN has went up during some days straight with a total gain of maybe, greater than 10%, we are maybe in front of the start of an altseason. Sometimes, maybe (it requires some more years to extract a theory out of here), it can be used as proxy of the BTC near future (trend changes or continuations): if this FCOIN goes up, while BTC is doing nothing relevant or even is going down, it could signal that "people" is getting prepared and a generalized altcoin accumulation process has started, because of a combined people's assumption that BTC will start to have an stable uptrend, or will continue the current trend soon. There's some matches in the past about that, but there are also false positives, as usual.
Additionally, four customizable EMAs are added to the script, by default 21, 50, 100 and 150.
Definitions
=========
- Let's call `altcap_btc` the altcoin capitalization in USD, divided by BTC price. In other words, `altcap_btc` is the capitalization in terms of BTC.
- Let's call `x` the BTC price change rate as `btc_price_current_candle / btc_price_previous_candle`. So, if BTC has grown a +20%, `x = 1.20`, and if BTC has gone down a -20%, `x = 0.80`.
- Let's call `y` the `altcap_btc` price change rate, calculated as before but for `altcap_btc`.
- For pure math equivalence, `x * y` is thus the USD capitalization change rate.
Calculation
=========
For plotting the graph, for each candle, I choose a change rate, and then I plot the total accumulated change rate as by `ch0 * ch1 * ch2 * .... * ch_today`, where each `chX` is the choosen change rate of each candle since the beginning of the chart. So, if the "alts compensated value" has grown yesterday +20% and today's -10%, `1.20 * 0.9 = 1.08`, which means that in two days the compensated value has grown an 8% in total.
- If `x * y > 1` (USD cap is growing), I take `y` as change rate (alt/btc change rate).
- If both `x` and `y` are `> 1`, then the graph grows because I'm taking `y`.
- If `x > 1` and `y < 1`, the graph goes down because I'm taking `y`, reflecting the BTC markets are dumping.
- If `x < 1` and `y > 1`, the graph goes up because I'm taking `y`, reflecting the BTC markets are pumping so much that it overcomes the btc fall.
- `x < 1` and `y < 1` is impossible here because `x * y` must be `> 1` by precondition.
- If `x * y < 1` (USD cap is going down), I take `y` or `x * y` depending on the individual change rates:
- If `x` and `y` go in different directions (one up and the other down), I take `x * y` to reflect that USD capitalization has gone down. I don't take `y` here because it could be `> 1`, and I don't want to make the graph grow if alts are lossing USD value. Also, if `y < 1` and I take `y` the graph will go down faster than USD capitalization and I want to show that "alts compensated value is gown down slower than BTC because some boughts are happening". I don't take `x` either here for the same reasons.
- If both `x` and `y` are `< 1`, I take `y`, because otherwise the graph would be less than 0.000001 today after two years of bleeding, making literally impossible to see if alts "grow tomorrow".
- `x > 1` and `y > 1` is impossible here because `x * y` must be `< 1` by precondition.
Spot Symbols for CryptoLibrary "CryptoSpotSymbols"
This Library has one purpose only. It generate Symbols for the Crypto Spot Market, like all the currencies pairs of most Crypto Exchanges available to TradingView.
Have a look at .find() , which is an all in one function.
Binance(basecurrency)
Generate 27 Symbols for the Spot Market of Binance.
Parameters:
basecurrency (simple string) : Its the Basecurrency to generate the Symbols with. Optional. Default value is `syminfo.basecurrency`.
Returns:
BinanceUS(basecurrency)
Generate seven Symbols for the Spot Market of BinanceUS.
Parameters:
basecurrency (simple string) : Its the Basecurrency to generate the Symbols with. Optional. Default value is `syminfo.basecurrency`.
Returns:
Bitfinex(basecurrency)
Generate 12 Symbols for the Spot Market of Bitfinex.
Parameters:
basecurrency (simple string) : Its the Basecurrency to generate the Symbols with. Optional. Default value is `syminfo.basecurrency`.
Returns:
bitFlyer(basecurrency)
Generate three Symbols for the Spot Market of bitFlyer.
Parameters:
basecurrency (simple string) : Its the Basecurrency to generate the Symbols with. Optional. Default value is `syminfo.basecurrency`.
Returns:
Bitget(basecurrency)
Generate seven Symbols for the Spot Market of Bitget.
Parameters:
basecurrency (simple string) : Its the Basecurrency to generate the Symbols with. Optional. Default value is `syminfo.basecurrency`.
Returns:
Bithumb(basecurrency)
Generate two Symbols for the Spot Market of Bithumb.
Parameters:
basecurrency (simple string) : Its the Basecurrency to generate the Symbols with. Optional. Default value is `syminfo.basecurrency`.
Returns:
bitkub(basecurrency)
Generate one Symbol for the Spot Market of bitkub.
Parameters:
basecurrency (simple string) : Its the Basecurrency to generate the Symbols with. Optional. Default value is `syminfo.basecurrency`.
Returns: THB
BitMEX(basecurrency)
Generate two Symbols for the Spot Market of BitMEX.
Parameters:
basecurrency (simple string) : Its the Basecurrency to generate the Symbols with. Optional. Default value is `syminfo.basecurrency`.
Returns:
bitpanda_pro(basecurrency)
Generate six Symbols for the Spot Market of bitpanda pro.
Parameters:
basecurrency (simple string) : Its the Basecurrency to generate the Symbols with. Optional. Default value is `syminfo.basecurrency`.
Returns:
bitrue(basecurrency)
Generate nine Symbols for the Spot Market of bitrue.
Parameters:
basecurrency (simple string) : Its the Basecurrency to generate the Symbols with. Optional. Default value is `syminfo.basecurrency`.
Returns:
Bitstamp(basecurrency)
Generate eight Symbols for the Spot Market of Bitstamp.
Parameters:
basecurrency (simple string) : Its the Basecurrency to generate the Symbols with. Optional. Default value is `syminfo.basecurrency`.
Returns:
BITTREX(basecurrency)
Generate six Symbols for the Spot Market of BITTREX.
Parameters:
basecurrency (simple string) : Its the Basecurrency to generate the Symbols with. Optional. Default value is `syminfo.basecurrency`.
Returns:
BTSE(basecurrency)
Generate 15 Symbols for the Spot Market of BTSE.
Parameters:
basecurrency (simple string) : Its the Basecurrency to generate the Symbols with. Optional. Default value is `syminfo.basecurrency`.
Returns:
BYBIT(basecurrency)
Generate five Symbols for the Spot Market of BYBIT.
Parameters:
basecurrency (simple string) : Its the Basecurrency to generate the Symbols with. Optional. Default value is `syminfo.basecurrency`.
Returns:
CapitalCom(basecurrency)
Generate five Symbols for the Spot Market of capital.com.
Parameters:
basecurrency (simple string) : Its the Basecurrency to generate the Symbols with. Optional. Default value is `syminfo.basecurrency`.
Returns:
coinbase(basecurrency)
Generate seven Symbols for the Spot Market of coinbase.
Parameters:
basecurrency (simple string) : Its the Basecurrency to generate the Symbols with. Optional. Default value is `syminfo.basecurrency`.
Returns:
CoinEx(basecurrency)
Generate three Symbols for the Spot Market of CoinEx.
Parameters:
basecurrency (simple string) : Its the Basecurrency to generate the Symbols with. Optional. Default value is `syminfo.basecurrency`.
Returns:
CurrencyCom(basecurrency)
Generate 30 Symbols for the Spot Market of currency.com.
Parameters:
basecurrency (simple string) : Its the Basecurrency to generate the Symbols with. Optional. Default value is `syminfo.basecurrency`.
Returns:
Delta(basecurrency)
Generate one Symbol for the Spot Market of Delta.
Parameters:
basecurrency (simple string) : Its the Basecurrency to generate the Symbols with. Optional. Default value is `syminfo.basecurrency`.
Returns: USDT
Deribit(basecurrency)
Generate two Symbols for the Spot Market of Deribit.
Parameters:
basecurrency (simple string) : Its the Basecurrency to generate the Symbols with. Optional. Default value is `syminfo.basecurrency`.
Returns:
easyMarkets(basecurrency)
Generate one Symbol for the Spot Market of easyMarkets.
Parameters:
basecurrency (simple string) : Its the Basecurrency to generate the Symbols with. Optional. Default value is `syminfo.basecurrency`.
Returns: USD
Eightcap(basecurrency)
Generate one Symbol for the Spot Market of Eightcap.
Parameters:
basecurrency (simple string) : Its the Basecurrency to generate the Symbols with. Optional. Default value is `syminfo.basecurrency`.
Returns: USD
ExMo(basecurrency)
Generate ten Symbols for the Spot Market of ExMo.
Parameters:
basecurrency (simple string) : Its the Basecurrency to generate the Symbols with. Optional. Default value is `syminfo.basecurrency`.
Returns:
FOREXcom(basecurrency)
Generate four Symbols for the Spot Market of FOREX.com.
Parameters:
basecurrency (simple string) : Its the Basecurrency to generate the Symbols with. Optional. Default value is `syminfo.basecurrency`.
Returns:
FXCM(basecurrency)
Generate three Symbols for the Spot Market of FXCM.
Parameters:
basecurrency (simple string) : Its the Basecurrency to generate the Symbols with. Optional. Default value is `syminfo.basecurrency`.
Returns:
GateIO(basecurrency)
Generate five Symbols for the Spot Market of Gate.io.
Parameters:
basecurrency (simple string) : Its the Basecurrency to generate the Symbols with. Optional. Default value is `syminfo.basecurrency`.
Returns:
Gemini(basecurrency)
Generate ten Symbols for the Spot Market of Gemini.
Parameters:
basecurrency (simple string) : Its the Basecurrency to generate the Symbols with. Optional. Default value is `syminfo.basecurrency`.
Returns:
Kraken(basecurrency)
Generate 14 Symbols for the Spot Market of Kraken.
Parameters:
basecurrency (simple string) : Its the Basecurrency to generate the Symbols with. Optional. Default value is `syminfo.basecurrency`.
Returns:
KuCoin(basecurrency)
Generate 13 Symbols for the Spot Market of KuCoin.
Parameters:
basecurrency (simple string) : Its the Basecurrency to generate the Symbols with. Optional. Default value is `syminfo.basecurrency`.
Returns:
MEXC(basecurrency)
Generate six Symbols for the Spot Market of MEXC.
Parameters:
basecurrency (simple string) : Its the Basecurrency to generate the Symbols with. Optional. Default value is `syminfo.basecurrency`.
Returns:
OANDA(basecurrency)
Generate one Symbol for the Spot Market of OANDA.
Parameters:
basecurrency (simple string) : Its the Basecurrency to generate the Symbols with. Optional. Default value is `syminfo.basecurrency`.
Returns: USD
OKX(basecurrency)
Generate six Symbols for the Spot Market of OKX.
Parameters:
basecurrency (simple string) : Its the Basecurrency to generate the Symbols with. Optional. Default value is `syminfo.basecurrency`.
Returns:
Pepperstone(basecurrency)
Generate one Symbol for the Spot Market of Pepperstone.
Parameters:
basecurrency (simple string) : Its the Basecurrency to generate the Symbols with. Optional. Default value is `syminfo.basecurrency`.
Returns: USD
phemex(basecurrency)
Generate four Symbols for the Spot Market of phemex.
Parameters:
basecurrency (simple string) : Its the Basecurrency to generate the Symbols with. Optional. Default value is `syminfo.basecurrency`.
Returns:
POLONIEX(basecurrency)
Generate nine Symbols for the Spot Market of POLONIEX.
Parameters:
basecurrency (simple string) : Its the Basecurrency to generate the Symbols with. Optional. Default value is `syminfo.basecurrency`.
Returns:
Pyth(basecurrency)
Generate three Symbols for the Spot Market of Pyth.
Parameters:
basecurrency (simple string) : Its the Basecurrency to generate the Symbols with. Optional. Default value is `syminfo.basecurrency`.
Returns:
Skilling(basecurrency)
Generate four Symbols for the Spot Market of Skilling.
Parameters:
basecurrency (simple string) : Its the Basecurrency to generate the Symbols with. Optional. Default value is `syminfo.basecurrency`.
Returns:
TimeX(basecurrency)
Generate six Symbols for the Spot Market of TimeX.
Parameters:
basecurrency (simple string) : Its the Basecurrency to generate the Symbols with. Optional. Default value is `syminfo.basecurrency`.
Returns:
TradeStation(basecurrency)
Generate four Symbols for the Spot Market of TradeStation.
Parameters:
basecurrency (simple string) : Its the Basecurrency to generate the Symbols with. Optional. Default value is `syminfo.basecurrency`.
Returns:
UpBit(basecurrency)
Generate four Symbols for the Spot Market of UpBit.
Parameters:
basecurrency (simple string) : Its the Basecurrency to generate the Symbols with. Optional. Default value is `syminfo.basecurrency`.
Returns:
whitebit(basecurrency)
Generate 13 Symbols for the Spot Market of whitebit.
Parameters:
basecurrency (simple string) : Its the Basecurrency to generate the Symbols with. Optional. Default value is `syminfo.basecurrency`.
Returns:
WOOX(basecurrency)
Generate two Symbols for the Spot Market of WOO.
Parameters:
basecurrency (simple string) : Its the Basecurrency to generate the Symbols with. Optional. Default value is `syminfo.basecurrency`.
Returns:
find(exchange, basecurrency)
Generate up to 30 Symbols for the Spot Market, depending on the market picked.
Parameters:
exchange (simple string) : The name of an Exchange. Case insensitivity. Optional. Default value is `syminfo.prefix`. If something else is put in here it will return `na` values.
basecurrency (simple string) : The Basecurrency to generate the Symbols with. Optional. Default value is `syminfo.basecurrency`
Returns: 30x string as tuple

CL Daily Bitcoin Volume (All exchange included, even Mt.GOX)This daily volume data contains collective total from
____________________________________________________
Historical:
BTC-e BTC/USD (From Q3 2011 to Q3 2016)
BTCChina BTC/CNY (From Q3 2011 to Q2 2017)
Coinsetter BTC/USD (From Q3 2014 to Q1 2016)
MtGox BTC/USD (From July 2010 - 2014 only))
OKcoin International BTC/USD (From Q3 2014 to Q2 2017)
____________________________________________________
Institutions:
CME Bitcoin Futures
Grayscale Bitcoin Trust OTC
____________________________________________________
Spot exchanges:
Bitfinex BTC/USD
Bitstamp BTC/USD
Coinbase BTC/USD
Coinbase BTC/EUR
Binance BTC/USDT
Binance BTC/USDC
Binance BTC/PAX
Gemini BTC/USD
itBit BTC/USD
Kraken BTC/EUR
Kraken BTC/USD
Huobi BTC/USDT
Korbit BTC/KRW
Bitflyer BTC/JPY
____________________________________________________
Others:
Bitmex

Noro's SILA v1.6L StrategyBacktesting
Backtesting (for all the time of existence of couple) only with software configurations to default (without optimization of parameters):
US = Uptrend-Sensivity
DS = Downtrend-Sensivity
It is recommended and by default:
- the normal market requires US=DS (for example US=5, DS=5)
- very bear market requires US DS, (for example US=5, DS=0)
- very bull market requires US DS, (US=0, DS=5)
Cryptocurrencies it is very bull market (US=0, DS=5)
Backtesting BTC/FIAT
D1 timeframe
identical parameters for all pairs
BTC/USD (Bitstamp) profit of +41805%
BTC/EUR (BTC-e) profit of +1147%
BTC/RUB (BTC-e) profit of +1162%
BTC/JPY (Bitflyer) profit of +215%
BTC/CNY (BTCChina) profit of 54948%
Backtesting ALTCOIN/BTC
D1 timeframe
identical parameters for all pairs
the exchange Poloniex
top-10 of cryptocurrencies on capitalization at the time of this text
NA = TradingView can't make backtest because of too low price of this cryptocurrency, or on the website there are no quotations of this cryptocurrency
ETH/BTC (Etherium) profit of +11690%
XRP/BTC (Ripple) loss of-100%
LTC/BTC (Litecoin) NA
ETC/BTC (Etherium Classic) profit of +214%
NEM/BTC loss of-49%
DASH/BTC profit of +106%
IOTA/BTC NA
XMR/BTC (Monero) profit of +96%
STRAT/BTC (Stratis) loss of-31%
ALTCOIN/ALTCOIN - not recomended
I don't need your money, I need reputation and likes.

ZenAlgo - DominatorThis indicator provides a structured multi-ticker overview of market momentum and relative strength by analyzing short-term price behavior across selected assets in comparison with broader crypto dominance and Bitcoin/ETH performance.
Ticker and Market Data Handling
The script accepts up to 9 user-defined symbols (tickers) along with BTCUSD and ETHUSD. For each symbol:
It retrieves the current price.
It also requests the daily opening price from the "D" timeframe to compute intraday percentage change.
For BTC, ETH, and dominance (sum of BTC, USDT, and USDC dominance), daily change is calculated using this same method.
This comparison enables tracking relative performance from the daily open, which provides meaningful insight into intraday strength or weakness among different assets.
Dominance Logic
The indicator aggregates dominance data from BTC , USDT , and USDC using TradingView’s CRYPTOCAP indices. This combined dominance is used as a reference in directional and status calculations. ETH dominance is also analyzed independently.
Changes in dominance are used to infer whether market attention is shifting toward Bitcoin/stablecoins (typically indicating risk-off sentiment) or away from them (typically risk-on behavior, benefiting altcoins).
Price Direction Estimation
The script estimates directional bias using an EMA-based deviation technique:
A short EMA (user-defined lookback , default 4 bars) is calculated.
The current close is compared to the EMA to assess directional bias.
Recent candle changes are also inspected to confirm a consistent short-term trend (e.g., 3 consecutive higher closes for "up").
A small threshold is used to avoid classifying flat movements as trends.
This directionality logic is applied separately to:
The selected ticker's price
BTC price
Combined dominance
This allows the script to contextualize the movement of each asset within broader market conditions.
Market Status Evaluation
A custom function analyzes ETH and BTC dominance trends along with their relative strength to define the overall market regime:
Altseason is identified when BTC dominance is declining, ETH dominance rising, and ETH outperforms BTC.
BTC Season occurs when BTC dominance is rising, ETH dominance falling, and BTC outperforms ETH.
If neither condition is met, the state is Neutral .
This classification is shown alongside each ticker's row in the table and helps traders assess whether market conditions favor Bitcoin, Ethereum, or altcoins in general.
Ticker Status Classification
Each ticker is analyzed independently using the earlier directional logic. Its status is then determined as follows:
Full Bull : Ticker is trending up while dominance is declining or BTC is also rising.
Bullish : Ticker is trending up but not supported by broader bullish context.
Bearish : Ticker is trending down but without broader confirmation.
Full Bear : Ticker is trending down while dominance rises or BTC falls.
Neutral : No strong directional bias or conflicting context.
This classification reflects short-term momentum and macro alignment and is color-coded in the results table.
Table Display and Plotting
A configurable table is shown on the chart, which:
Displays the name and status of each selected ticker.
Optionally includes BTC, ETH, and market state.
Uses color-coding for intuitive interpretation.
Additionally, price changes from the daily open are plotted for each selected ticker, BTC, ETH, and combined dominance. These values are also labeled directly on the chart.
Labeling and UX Enhancements
Labels next to the current candle display price and percent change for each active ticker and for BTC, ETH, and combined dominance.
Labels update each bar, and old labels are deleted to avoid clutter.
Ticker names are dynamically shortened by stripping exchange prefixes.
How to Use This Indicator
This tool helps traders:
Spot early rotations between Bitcoin and altcoins.
Identify intraday momentum leaders or laggards.
Monitor which tickers align with or diverge from broader market trends.
Detect possible sentiment shifts based on dominance trends.
It is best used on lower to mid timeframes (15m–4h) to capture intraday to short-term shifts. Users should cross-reference with longer-term trend tools or structural indicators when making directional decisions.
Interpretation of Values
% Change : Measures intraday move from daily open. Strong positive/negative values may indicate breakouts or reversals.
Status : Describes directional strength relative to market conditions.
Market State : Gives a general bias toward BTC dominance, ETH strength, or altcoin momentum.
Limitations & Considerations
The indicator does not analyze liquidity or volume directly.
All logic is based on short-term movements and may produce false signals in ranging or low-volume environments.
Dominance calculations rely on external CRYPTOCAP indices, which may differ from exchange-specific flows.
Added Value Over Other Free Tools
Unlike basic % change tables or price overlays, this indicator:
Integrates dominance-based macro context into ticker evaluation.
Dynamically classifies market regimes (BTC season / Altseason).
Uses multi-factor logic to determine ticker bias, avoiding single-metric interpretation.
Displays consolidated information in a table and chart overlays for rapid assessment.

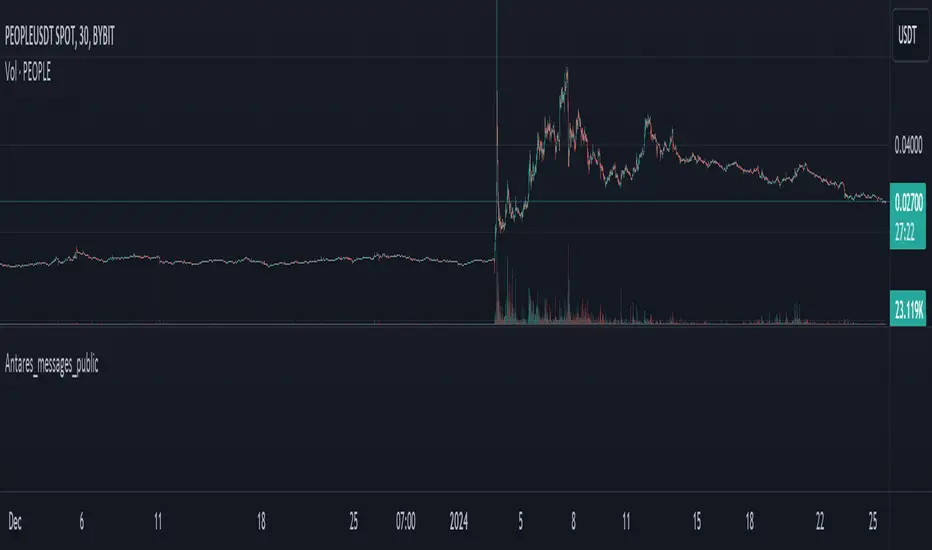
Antares_messages_publicLibrary "Antares_messages_public"
This library add messages for yours strategy for use in Antares trading system for binance and bybit exchanges.
Данная библиотека позволяет формировать сообщения в алертах стратегий для Antares в более упрощенном для пользователя режиме, включая всплывающие подсказки и т.д.
set_leverage(token, market, ticker_id, leverage)
Set leverage for ticker on specified market.
Parameters:
token (string) : (integer or 0) token for trade in system, if = 0 then token part mess is empty. Токен, При значениb = 0 не включается в формирование строки алерта.
market (string) : (string) Spot 'binance' , 'bybit' . Futures ('binancefru','binancefro','bybitfu', 'bybitfi'). Строковая переменная названия биржи.
ticker_id (string) : (string) ticker in market ('btcusdt', 'ethusdt' etc...). Строковая переменная названия тикера (пары).
leverage (float) : (float) leverage level. Устанавливаемое плечо.
Returns: 'Set leverage message'.
pause(time_pause)
Set pause in message. '::' -left and '::' -right included.
Parameters:
time_pause (int)
LongLimit(token, market, ticker_id, type_qty, quantity, price, orderId, leverageforqty)
Buy order with limit price and quantity.
Лимитный ордер на покупку(в лонг).
Parameters:
token (string) : (integer or 0) token for trade in system, if = 0 then token part mess is empty. Токен, При значениb = 0 не включается в формирование строки алерта.
market (string) : (string) Spot 'binance' , 'bybit' . Futures ('binancefru','binancefro','bybitfu', 'bybitfi'). Строковая переменная названия биржи.
ticker_id (string) : (string) ticker in market ('btcusdt', 'ethusdt' etc...). Строковая переменная названия тикера (пары).
type_qty (string) : (string) type of quantity: 1. 'qty' or '' or na - standart (in coins), 2. 'quqty'- in assets (usdt,btc,etc..), 3.open% - open position(futures) or buy (spot) in % of base 4. close% - close in % of position (futures) or sell (spot) coins in % for current quantity
quantity (float) : (float) orders size, see at 'type_qty'. Размер ордера, базы или % в соответствии с 'type_qty'
price (float) : (float) price for limit order. Цена по которой должен быть установлен лимитный ордер.
orderId (string) : (string) if use order id you may change or cancel your order after or set it ''. Используйте OrderId если хотите изменить или отменить ордер в будущем.
leverageforqty (bool) : (bool) use leverage in qty. Использовать плечо при расчете количества или нет.
Returns: 'Limit Buy order'. Лимитный ордер на покупку (лонг).
LongMarket(token, market, ticker_id, type_qty, quantity, leverageforqty)
Market Buy order with quantity.
Рыночный ордер на покупку (в лонг).
Parameters:
token (string) : (integer or 0) token for trade in system, if = 0 then token part mess is empty. Токен, При значениb = 0 не включается в формирование строки алерта.
market (string) : (string) Spot 'binance' , 'bybit' . Futures ('binancefru','binancefro','bybitfu', 'bybitfi'). Строковая переменная названия биржи.
ticker_id (string) : (string) ticker in market ('btcusdt', 'ethusdt' etc...). Строковая переменная названия тикера (пары).
type_qty (string) : (string) type of quantity: 1. 'qty' or '' or na - standart (in coins), 2. 'quqty'- in assets (usdt,btc,etc..), 3.open% - open position(futures) or buy (spot) in % of base 4. close% - close in % of position (futures) or sell (spot) coins in % for current quantity
quantity (float) : (float) orders size, see at 'type_qty'. Размер ордера, базы или % в соответствии с 'type_qty'
leverageforqty (int) : (bool) use leverage in qty. Использовать плечо при расчете количества или нет.
Returns: 'Market Buy order'. Маркетный ордер на покупку (лонг).
ShortLimit(token, market, ticker_id, type_qty, quantity, price, leverageforqty, orderId)
Sell order with limit price and quantity.
Лимитный ордер на продажу(в шорт).
Parameters:
token (string) : (integer or 0) token for trade in system, if = 0 then token part mess is empty. Токен, При значениb = 0 не включается в формирование строки алерта.
market (string) : (string) Spot 'binance' , 'bybit' . Futures ('binancefru','binancefro','bybitfu', 'bybitfi'). Строковая переменная названия биржи.
ticker_id (string) : (string) ticker in market ('btcusdt', 'ethusdt' etc...). Строковая переменная названия тикера (пары).
type_qty (string) : (string) type of quantity: 1. 'qty' or '' or na - standart (in coins), 2. 'quqty'- in assets (usdt,btc,etc..), 3.open% - open position(futures) or buy (spot) in % of base 4. close% - close in % of position (futures) or sell (spot) coins in % for current quantity
quantity (float) : (float) orders size, see at 'type_qty'. Размер ордера, базы или % в соответствии с 'type_qty'
price (float) : (float) price for limit order. Цена по которой должен быть установлен лимитный ордер.
leverageforqty (bool) : (bool) use leverage in qty. Использовать плечо при расчете количества или нет.
orderId (string) : (string) if use order id you may change or cancel your order after or set it ''. Используйте OrderId если хотите изменить или отменить ордер в будущем.
Returns: 'Limit Sell order'. Лимитный ордер на продажу (шорт).
ShortMarket(token, market, ticker_id, type_qty, quantity, leverageforqty)
Sell by market price and quantity.
Рыночный ордер на продажу(в шорт).
Parameters:
token (string) : (integer or 0) token for trade in system, if = 0 then token part mess is empty. Токен, При значениb = 0 не включается в формирование строки алерта.
market (string) : (string) Spot 'binance' , 'bybit' . Futures ('binancefru','binancefro','bybitfu', 'bybitfi'). Строковая переменная названия биржи.
ticker_id (string) : (string) ticker in market ('btcusdt', 'ethusdt' etc...). Строковая переменная названия тикера (пары).
type_qty (string) : (string) type of quantity: 1. 'qty' or '' or na - standart (in coins), 2. 'quqty'- in assets (usdt,btc,etc..), 3.open% - open position(futures) or buy (spot) in % of base 4. close% - close in % of position (futures) or sell (spot) coins in % for current quantity
quantity (float) : (float) orders size, see at 'type_qty'. Размер ордера, базы или % в соответствии с 'type_qty'
leverageforqty (int) : (bool) use leverage in qty. Использовать плечо при расчете количества или нет.
Returns: 'Market Sell order'. Маркетный ордер на продажу (шорт).
Cancel_by_ticker(token, market, ticker_id)
Cancel all orders for market and ticker in setups. Отменяет все ордера на заданной бирже и заданном токене(паре).
Parameters:
token (string)
market (string) : (string) Spot 'binance' , 'bybit' . Futures ('binancefru','binancefro','bybitfu', 'bybitfi'). Строковая переменная названия биржи.
ticker_id (string) : (string) ticker in market ('btcusdt', 'ethusdt' etc...). Строковая переменная названия тикера (пары).
Returns: 'Cancel all orders'. Отмена всех ордеров на заданной бирже и заданном токене(паре).
Cancel_by_id(token, market, ticker_id, orderId)
Cancel order by Id for market and ticker in setups. Отменяет ордер по Id на заданной бирже и заданном токене(паре).
Parameters:
token (string)
market (string) : (string) Spot 'binance' , 'bybit' . Futures ('binancefru','binancefro','bybitfu', 'bybitfi'). Строковая переменная названия биржи.
ticker_id (string) : (string) ticker in market ('btcusdt', 'ethusdt' etc...). Строковая переменная названия тикера (пары).
orderId (string)
Returns: 'Cancel order'. Отмена ордера по Id на заданной бирже и заданном токене(паре).
Close_positions(token, market, ticker_id)
Close all positions for market and ticker in setups. Закрывает все позиции на заданной бирже и заданном токене(паре).
Parameters:
token (string)
market (string) : (string) Spot 'binance' , 'bybit' . Futures ('binancefru','binancefro','bybitfu', 'bybitfi'). Строковая переменная названия биржи.
ticker_id (string) : (string) ticker in market ('btcusdt', 'ethusdt' etc...). Строковая переменная названия тикера (пары).
Returns: 'Close positions'
CloseLongLimit(token, market, ticker_id, type_qty, quantity, price, orderId, leverageforqty)
Close limit order for long position. (futures)
Лимитный ордер на продажу(в шорт) для закрытия лонговой позиции(reduceonly).
Parameters:
token (string) : (integer or 0) token for trade in system, if = 0 then token part mess is empty. Токен, При значениb = 0 не включается в формирование строки алерта.
market (string) : (string) Spot 'binance' , 'bybit' . Futures ('binancefru','binancefro','bybitfu', 'bybitfi'). Строковая переменная названия биржи.
ticker_id (string) : (string) ticker in market ('btcusdt', 'ethusdt' etc...). Строковая переменная названия тикера (пары).
type_qty (string) : (string) type of quantity: 1. 'qty' or '' or na - standart (in coins), 2. 'quqty'- in assets (usdt,btc,etc..), 3.open% - open position(futures) or buy (spot) in % of base 4. close% - close in % of position (futures) or sell (spot) coins in % for current quantity
quantity (float) : (float) orders size, see at 'type_qty'. Размер ордера, базы или % в соответствии с 'type_qty'
price (float) : (float) price for limit order. Цена по которой должен быть установлен лимитный ордер.
orderId (string) : (string) if use order id you may change or cancel your order after or set it ''. Используйте OrderId если хотите изменить или отменить ордер в будущем.
leverageforqty (bool) : (bool) use leverage in qty. Использовать плечо при расчете количества или нет.
Returns: 'Limit Sell order reduce only (close long position)'. Лимитный ордер на продажу для снижения текущего лонга(в шорт не входит).
CloseLongMarket(token, market, ticker_id, type_qty, quantity, leverageforqty)
Close market order for long position.
Рыночный ордер на продажу(в шорт) для закрытия лонговой позиции(reduceonly).
Parameters:
token (string) : (integer or 0) token for trade in system, if = 0 then token part mess is empty. Токен, При значениb = 0 не включается в формирование строки алерта.
market (string) : (string) Spot 'binance' , 'bybit' . Futures ('binancefru','binancefro','bybitfu', 'bybitfi'). Строковая переменная названия биржи.
ticker_id (string) : (string) ticker in market ('btcusdt', 'ethusdt' etc...). Строковая переменная названия тикера (пары).
type_qty (string) : (string) type of quantity: 1. 'qty' or '' or na - standart (in coins), 2. 'quqty'- in assets (usdt,btc,etc..), 3.open% - open position(futures) or buy (spot) in % of base 4. close% - close in % of position (futures) or sell (spot) coins in % for current quantity
quantity (float) : (float) orders size, see at 'type_qty'. Размер ордера, базы или % в соответствии с 'type_qty'
leverageforqty (bool) : (bool) use leverage in qty. Использовать плечо при расчете количества или нет.
Returns: 'Market Sell order reduce only (close long position)'. Ордер на снижение/закрытие текущего лонга(в шорт не входит) по рыночной цене.
CloseShortLimit(token, market, ticker_id, type_qty, quantity, price, orderId, leverageforqty)
Close limit order for short position.
Лимитный ордер на покупку(в лонг) для закрытия шортовой позиции(reduceonly).
Parameters:
token (string) : (integer or 0) token for trade in system, if = 0 then token part mess is empty. Токен, При значениb = 0 не включается в формирование строки алерта.
market (string) : (string) Spot 'binance' , 'bybit' . Futures ('binancefru','binancefro','bybitfu', 'bybitfi'). Строковая переменная названия биржи.
ticker_id (string) : (string) ticker in market ('btcusdt', 'ethusdt' etc...). Строковая переменная названия тикера (пары).
type_qty (string) : (string) type of quantity: 1. 'qty' or '' or na - standart (in coins), 2. 'quqty'- in assets (usdt,btc,etc..), 3.open% - open position(futures) or buy (spot) in % of base 4. close% - close in % of position (futures) or sell (spot) coins in % for current quantity
quantity (float) : (float) orders size, see at 'type_qty'. Размер ордера, базы или % в соответствии с 'type_qty'
price (float) : (float) price for limit order. Цена по которой должен быть установлен лимитный ордер.
orderId (string) : (string) if use order id you may change or cancel your order after or set it ''. Используйте OrderId если хотите изменить или отменить ордер в будущем.
leverageforqty (bool) : (bool) use leverage in qty. Использовать плечо при расчете количества или нет.
Returns: 'Limit Buy order reduce only (close short position)' . Лимитный ордер на покупку (лонг) для сокращения/закрытия текущего шорта.
CloseShortMarket(token, market, ticker_id, type_qty, quantity, leverageforqty)
Set Close limit order for long position.
Рыночный ордер на покупку(в лонг) для сокращения/закрытия шортовой позиции(reduceonly).
Parameters:
token (string) : (integer or 0) token for trade in system, if = 0 then token part mess is empty. Токен, При значениb = 0 не включается в формирование строки алерта.
market (string) : (string) Spot 'binance' , 'bybit' . Futures ('binancefru','binancefro','bybitfu', 'bybitfi'). Строковая переменная названия биржи.
ticker_id (string) : (string) ticker in market ('btcusdt', 'ethusdt' etc...). Строковая переменная названия тикера (пары).
type_qty (string) : (string) type of quantity: 1. 'qty' or '' or na - standart (in coins), 2. 'quqty'- in assets (usdt,btc,etc..), 3.open% - open position(futures) or buy (spot) in % of base 4. close% - close in % of position (futures) or sell (spot) coins in % for current quantity
quantity (float) : (float) orders size, see at 'type_qty'. Размер ордера, базы или % в соответствии с 'type_qty'
leverageforqty (bool) : (bool) use leverage in qty. Использовать плечо при расчете количества или нет.
Returns: 'Market Buy order reduce only (close short position)'. Маркетного ордера на покупку (лонг) для сокращения/закрытия текущего шорта.
cancel_all_close(token, market, ticker_id)
Parameters:
token (string)
market (string)
ticker_id (string)
limit_tpsl_bybitfu(token, ticker_id, order_id, side, type_qty, quantity, price, tp_price, sl_price, leverageforqty)
Set multi order for Bybit : limit + takeprofit + stoploss
Выставление тройного ордера на Bybit лимитка со стоплоссом и тейкпрофитом
Parameters:
token (string) : (integer or 0) token for trade in system, if = 0 then token part mess is empty. Токен, При значениb = 0 не включается в формирование строки алерта.
ticker_id (string) : (string) ticker in market ('btcusdt', 'ethusdt' etc...). Строковая переменная названия тикера (пары).
order_id (string)
side (bool) : (bool) "buy side" if true or "sell side" if false. true для лонга, false для шорта.
type_qty (string) : (string) type of quantity: 1. 'qty' or '' or na - standart (in coins), 2. 'quqty'- in assets (usdt,btc,etc..), 3.open% - open position(futures) or buy (spot) in % of base 4. close% - close in % of position (futures) or sell (spot) coins in % for current quantity
quantity (float) : (float) orders size, see at 'type_qty'. Размер ордера, базы или % в соответствии с 'type_qty'
price (float) : (float) price for limit order by 'side'. Цена лимитного ордера
tp_price (float) : (float) price for take profit order.
sl_price (float) : (float) price for stoploss order
leverageforqty (bool) : (bool) use leverage in qty. Использовать плечо при расчете количества или нет.
Returns: Set multi order for Bybit : limit + takeprofit + stoploss.
replace_limit_tpsl_bybitfu(token, ticker_id, order_id, side, type_qty, quantity, price, tp_price, sl_price, leverageforqty)
Change multi order for Bybit : limit + takeprofit + stoploss
Изменение тройного ордера на Bybit лимитка со стоплоссом и тейкпрофитом
Parameters:
token (string) : (integer or 0) token for trade in system, if = 0 then token part mess is empty. Токен, При значениb = 0 не включается в формирование строки алерта.
ticker_id (string) : (string) ticker in market ('btcusdt', 'ethusdt' etc...). Строковая переменная названия тикера (пары).
order_id (string)
side (bool) : (bool) "buy side" if true or "sell side" if false. true для лонга, false для шорта.
type_qty (string) : (string) type of quantity: 1. 'qty' or '' or na - standart (in coins), 2. 'quqty'- in assets (usdt,btc,etc..), 3.open% - open position(futures) or buy (spot) in % of base 4. close% - close in % of position (futures) or sell (spot) coins in % for current quantity
quantity (float) : (float) orders size, see at 'type_qty'. Размер ордера, базы или % в соответствии с 'type_qty'
price (float) : (float) price for limit order by 'side'. Цена лимитного ордера
tp_price (float) : (float) price for take profit order.
sl_price (float) : (float) price for stoploss order
leverageforqty (bool) : (bool) use leverage in qty. Использовать плечо при расчете количества или нет.
Returns: Set multi order for Bybit : limit + takeprofit + stoploss.
long_stop(token, market, ticker_id, type_qty, quantity, l_stop, leverageforqty)
Stop market order for long position
Рыночный стоп-ордер на продажу для закрытия лонговой позиции.
Parameters:
token (string)
market (string) : (string) 'binance' , 'binancefru' etc.. Строковая переменная названия биржи.
ticker_id (string) : (string) ticker in market ('btcusdt', 'ethusdt' etc...). Строковая переменная названия тикера (пары).
type_qty (string) : (string) type of quantity: 1. 'qty' or '' or na - standart (in coins), 2. 'quqty'- in assets (usdt,btc,etc..), 3.open% - open position(futures) or buy (spot) in % of base 4. close% - close in % of position (futures) or sell (spot) coins in % for current quantity
quantity (float) : (float) orders size. Размер ордера.
l_stop (float) : (float) price for activation stop order. Цена активации стоп-ордера.
leverageforqty (bool) : (bool) use leverage in qty. Использовать плечо при расчете количества или нет.
Returns: 'Stop Market Sell order (close long position)'. Маркетный стоп-ордер на снижения/закрытия текущего лонга.
short_stop(token, market, ticker_id, type_qty, quantity, s_stop, leverageforqty)
Stop market order for short position
Рыночный стоп-ордер на покупку(в лонг) для закрытия шорт позиции.
Parameters:
token (string)
market (string) : (string) 'binance' , 'binancefru' etc.. Строковая переменная названия биржи.
ticker_id (string) : (string) ticker in market ('btcusdt', 'ethusdt' etc...). Строковая переменная названия тикера (пары).
type_qty (string) : (string) type of quantity: 1. 'qty' or '' or na - standart (in coins), 2. 'quqty'- in assets (usdt,btc,etc..), 3.open% - open position(futures) or buy (spot) in % of base 4. close% - close in % of position (futures) or sell (spot) coins in % for current quantity
quantity (float) : (float) orders size. Размер ордера.
s_stop (float) : (float) price for activation stop order. Цена активации стоп-ордера.
leverageforqty (bool) : (bool) use leverage in qty. Использовать плечо при расчете количества или нет.
Returns: 'Stop Market Buy order (close short position)'. Маркетный стоп-ордер на снижения/закрытия текущего шорта.
change_stop_l(token, market, ticker_id, type_qty, quantity, l_stop, leverageforqty)
Change Stop market order for long position
Изменяем стоп-ордер на продажу(в шорт) для закрытия лонг позиции.
Parameters:
token (string)
market (string) : (string) 'binance' , 'binancefru' etc.. Строковая переменная названия биржи.
ticker_id (string) : (string) ticker in market ('btcusdt', 'ethusdt' etc...). Строковая переменная названия тикера (пары).
type_qty (string) : (string) type of quantity: 1. 'qty' or '' or na - standart (in coins), 2. 'quqty'- in assets (usdt,btc,etc..), 3.open% - open position(futures) or buy (spot) in % of base 4. close% - close in % of position (futures) or sell (spot) coins in % for current quantity
quantity (float) : (float) orders size. Размер ордера.
l_stop (float) : (float) price for activation stop order. Цена активации стоп-ордера.
leverageforqty (bool) : (bool) use leverage in qty. Использовать плечо при расчете количества или нет.
Returns: 'Change Stop Market Buy order (close long position)'. Смещает цену активации Маркетного стоп-ордер на снижения/закрытия текущего лонга.
change_stop_s(token, market, ticker_id, type_qty, quantity, s_stop, leverageforqty)
Change Stop market order for short position
Смещает цену активации Рыночного стоп-ордера на покупку(в лонг) для закрытия шорт позиции.
Parameters:
token (string)
market (string) : (string) 'binance' , 'binancefru' etc.. Строковая переменная названия биржи.
ticker_id (string) : (string) ticker in market ('btcusdt', 'ethusdt' etc...). Строковая переменная названия тикера (пары).
type_qty (string)
quantity (float) : (float) orders size. Размер ордера.
s_stop (float) : (float) price for activation stop order. Цена активации стоп-ордера.
leverageforqty (bool) : (bool) use leverage in qty. Использовать плечо при расчете количества или нет.
Returns: 'Change Stop Market Buy order (close short position)'. Смещает цену активации Маркетного стоп-ордер на снижения/закрытия текущего шорта.
open_long_position(token, market, ticker_id, type_qty, quantity, l_stop, leverageforqty)
Cancel and close all orders and positions by ticker , then open Long position by market price with stop order
Отменяет все лимитки и закрывает все позы по тикеру, затем открывает лонг по маркету с выставлением стопа (переворот позиции, при необходимости).
Parameters:
token (string)
market (string) : (string) 'binance' , 'binancefru' etc.. Строковая переменная названия биржи.
ticker_id (string) : (string) ticker in market ('btcusdt', 'ethusdt' etc...). Строковая переменная названия тикера (пары).
type_qty (string) : (string) type of quantity: 1. 'qty' or '' or na - standart (in coins), 2. 'quqty'- in assets (usdt,btc,etc..), 3.open% - open position(futures) or buy (spot) in % of base 4. close% - close in % of position (futures) or sell (spot) coins in % for current quantity
quantity (float) : (float) orders size. Размер ордера.
l_stop (float) : (float). Price for activation stop loss. Цена активации стоп-лосса.
leverageforqty (int) : (bool) use leverage in qty. Использовать плечо при расчете количества или нет.
Returns: 'command_all_close + LongMarket + long_stop.
open_short_position(token, market, ticker_id, type_qty, quantity, s_stop, leverageforqty)
Cancel and close all orders and positions , then open Short position by market price with stop order
Отменяет все лимитки и закрывает все позы по тикеру, затем открывает шорт по маркету с выставлением стопа(переворот позиции, при необходимости).
Parameters:
token (string)
market (string) : (string) 'binance' , 'binancefru' etc.. Строковая переменная названия биржи.
ticker_id (string) : (string) ticker in market ('btcusdt', 'ethusdt' etc...). Строковая переменная названия тикера (пары).
type_qty (string) : (string) type of quantity: 1. 'qty' or '' or na - standart (in coins), 2. 'quqty'- in assets (usdt,btc,etc..), 3.open% - open position(futures) or buy (spot) in % of base 4. close% - close in % of position (futures) or sell (spot) coins in % for current quantity
quantity (float) : (float) orders size. Размер ордера.
s_stop (float) : (float). Price for activation stop loss. Цена активации стоп-лосса.
leverageforqty (int) : (bool) use leverage in qty. Использовать плечо при расчете количества или нет.
Returns: 'command_all_close + ShortMarket + short_stop'.
open_long_trade(token, market, ticker_id, type_qty, quantity, l_stop, qty_ex1, price_ex1, qty_ex2, price_ex2, qty_ex3, price_ex3, leverageforqty)
Cancell and close all orders and positions , then open Long position by market price with stop order and take 1 ,take 2, take 3
Отменяет все лимитки и закрывает все позы по тикеру, затем открывает лонг по маркету с выставлением стопа и 3 тейками (переворот позиции, при необходимости).
Parameters:
token (string)
market (string) : (string) 'binance' , 'binancefru' etc.. Строковая переменная названия биржи.
ticker_id (string) : (string) ticker in market ('btcusdt', 'ethusdt' etc...). Строковая переменная названия тикера (пары).
type_qty (string) : (string) type of quantity: 1. 'qty' or '' or na - standart (in coins), 2. 'quqty'- in assets (usdt,btc,etc..), 3.open% - open position(futures) or buy (spot) in % of base 4. close% - close in % of position (futures) or sell (spot) coins in % for current quantity
quantity (float) : (float) enter order size, see at type_qty. Размер ордера входа, согласно type_qty.
l_stop (float) : (float). Price for activation stop loss. Цена активации стоп-лосса.
qty_ex1 (float) : (float). Quantity for 1th take see at type_qty, if = 0 string for order dont set. Размер лимитного ордера для 1го тейка, согласно type_qty.. Если 0, то строка для этого тейка не формируется
price_ex1 (float) : (float). Price for 1th take , if = 0 string for order dont set. Цена лимитного ордера для 1го тейка. Если 0, то строка для этого тейка не формируется
qty_ex2 (float) : (float). Quantity for 2th take see at type_qty, if = 0 string for order dont set. Размер лимитного ордера для 2го тейка, согласно type_qty..Если 0, то строка для этого тейка не формируется
price_ex2 (float) : (float). Price for 2th take, if = 0 string for order dont set. Цена лимитного ордера для 2го тейка. Если 0, то строка для этого тейка не формируется
qty_ex3 (float) : (float). Quantity for 3th take see at type_qty, if = 0 string for order dont set. Размер лимитного ордера для 2го тейка, согласно type_qty..Если 0, то строка для этого тейка не формируется
price_ex3 (float) : (float). Price for 3th take, if = 0 string for order dont set. Цена лимитного ордера для 3го тейка. Если 0, то строка для этого тейка не формируется
leverageforqty (int)
Returns: 'cancel_all_close + LongMarket + long_stop + CloseLongLimit1 + CloseLongLimit2+CloseLongLimit3'.
open_short_trade(token, market, ticker_id, type_qty, quantity, s_stop, qty_ex1, price_ex1, qty_ex2, price_ex2, qty_ex3, price_ex3, leverageforqty)
Cancell and close all orders and positions , then open Short position by market price with stop order and take 1 and take 2
Отменяет все лимитки и закрывает все позы по тикеру, затем открывает шорт по маркету с выставлением стопа и 3 тейками (переворот позиции, при необходимости).
Parameters:
token (string)
market (string) : (string) 'binance' , 'binancefru' etc.. Строковая переменная названия биржи.
ticker_id (string) : (string) ticker in market ('btcusdt', 'ethusdt' etc...). Строковая переменная названия тикера (пары).
type_qty (string)
quantity (float)
s_stop (float) : (float). Price for activation stop loss. Цена активации стоп-лосса.
qty_ex1 (float) : (float). Quantity for 1th take see at type_qty, if = 0 string for order dont set. Размер лимитного ордера для 1го тейка, согласно type_qty.. Если 0, то строка для этого тейка не формируется
price_ex1 (float) : (float). Price for 1th take , if = 0 string for order dont set. Цена лимитного ордера для 1го тейка. Если 0, то строка для этого тейка не формируется
qty_ex2 (float) : (float). Quantity for 2th take see at type_qty, if = 0 string for order dont set. Размер лимитного ордера для 2го тейка, согласно type_qty..Если 0, то строка для этого тейка не формируется
price_ex2 (float) : (float). Price for 2th take, if = 0 string for order dont set. Цена лимитного ордера для 2го тейка. Если 0, то строка для этого тейка не формируется
qty_ex3 (float) : (float). Quantity for 3th take see at type_qty, if = 0 string for order dont set. Размер лимитного ордера для 2го тейка, согласно type_qty..Если 0, то строка для этого тейка не формируется
price_ex3 (float) : (float). Price for 3th take, if = 0 string for order dont set. Цена лимитного ордера для 3го тейка. Если 0, то строка для этого тейка не формируется
leverageforqty (int)
Returns: 'command_all_close + ShortMarket + short_stop + CloseShortLimit + CloseShortLimit(2)'.
Multi_LongLimit(token, market, ticker_id, type_qty, qty1, price1, qty2, price2, qty3, price3, qty4, price4, qty5, price5, qty6, price6, qty7, price7, qty8, price8, leverageforqty)
8 or less Buy orders with limit price and quantity.
До 8 Лимитных ордеров на покупку(в лонг).
Parameters:
token (string) : (integer or 0) token for trade in system, if = 0 then token part mess is empty. Токен, При значениb = 0 не включается в формирование строки алерта.
market (string) : (string) Spot 'binance' , 'bybit' . Futures ('binancefru','binancefro','bybitfu', 'bybitfi'). Строковая переменная названия биржи.
ticker_id (string) : (string) ticker in market ('btcusdt', 'ethusdt' etc...). Строковая переменная названия тикера (пары).
type_qty (string) : (string) type of quantity: 1. 'qty' or '' or na - standart (in coins), 2. 'quqty'- in assets (usdt,btc,etc..), 3.open% - open position(futures) or buy (spot) in % of base 4. close% - close in % of position (futures) or sell (spot) coins in % for current quantity
qty1 (float)
price1 (float)
qty2 (float)
price2 (float)
qty3 (float)
price3 (float)
qty4 (float)
price4 (float)
qty5 (float)
price5 (float)
qty6 (float)
price6 (float)
qty7 (float)
price7 (float)
qty8 (float)
price8 (float)
leverageforqty (bool) : (bool) use leverage in qty. Использовать плечо при расчете количества или нет.
Returns: 'Limit Buy order'. Лимитный ордер на покупку (лонг).