custom Bollinger bands with filters - indicator (AS)-----------Description-------------
This indicator is basically Bollinger bands with many ways to customize. It uses highest and lowest values of upper and lower band for exits. I think something is wrong with the script but cant find any mistakes – most probably smoothing. The ATR filter is implemented but is working incorrectly. In code you can also turn it into strategy but I do not recommend it for now as it is not ready yet.
So this is my first script and I am looking for any advice, ideas to improve this script, sets of parameters, markets to apply, logical mistakes in code or any ideas that you may have. Indicator was initially designed for EURUSD 5MIN but I would be interested in other ideas.
-----------SETTINGS--------------
---START - In starting settings we can choose
Line 1: what parts to use BB/DC/ATR
Line 2: what parts to plot on chart
Line 3 Whether or not apply smoothing to BB or ATR filter
Line 4 Calculate deviation for BB from price or Moving average
Line 5 Fill colors and plot other parts for debug (overlay=false)
Line 6:( for strategy) – enable Long/Short Trades
---BB and DC – here we modify Bollinger bands and Donchian
Line 1: Length and type of BB middle line and also length of DC from BB
Line 2: Length and type of BB standard deviation and multiplier
Line 3: Length and type of BB smoothing and %width for BB filter
---ATR filter – (not ready fully yet)
Line 1: type and length of ATR
Line 2: threshold and smoothing value of ATR
---DATE and SESSION
Line 1: apply custom date or session?
Line 2: session hours settings
Line 3:Custom starting date
Line 4: Custom Ending date
-----------HOW TO USE--------------
We open Long if BB width is bigger than threshold and close when upper band is no longer highest in the period set. Exact opposite with Short
Buscar en scripts para "bollingerband"

Bollinger Bands %B (ValueRay)One of the key features of this BB%B is its ability to highlight overbought and oversold conditions. This allows you to make informed decisions on when to enter and exit a trade, helping you maximize your profits and minimize your losses.
- Bollinger Bands %B with the ability to change to a different Time Frame.(Defaults to current Chart Time Frame).
- Ability To Turn On/Off Background Highlighting if BB %B is Above/Below 0 / 1 thresholds.
- Ability To Turn On/Off Background Highlighting when BB %B Crosses back above/unser 0/1 thresholds.
---
My personal recommandation use: combine with CM_Ultimate RSI Multi Time Frame (ChrisMoody) and have solid oversold/overbought levels, when hes RSI and my BB %B are bot red/green

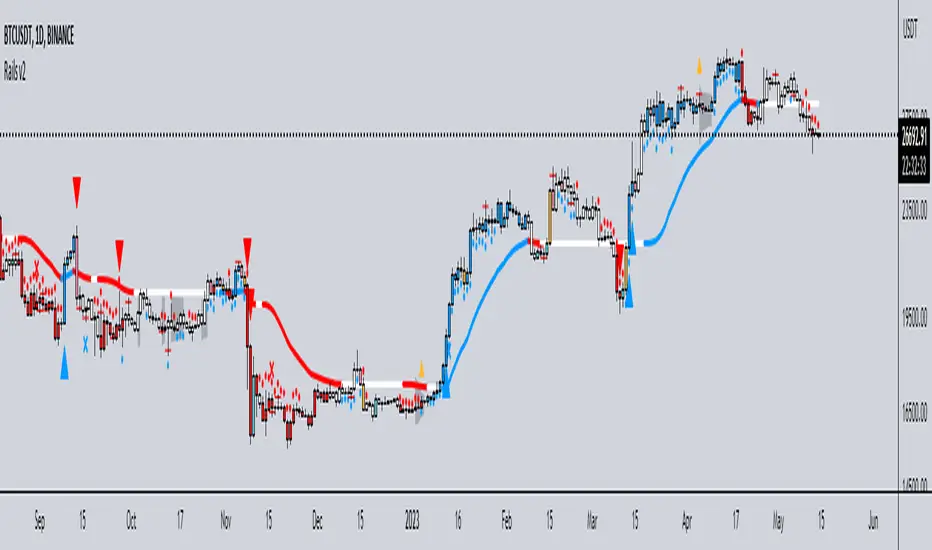
Rails v2Centered around a Variable Moving Average (Rail Line). The Variable Moving Average (VMA) is a study that uses an Exponential Moving Average being able to automatically adjust its smoothing factor according to the market volatility.
In addition to the Rail Line or VMA, the indicator makes use of Bollinger Bands in two ways. First, it displays when the Bollinger Bands are in a squeeze and the potential direction of the breakout. The "squeeze" is the central concept of Bollinger Bands. When the bands come close together, constricting the moving average, it is called a squeeze. A squeeze signals a period of low volatility and is considered by traders to be a potential sign of future increased volatility and possible trading opportunities. The Bollinger Bands are also utilized to highlight when price action might reverse. This signals when price closes outside of the bands, quickly reverts and closes within the bands
The indicator makes use of the Hull Moving Average as a method to quickly capture price action moves thanks to its ability to eliminate lag while managing to improve smoothing at the same time.
Finally, the indicator utilizes Volume Point of Control (VPOC) to determine points in price where the highest amount of volume was traded. Unlike the market profile, the indicator will plot the Volume POC per candle. The script will also plot Trapped Volume. This is important as it tends to serve a signal for reversal. The more price moves away from the trapped volume, Long/Short traders might be forced to cover and price could quickly move away from the area.
DEFAULT SIGNALS: All signals can be turned Off/On by user
Dots = Short Term Trend
Rails Bar Color = Medium Term Trend
Rail Line (VMA) = Long Term Trend
Crossover of Moving Averages = X
Volume Pulse = Large Up/Down Triangle
Potential Bullish Reversal = Light Blue Candle
Potential Bearish Reversal = Pink Candle
Potential Reversal Confirmation = Orange Candle
Squeeze = Shaded White Cloud
Potential Breakout Direction = Small Golden Triangle
Hull Moving Average = Thin Golden Line
Volume POC = Thin Horizontal White Line on Candle
Volume Threshold POC = Thin Horizontal Yellow Line on Candle
Trapped Volume POC = Thin Horizontal Red Line on Candle
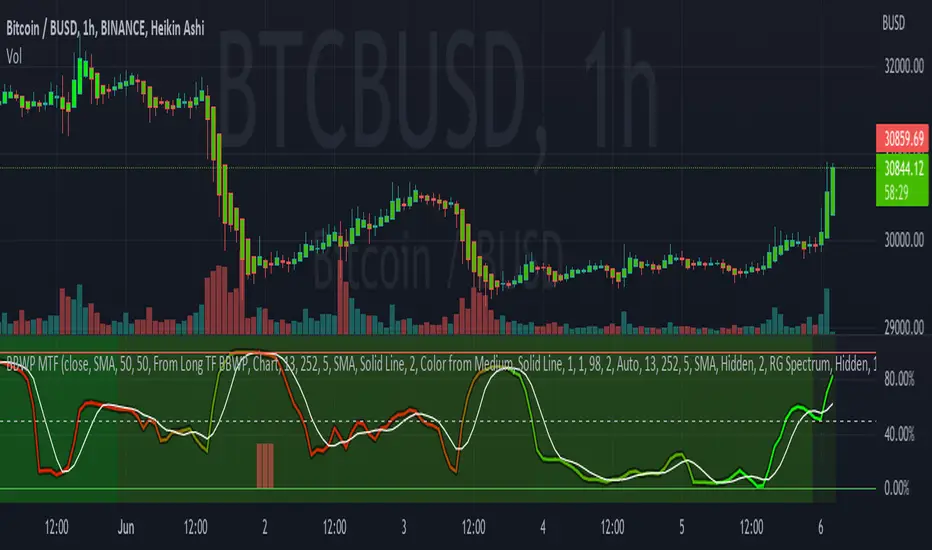
Bollinger Band Width Percentile - Multi Time FrameMy plan with this indicator was when trading at short timeframes, to modify my expectations on the potential impact of short term volatility based on volatility in longer timeframes, and when trading on longer timeframes to attempt to find an optimal entry point based on shorter term volatility.
The BBWP is calculated for a short, medium and long timeframe, alerts are triggered at extremities with the ability to filter by moving averages and chart movement. The alerts also trigger a plot to the "Backtest Signal" which can be used to trigger trades in a backtester.
Please see the discussions of how I'm using this indicator in the comments below.
Thanks to The_Caretaker for "Bollinger Band Width Percentile" upon which this multi time frame version is based.
+ %UMAIf you are familiar with the %B for use with Bollinger Bands, then you will understand this indicator immediately.
Designed for use with my +UMA moving average, this works in exactly the same way, with a few differences.
First off, as you can choose on which type of moving average the calculations are made, so too you will want to match this up with the one you are using. That of course goes for the standard deviation as well (just like you would with Bollinger Bands and %B). Here, because the +UMA uses highs and lows to create a sort of moving average channel, and then also to create the bands, I've opted to set the inner part of the bands as the extreme edge that the %UMA equates with the upper and lower lines.
I've added a moving average, donchian channels, and auto-plotted divergences as well, if you like. Typical color related stuff that I do. Alerts for everything.
Hope you like it!
The above image is comparing two of the same indicator, but based on different moving averages, and how it might plot divergences differently between the two.

Bricklayer's Volatility MeterBricklayer's Volatility Meter will calculate Bollinger Bands Width up to 20 different lengths between lowest and highest input.
• If it is increasing, the brick will be green.
• If it is decreasing, the brick will be red.
The idea is that if volatility is decreasing across an increasing number of periods, the market will be ready for different strategies than when it is increasing.
Good luck trading!

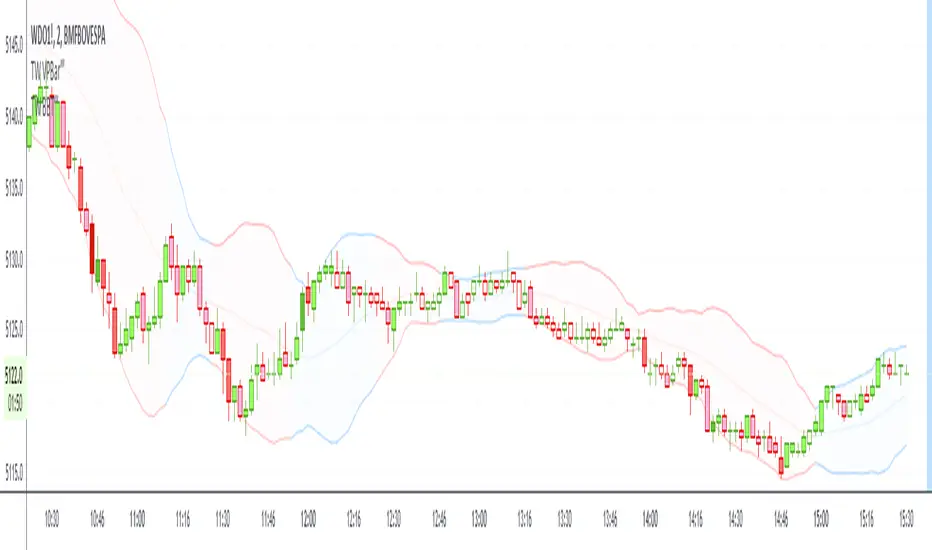
BBT‴ | Bollinger Band Trend Zone‴What does it do?
Makes available to you the BB (Bollinger Bands) in a colored format and provies signal on the right side bar according to a Short, Mid or Long period.
If the candles are going out of the Bands too often, then use the Extended Bollinger Band atributes available to create an extra band around the original ones.
How does it work?
The BB drawing is the exact same as the ordinary one. The big deal here is that the BB shade can be represented by a Short, Mid or Long MA period (7, 20 or 55 period), that you want it to be presented in the shade, which is the same as the MA lines you regularly use. When the MA goes down you have a given color and when the MA goes up you have another given color. This way you don't need to keep looking the MA lines, just perceive the current shade color.
What's my filling?
Makes the quick perception very easy, just look to the chart.
Indicator attributes:
- BB shade color acording to trend
- BB band line colors acording to trend
- right side bar signals color acording to trend
- BB shade can be darker, just drop the box and choose the darker version of it
- Extended Bollinger Band to create an extra band around the original ones
To have access to this indicator, please DM me.
Don't contact me in the comment area.
Risk Reduction Ultimate TemplateThis is a template not actually meant for trading. I picked two random oscillators. This is a template meant to turn into a live trading strategy, however.
It's literally just a specialized take profit/stop loss system. It is to ensure your bot doesn't make any bad moves that you wouldn't have manually. The code should be pretty well annotated. Putting this into my scripts has made them much better. I will work on a Multiple Trigger template next.

+ BB %B: MA selection, bar coloring, multi-timeframe, and alerts+ %B is, at its simplest, the classic Bollinger Bands %B indicator with a few added bells and whistles.
However, the right combination of bells and whistles will often improve and make a more adaptable indicator.
Classically, Bollinger Bands %B is an indicator that measures volatility, and the momentum and strength of a trend, and/or price movements.
It shows "overbought" and "oversold" spots on a chart, and is also useful for identifying divergences between price and trend (similar to RSI).
With + %B I've added the options to select one or two moving averages, candle coloring, and a host of others.
Let's start with the moving averages:
There are options for two: one faster and one slower. Or combine them how you will, or omit one or both of them entirely.
Here you will find options for SMA, EMA (as well as double and triple), Hull MA, Jurik MA, Least Squares MA, Triangular MA, Volatility Adjusted MA, and Weighted MA.
A moving average essentially helps to define trend by smoothing the noise of movements of the underlying asset, or, in this case, the output of the indicator.
All of these MAs available track this in a different way, and it's up to the trader to figure out which makes most sense to him/her.
MA's, in my opinion, improve the basic %B by providing a clearer picture of what the indicator is actually "seeing", and may be useful for providing entries and exits.
Next up is candle coloring:
I've added the option for this indicator to color candles on the chart based on where the %B is in relation to its upper and lower bounds, and median line.
If the %B is above the median but below the upper bound, candles will be green (showing bullish market structure). If %B is below the median but above the lower bound, candles will be red (denoting bearish market structure).
Overbought and oversold candles will also be colored on the chart, so that a quick glance will tell you whether price action is bullish/bearish or "oversold"/"overbought".
I've also added functionality that enables candles to be colored based on if the %B has crossed up or crossed down the primary moving average.
One example as a way to potentially use these features is if the candles are showing oversold coloration followed by the %B crossing up your moving average coloration. You might consider a long there (or exit a short position if you are short).
And the last couple of tweaks:
You may set the timeframe to whatever you wish, so maybe you're trading on the hourly, but you want to know where the %B is on the 4h chart. You can do that.
The background fill for the indicator is split into bullish and bearish halves. Obviously you may turn the background off, or make it all one color as well.
I've also added alerts, so you may set alerts for "overbought" and "oversold" conditions.
You may also set alerts for %B crossing over or under the primary moving average, or for crossing the median line.
All of these things may be turned on and off. You can pretty much customize this to your heart's delight. I see no reason why anyone would use the standard %B after playing with this.
I am no coder. I had this idea in my head, though, and I made it happen through referencing another indicator I was familiar with, and watching tutorials on YouTube.
Credits:
Firstly, thanks to www.tradingview.com for his brilliant, free tutorials on YouTube.
Secondly, thanks to www.tradingview.com for his beautiful SSL Hybrid indicator (and his clean code) from which I obtained the MAs.
Please enjoy this indicator, and I hope that it serves you well. :)

Advanced Bollinger Bands StrategyAdvanced Bollinger Bands Strategy
Why is it an advanced Bollinger Bands Strategy?
The purpose of Bollinger Bands is to provide a relative definition of high and low prices of a market. By definition, prices are high at the upper band and low at the lower band. This definition can aid in rigorous pattern recognition and is useful in comparing price action to the action of indicators to arrive at systematic trading decisions. Adding a Moving Average filter which only allows trades if MA and Price are outside of the BB increases the probability of profitable trades with the sacrifice of a lower trade-frequency.
Inputs for Bollinger Bands
-> BB Source
-> BB Length
-> BB Multiplier
-> Moving Average Period
-> Moving Average Source
-> Strategy Condition Options:
-> Exit Trades if Price crosses Basis Line
-> Enable Moving Average Filter


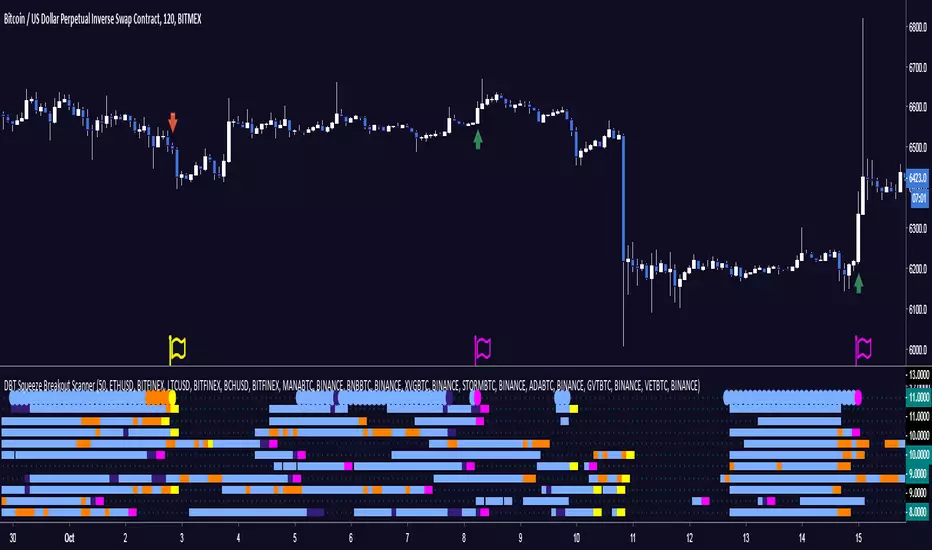
DBT Squeeze Breakout ScannerThe DBT Squeeze Scanner helps you keep an eye on 10 instruments at the same time. It uses a modified version of the DBT Squeeze strategy and scans this strategy against 10 instruments at the same time.
The scanner looks for areas of low volatility signified by a Bollinger Band squeeze and a light blue coloring on the scanner. Once it is squeezing it looks for potential breakout or breakdown opportunities
The scanner has warning signals for both long and short (sell for non margin exchanges) signals, these warning signals are shown as follows:
Light Blue = Bollinger Band Squeeze
Purple = Get ready for a Breakout
Pink = Squeeze has let go and a Breakout is Incoming
Orange = Get ready for a Breakdown
Yellow = Squeeze has let go and a Breakdown is Incoming
All of these signals have their own TradingView alerts. Alerts can be set for anyone of the 10 chosen instruments. Over 10 different kinds of alerts can be setup all at the same time.
This indicator is designed specifically for trending markets, and can be used in many different markets including: Equities, Futures, Commodities, Forex, and Cryptocurrencies. it will give significantly different signals in ranging markets. This indicator is also designed to be 100% preference, PLEASE make sure to choose which 10 instruments you want to watch, the defaults are just some of the major Cryptocurrencies.
Use at your own risk. This is not financial advise and this indicator is not guaranteed to make you profits. Please message me if you have any questions or feedback. Enjoy.
MADE BY GYROMATICAL
MACD+BB (SH v1.1)Twitter: @DrSHelmet. All credit and thanks to @cryptobiasfunke for this strategy.
Disclaimer: I take no responsibility for your usage of this indicator.
Description:
Indicator version: 1.1
This custom script plots the MACD histogram, applies Bollinger bands to the histogram, and then colours the Bollinger bands in different colours depending on whether the bands are contracting or expanding.
Suggested strategy:
Periods of low volatility, seen in a Bollinger band pinch, are followed by large moves (BB expansion). A contraction of the MACD BB may similarly precede a significant move in price. This indicator allows you to see when such a move may be starting, by watching for colour change (default: blue-->orange) on the BB lines after a BB pinch has occured. If the MACD histogram is increasing in magnitude and surfing the BB in a certain direction, this suggests a price move is starting in the direction of the histogram.
Intended for short-timeframe scalping (<1hr charts), but initial testing suggests some validity on higher timeframes.

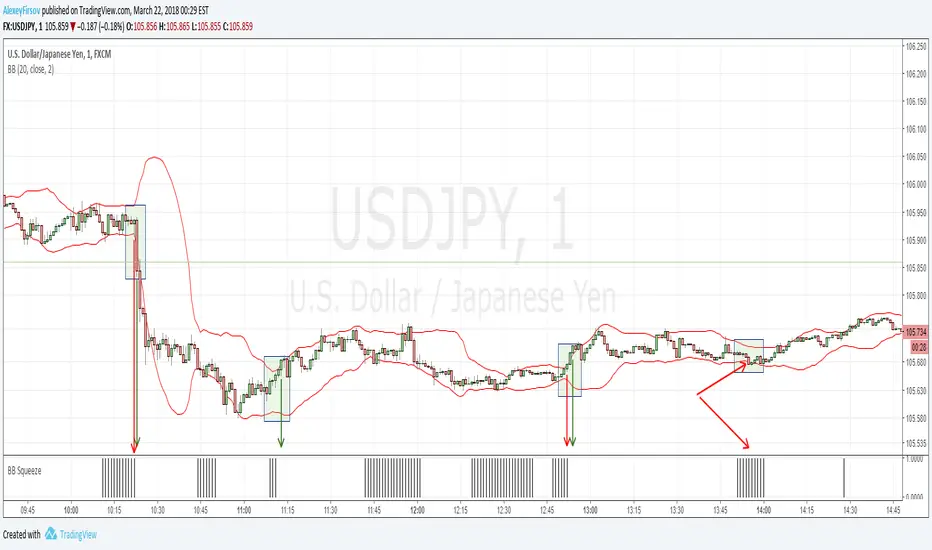
Bollinger Bands SqueezeEnglish:
Simple histogram, showing Squeeze of Bollinger Bands.
Usage is simple - when price is in Squeeze, no entries in any direction. For using with Bollinger Bands indicator, including binary options.
Russian
Простой индикатор, наглядной отображающий стадию Сжатия лент Боллинджера.
Простой в использовании - когда цена в Сжатии - не входим в сделку. Особенно эффективен при связке с индикатором лент Боллинджера и входе в сделку при раскрытии лент. Также применим для бинарных опционов
Example/Пример
Chauvenet RadiusThe Chauvenet criterion is a well-known criterion of selection and rejection of the data used by the Physics. It establishes that in an experiment is well to discard the data whose distance from the average is greater than a certain number of the delta.
In the stock market if prices move away from the average with a volatility too high are suspect. This principle is embodied in the Chauvenet floor with the definition of two asymptotes and two data areas rejection.
The Chauvenet Radius is the quadratic sum of the delta (distance from average) and sigmoid (volatility) and is therefore an obvious market stability index. In fact the moments when price strongly moves away from the average with high volatility coincide with the moments of high instability of the market.
It can be considered an evolution of John Bollinger method introduced during the '80.
Source: www.performancetrading.it
Pro Bollinger Bands Strategy [Breno]This strategy excels in highly volatile financial instruments, including cryptocurrencies, high-beta stocks, commodity futures, and certain exchange-traded funds (ETFs) that exhibit clear mean-reversion characteristics around their Bollinger Bands. The system's ability to utilize scaling (position averaging) and an ATR-based stop loss makes it particularly effective in markets with significant price swings, allowing the trader to capture profits from price extremes while managing increased volatility-related risk.
Core Strategy Logic
This Strategy implements a comprehensive trend-following and mean-reversion strategy primarily leveraging the Bollinger Bands (BB) indicator for entry and exit signals, complemented by an Average True Range (ATR)-based Stop Loss mechanism and an optional EMA filter. It is designed with robust features for capital management, including configurable leverage and a sophisticated position averaging (scaling) system.
Long Entry: A long position is initiated when the closing price crosses over the Lower Bollinger Band (ta.crossover(close,lowerBB)). This signals a potential mean-reversion opportunity following a price dip.
Short Entry: A short position is initiated when the closing price crosses under the Upper Bollinger Band (ta.crossunder(close,upperBB)). (Note: Short entries are disabled by default in the script inputs).
Exit Conditions (Profit Target): Long positions aim to exit upon interaction with the Upper Bollinger Band. Users can select from three exit methods:
"Close When Touch": Exits when close≥upperBB.
"Close Above then Below": Exits when the previous close was above the upper band, and the current close is below it (a reversal signal).
"High Above": Exits when high>upperBB. The strategy features an optional profitOnly setting, which restricts all exits to only occur if the trade is currently in profit (i.e., close is above the strategy.position_avg_price for longs).
Key Features and Customization
Bollinger Bands & Filters -
Customizable BB Parameters: The Length and Deviation of the Bollinger Bands are fully adjustable, allowing users to fine-tune the sensitivity of the entry and exit signals.
Optional EMA Filter: An optional EMA Filter can be enabled to align entries with the prevailing trend, where a Long entry is only permitted if close≥EMA(EmaFilterRange).
Risk and Capital Management -
Equity Allocation: Position size is dynamically calculated based on a Percentage of Equity (capitalPerc) combined with the set Leverage multiplier.
Dynamic Stop Loss (ATR-Based):
An optional Stop Loss (SL) is calculated using a multiple (slAtrInput) of the Average True Range (ATR).
The SL is set relative to the entry price upon trade activation, providing a volatility-adjusted risk management layer.
Position Averaging (Scaling): The script supports the addition of multiple units (pyramiding) to an existing position based on three user-selected criteria:
"No": No averaging.
"Percent": Adds to the position if the price has dropped by a set percentage (addPct) from the average price.
"ATR": Adds to the position if the current price is significantly below a calculated ATR-based support level from the average price.

Bollinger Bands Regression Forecast [BigBeluga]🔵 OVERVIEW
The Bollinger Bands Regression Forecast combines volatility envelopes from Bollinger Bands with a linear regression-based projection model .
It visualizes both current and future price zones by extrapolating the Bollinger channel forward in time, giving traders a statistical forecast of probable support and resistance behavior.
🔵 CONCEPTS
Classic Bollinger Bands use a moving average (basis) and standard deviation (deviation) to form dynamic envelopes around price.
This indicator enhances them with linear regression slope detection , allowing it to forecast how the band may expand or contract in the future.
Regression is applied to both the band’s basis and deviation components to predict their trajectory for a user-defined number of Forecast Bars .
The resulting forecast creates a smoothed, funnel-shaped projection that dynamically adapts to volatility.
▲ and ▼ markers highlight potential mean reversion points when price crosses the outer bounds of the bands.
🔵 FEATURES
Forecast Engine : Uses linear regression to project Bollinger Band movement into the future.
Dynamic Channel Width : Adapts standard deviation and slope for realistic volatility modeling.
Auto-Labeled Levels : Displays live upper and lower forecast values for quick reference.
Cross Signals : Marks potential overbought and oversold zones with ▲/▼ signals when price exits the band.
Trend-Adaptive Basis Color : Basis line automatically switches color to represent short-term trend direction.
Customizable Colors and Widths for complete visual control.
🔵 HOW TO USE
Apply the indicator to visualize both current Bollinger structure and its forward projection.
Use ▲/▼ breakout markers to identify short-term reversals or volatility shifts.
When price consistently rides the upper band forecast, the trend is strong and likely continuing.
When regression shows narrowing bands ahead, expect a volatility contraction or consolidation period.
For range traders, outer projected bands can be used as potential mean reversion entry points .
Combine with volume or momentum filters to confirm whether breakouts are genuine or fading.
🔵 CONCLUSION
Bollinger Bands Regression Forecast transforms classic Bollinger analysis into a predictive forecasting model .
By merging volatility dynamics with regression-based extrapolation, it provides traders with a forward-looking visualization of likely price boundaries — revealing not only where volatility is but also where it’s heading next.

RSI Reversal + BB RSIReversal Alerts
SELL Reversal (reversalSELL)
Triggers when:
RSI touches or crosses above the upper BB, and
The current candle is bearish (close < open).
→ Plots a small red circle above the candle
→ Fires alert named “reversalSELL”
BUY Reversal (reversalBUY)
Triggers when:
RSI touches or crosses below the lower BB, and
The current candle is bullish (close > open).
→ Plots a small green circle below the candle
→ Fires alert named “reversalBUY”

Bollinger Band Breakout With Volatility StoplossDetailed Explanation of the Bollinger Band Breakout With Volatility Stoploss System
Introduction
The "Bollinger Band Breakout With Volatility Stoploss" system is a trading strategy designed to exploit price volatility in financial markets using the Bollinger Bands indicator, a widely recognized tool developed by John Bollinger. This system adapts the traditional Bollinger Bands framework into a Volatility Breakout strategy, focusing on capturing significant price movements by leveraging customized parameters and precise trading rules. The system operates exclusively on long positions, employs a daily timeframe, and incorporates dynamic risk management techniques to optimize trade outcomes while preserving capital.
System Parameters
The system modifies the standard Bollinger Bands configuration to suit its breakout methodology:
Standard Deviation (SD): Set to 1x, determining the width of the bands relative to the central moving average. This tighter setting enhances sensitivity to price movements, making the system responsive to smaller volatility shifts compared to the conventional 2x SD.
Period: A 30-day (1-month) lookback period is used to calculate the bands, providing a balance between capturing medium-term price trends and avoiding excessive noise from shorter timeframes.
Moving Average Type: The system uses an Exponential Moving Average (EMA) instead of the Simple Moving Average (SMA). The EMA places greater weight on recent price data, making it more responsive to current market conditions and better suited for detecting breakout opportunities in dynamic markets.
Core Concept
The Bollinger Band Breakout system is built on the principle of Volatility Breakout, which seeks to capitalize on significant price movements when the price breaks out of a defined volatility range. The Bollinger Bands, consisting of an EMA as the central line and two bands (Upper and Lower) calculated as the EMA plus or minus 1x SD, define this range. The system operates on a Daily Chart (D) timeframe, making it suitable for traders who prefer analyzing and executing trades based on daily price action. By focusing solely on Long Positions (buying low and selling high), the system avoids short-selling, aligning with strategies that capitalize on upward price momentum.
The core idea is to use the 1x SD multiplier over a 30-day period to establish a dynamic price range that reflects recent market volatility. Breakouts above the Upper Band signal potential buying opportunities, while penetrations below the Lower Band indicate exits, ensuring trades are aligned with significant price movements.
Trading Signals
The system generates clear entry and exit signals based on price interactions with the Bollinger Bands:
Buy Signal: A buy signal is triggered when the closing price of a daily candle exceeds the Upper Bollinger Band (EMA + 1x SD over 30 days). The trade is entered at the opening price of the subsequent candle, ensuring the breakout is confirmed by the close of the prior day. This approach minimizes false signals by waiting for a definitive breach of the volatility threshold.
Sell Signal: A sell signal occurs when the closing price falls below the Lower Bollinger Band (EMA - 1x SD over 30 days). The position is exited at the opening price of the next candle, allowing the trader to lock in profits or limit losses when the price reverses or loses momentum.
Risk Management
Risk management is a cornerstone of the system, ensuring capital preservation and disciplined trade execution:
Initial Stoploss: The stoploss is set at the Lower Bollinger Band of the candle that triggered the buy signal. This level acts as a volatility-based threshold, below which the trade is deemed invalid, prompting an immediate exit to protect capital. Traders have two options for implementing the stoploss:
Pending Stoploss: A predefined stoploss order placed at the Lower Band level.
Conditional Exit: Using the sell signal condition (price closing below the Lower Band) as the exit trigger, effectively aligning the stoploss with the system’s exit rules.
Position Sizing: The system employs Fixed Fractional Position Sizing with a risk per trade capped at 3% of the account balance. The position size is calculated based on the distance between the entry price and the Initial Stoploss, incorporating Volatility Position Sizing. This method adjusts the trade size according to the market’s volatility, ensuring that risk remains consistent across varying market conditions. Two options are available for managing capital:
Gear Up Option: Profits from previous trades are reinvested into the account’s capital, increasing the base for calculating the next position size. This compounding approach can amplify returns but also increases risk exposure.
Fixed Equity Option: Profits from previous trades are withdrawn, and only the remaining capital is used for calculating the next position size. This conservative approach prioritizes capital preservation by not compounding gains.
Trailing Stop: The system uses the Lower Bollinger Band as a dynamic trailing stop, which adjusts with price movements and volatility. This ensures that profits are protected during favorable trends while allowing the trade to remain open as long as the price stays above the Lower Band. The trailing stop aligns with the sell signal condition, maintaining consistency in the system’s exit strategy.
Supporting Indicators
The system incorporates two additional indicators to enhance market analysis and decision-making:
Bollinger Band Width (BBW): BBW measures the distance between the Upper and Lower Bollinger Bands relative to the EMA, serving as a proxy for market volatility.
A high BBW indicates significant price volatility, often associated with strong trends or large price movements, which may confirm the strength of a breakout.
A low BBW suggests low volatility, potentially signaling a period of consolidation or "squeeze" that could precede a breakout. This can help traders anticipate potential trade setups.
The BBW calculation uses the EMA to maintain consistency with the system’s core parameters.
Bollinger Band Ratio (BBR) or %B: BBR measures the price’s position relative to the Bollinger Bands, providing insight into market conditions.
BBR > 1: The price is above the Upper Band, indicating potential overbought conditions or strong upward momentum, which aligns with the system’s buy signal.
BBR < 0: The price is below the Lower Band, suggesting oversold conditions or downward momentum, corresponding to the sell signal or stoploss trigger.
BBR between 0 and 1: The price is within the bands, indicating a neutral state where no immediate action is required.
Like BBW, BBR is calculated using the EMA for consistency.
Backtesting and Implementation
To evaluate the system’s performance, traders can utilize the Backtest Parameter function, which allows for testing the strategy across user-defined time periods. This feature enables traders to assess the system’s effectiveness under various market conditions, optimize parameters, and refine their approach based on historical data.
Conclusion
The Bollinger Band Breakout With Volatility Stoploss system is a robust, volatility-driven trading strategy that combines the predictive power of Bollinger Bands with disciplined risk management. By focusing on long positions, using a 1x SD multiplier, and incorporating EMA-based calculations, the system is designed to capture significant price breakouts while minimizing risk through dynamic stoplosses and volatility-adjusted position sizing. The inclusion of BBW and BBR indicators provides additional context for assessing market conditions, enhancing the trader’s ability to make informed decisions. With its structured approach and backtesting capabilities, this system is well-suited for traders seeking a systematic, data-driven method to trade in volatile markets.

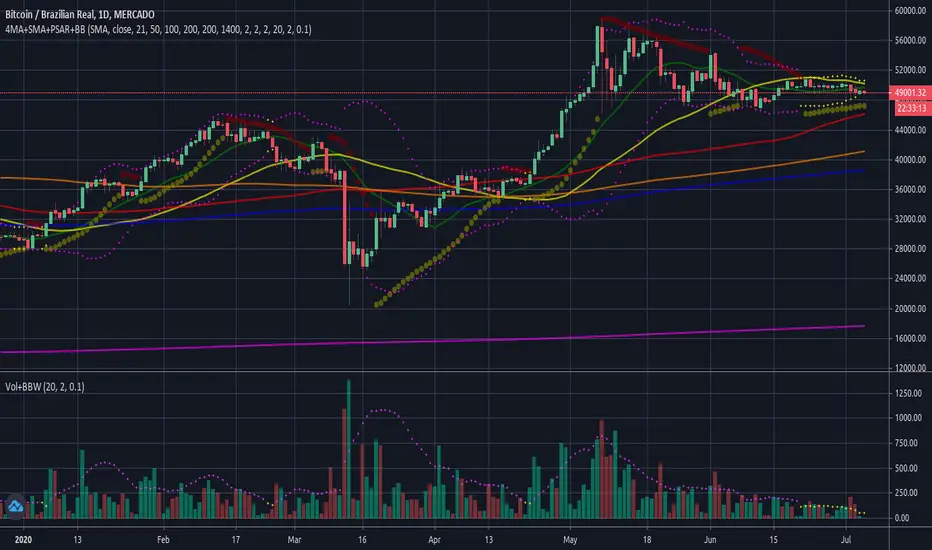
Zero Lag MTF Moving Average by CoffeeshopCryptoBased on Moving Average Types supplied by @TradingView www.tradingview.com
Ideas and code enhanced to show higher timeframe by @CoffeeShopCrypto
It’s time to take the guesswork out of moving averages and multiple timeframes when day trading. Moving averages are a cornerstone of many trading strategies, often viewed as dynamic support and resistance levels. Traders rely on these levels to anticipate price reactions, whether it’s a bounce in a trending market or a reversal in a ranging one. Additionally, the direction and alignment of multi timeframe moving averages—whether they’re moving in the same direction or diverging—provide critical clues about market momentum and potential reversals. However, the traditional higher timeframe moving average indicators force traders to wait for higher timeframe candles to close, creating lag and missed opportunities.
The Old Way
For example: If you are on a 5 minute chart and you want to observe the location and direction of a 30 minute chart Moving Average, you'll need to wait for a total of 6 candles to close, and again every 6 candles after that. This only creates more lag.
The New Way
Now there is no waiting for high timeframe session candles to close. No matter what timeframe Moving Average you want to know about, this indicator will show you its location on your current chart at any time in real time.
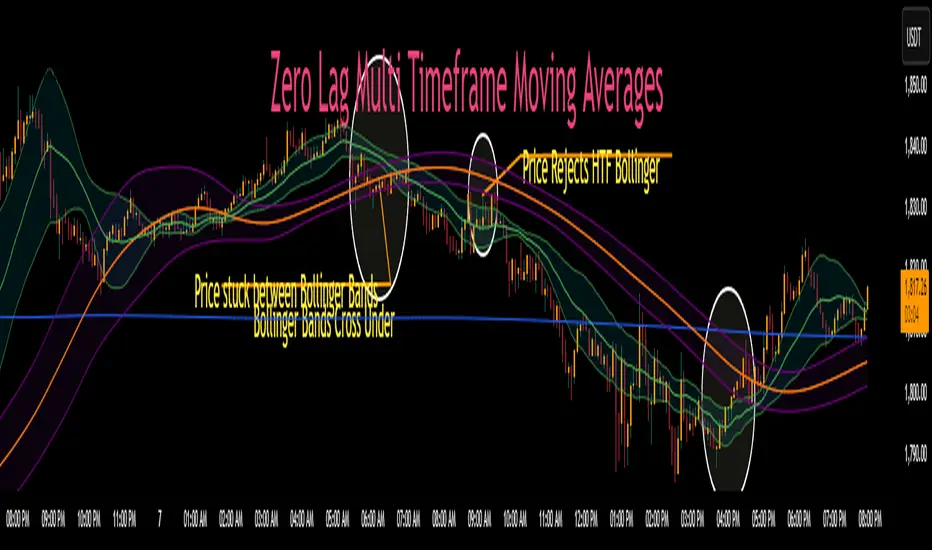
For those who prefer Bollinger Bands, this indicator adds a whole new dimension to your strategy. Traders often wait for price action to break outside the lower time frame Bollinger bands before considering a trade, while still seeking key support or resistance levels beyond them. But if you don't know the position of your higher time frame Bollinger, you could be trading into a trap. With Zero Lag Multi Timeframe Moving Average, you can view both your current and higher timeframe Bollinger Bands simultaneously with zero waiting. This lets you instantly see when price action is traveling between the bands of either timeframe or breaking through both—indicating a strong trend in that direction. Additionally, when both sets of Bollinger Bands overlap at the same price levels, it highlights areas of strong consolidation and ranging conditions, giving you a clear picture of market dynamics. This is a key element in price action that tells you there is currently no direction to the market and both the current and higher time frames are flat.
Enter Zero Lag Multi Timeframe Moving Average—the ultimate tool for real-time higher timeframe moving averages and Bollinger Bands. This innovative indicator eliminates the delay, delivering instant, precise values for higher timeframe averages and bands, even on open candles. Seamlessly combining current and higher timeframe data, it allows traders to identify key moments where moving averages or Bollinger Bands align or diverge, signaling market conditions. Whether you’re gauging the strength of a trend, pinpointing potential reversals, or identifying consolidation zones, Zero Lag Multi Timeframe Moving Average gives you the clarity needed to make better trading decisions according to market conditions.
Why is this "Mashup" of moving averages different and important?
Honestly its really about the calculation thats imported through the "import library" function.
Heres what it does:
The ZLMTF-MA is designed to help traders easily see where higher timeframe moving averages and Bollinger Bands are—without needing to switch chart timeframes or wait for those larger candles to close. It works by adjusting common moving average types like SMA, EMA, and VWMA to show what they would look like if they were based on a higher timeframe, right on your current chart. This helps users stay focused on their main timeframe while still having a clear view of the bigger picture, making it easier to spot trend direction, key support and resistance levels, and overall market structure. The goal is to keep things simple, fast, and more visually informative for everyday traders.
Bollinger Bands
When working with Bollinger Bands, a common strategy is to take the trades once price action has escaped through the top or bottom of your current Bollinger Band.
A false breakout occurs when both Bollinger Bands are not moving in the same direction as eachother or when they are overlapping.
Moving Averages as Support and Resistance:
Traders who use Moving Averages as support or resistance, looking for rejections or failures of these areas can now see multiple timeframe price action instantly and simultaneously.
Trading Setup Examples:
Price Action Scenario 1:
Higher Timeframe Ranging-
When price action breaks through a current moving average headed toward a higher timeframe moving average, trades are taken with caution if the moving averages are converging.
Price Action Scenario 2:
Strong Trending Market -
If the moving averages are in the same direction, and your price action is now leading the low timeframe moving average, you have re-entered a strong trend.
Price Action Scenario 3:
High Timeframe Rejections -
If you have a rejection of a higher timeframe moving average, and your both averages are still diverging, this is the end of a pullback as you re-enter a strong trend in the original direction
Price Action Scenario 4:
Trend Reversals -
If you close beyond both the low and high timeframe moving averages, you can consider that price action is strong enough to change direction here and you should prepare for trade setups in the opposite direction of the previous.
HTF MA Label Information:
Even if your high timeframe moving average is turned off, you can still see this label.
It gives you a quick reminder of what high timeframe settings you have used to see MA values.
Profit Trailing BBandsProfit Trailing Trend BBands v4.7.5 with Double Trailing SL
A TradingView Pine Script Strategy
Created by Kevin Bourn and refined with the help of Grok 3 (xAI)
Overview
Welcome to Profit Trailing Trend BBands v4.7.5, a dynamic trading strategy designed to ride trends and lock in profits with a unique double trailing stop-loss mechanism. Built for TradingView’s Pine Script v6, this strategy combines Bollinger Bands for trend detection with a smart trailing system that doubles down on profit protection. Whether you’re trading XRP or any other asset, this tool aims to maximize gains while keeping risk in check—all with a clean, visual interface.
What It Does
Identifies Trends: Uses Bollinger Bands to spot uptrends (price crossing above the upper band) and downtrends (price crossing below the lower band).
Enters Positions: Opens long or short trades based on trend signals, with customizable position sizing and leverage.
Trails Profits: Employs a two-stage trailing stop-loss:
Initial Trailing SL: Acts as a take-profit level, set as a percentage (%) or dollar ($) distance from the entry price.
Tightened Trailing SL: Once the initial profit target is hit, the stop-loss tightens to half the initial distance, locking in gains as the trend continues.
Manages Risk: Includes a margin call feature to exit losing positions before they blow up your account.
Visualizes Everything: Plots Bollinger Bands (blue upper, orange lower) and a red stepped trailing stop-loss line for easy tracking.
Why Built It?
Captures Trends: Bollinger Bands are a proven way to catch momentum, and we tuned them for responsiveness (short length, moderate multiplier).
Secures Profits: Traditional trailing stops often leave money on the table or exit too early. The double trailing SL first takes a chunk of profit, then tightens up to ride the rest of the move.
Stays Flexible: Traders can tweak price sources, stop-loss types (% or $), and position sizing to fit their style.
Looks Good: Clear visuals help you see the strategy in action without cluttering your chart.
Originally refined for XRP, it’s versatile enough for most markets — crypto, forex, stocks, you name it.
How It Works
Core Components
Bollinger Bands:
Calculated using a simple moving average (SMA) and standard deviation.
Default settings: 6-period length, 1.66 multiplier.
Upper Band (blue): SMA + (1.66 × StdDev).
Lower Band (orange): SMA - (1.66 × StdDev).
Trend signals: Price crossing above the upper band triggers a long, below the lower band triggers a short.
Double Trailing Stop-Loss:
Initial SL: Set via "Trailing Stop-Loss Value" (default 6% or $6). Trails the price at this distance and doubles as the first profit target.
Tightened SL: Once price hits the initial SL distance in profit (e.g., +6%), the SL tightens to half (e.g., 3%) and continues trailing, locking in gains.
Visualized as a red stepped line, only visible during active positions.
Position Sizing:
Choose "% of Equity" (default 30%) or "Amount in $" to set trade size.
Leverage (default 10x) amplifies positions, capped by available equity to avoid overexposure.
Margin Call:
Exits positions if drawdown exceeds the "Margin %" (default 10%) to protect your account.
Backtesting Filter:
Starts trading after a user-defined date (default: Jan 1, 2020) for focused historical analysis.
Trade Logic
Long Entry: Price crosses above the upper Bollinger Band → Closes any short position, opens a long.
Short Entry: Price crosses below the lower Bollinger Band → Closes any long position, opens a short.
Exit: Position closes when price hits the trailing stop-loss or triggers a margin call.
How to Use It
Setup
Add to TradingView:
Open TradingView, go to the Pine Editor, paste the script, and click "Add to Chart."
Ensure you’re using Pine Script v6 (the script includes @version=6).
Configure Inputs:
Start Date for Backtesting: Set the date to begin historical testing (default: Jan 1, 2020).
BB Length & Mult: Adjust Bollinger Band sensitivity (default: 6, 1.66).
BB Price Source: Choose the price for BBands (default: Close).
Trend Price Source: Choose the price for trend detection (default: Close).
Trailing Stop-Loss Type: Pick "%" or "$" (default: Trailing SL %).
Trailing Stop-Loss Value: Set the initial SL distance (default: 6).
Margin %: Define the max drawdown before exit (default: 10%).
Order Size Type & Value: Set position size as % of equity (default: 30%) or $ amount.
Leverage: Adjust leverage (default: 10x).
Run It:
Use the Strategy Tester tab to backtest on your chosen asset and timeframe.
Watch the chart for blue/orange Bollinger Bands and the red trailing SL line.
Tips for Traders
Timeframes: Works on any timeframe, but test 1H or 4H for XRP—great balance of signals and noise.
Assets: Optimized for XRP, but tweak slValue and mult for other markets (e.g., tighter SL for low-volatility pairs).
Risk Management: Keep marginPercent low (5-10%) for volatile assets; adjust leverage based on your risk tolerance.
Visuals: The red stepped SL line shows only during trades—zoom in to see its tightening in action.
Visuals on the Chart
Blue Line: Upper Bollinger Band (trend entry for longs).
Orange Line: Lower Bollinger Band (trend entry for shorts).
Red Stepped Line: Trailing Stop-Loss (shifts tighter after the first profit target).
Order Labels: Short tags like "OL" (Open Long), "CS" (Close Short), "LSL" (Long Stop-Loss), etc., mark trades.
Disclaimer
Trading involves risk. This strategy is for educational and experimental use—backtest thoroughly and use at your own risk. Past performance doesn’t guarantee future results. Not financial advice—just a tool from traders, for traders.

02 SMC + BB Breakout (Improved)This strategy combines Smart Money Concepts (SMC) with Bollinger Band breakouts to identify potential trading opportunities. SMC focuses on identifying key price levels and market structure shifts, while Bollinger Bands help pinpoint overbought/oversold conditions and potential breakout points. The strategy also incorporates higher timeframe trend confirmation to filter out trades that go against the prevailing trend.
Key Components:
Bollinger Bands:
Calculated using a Simple Moving Average (SMA) of the closing price and a standard deviation multiplier.
The strategy uses the upper and lower bands to identify potential breakout points.
The SMA (basis) acts as a centerline and potential support/resistance level.
The fill between the upper and lower bands can be toggled by the user.
Higher Timeframe Trend Confirmation:
The strategy allows for optional confirmation of the current trend using a higher timeframe (e.g., daily).
It calculates the SMA of the higher timeframe's closing prices.
A bullish trend is confirmed if the higher timeframe's closing price is above its SMA.
This helps filter out trades that go against the prevailing long-term trend.
Smart Money Concepts (SMC):
Order Blocks:
Simplified as recent price clusters, identified by the highest high and lowest low over a specified lookback period.
These levels are considered potential areas of support or resistance.
Liquidity Zones (Swing Highs/Lows):
Identified by recent swing highs and lows, indicating areas where liquidity may be present.
The Swing highs and lows are calculated based on user defined lookback periods.
Market Structure Shift (MSS):
Identifies potential changes in market structure.
A bullish MSS occurs when the closing price breaks above a previous swing high.
A bearish MSS occurs when the closing price breaks below a previous swing low.
The swing high and low values used for the MSS are calculated based on the user defined swing length.
Entry Conditions:
Long Entry:
The closing price crosses above the upper Bollinger Band.
If higher timeframe confirmation is enabled, the higher timeframe trend must be bullish.
A bullish MSS must have occurred.
Short Entry:
The closing price crosses below the lower Bollinger Band.
If higher timeframe confirmation is enabled, the higher timeframe trend must be bearish.
A bearish MSS must have occurred.
Exit Conditions:
Long Exit:
The closing price crosses below the Bollinger Band basis.
Or the Closing price falls below 99% of the order block low.
Short Exit:
The closing price crosses above the Bollinger Band basis.
Or the closing price rises above 101% of the order block high.
Position Sizing:
The strategy calculates the position size based on a fixed percentage (5%) of the strategy's equity.
This helps manage risk by limiting the potential loss per trade.
Visualizations:
Bollinger Bands (upper, lower, and basis) are plotted on the chart.
SMC elements (order blocks, swing highs/lows) are plotted as lines, with user-adjustable visibility.
Entry and exit signals are plotted as shapes on the chart.
The Bollinger band fill opacity is adjustable by the user.
Trading Logic:
The strategy aims to capitalize on Bollinger Band breakouts that are confirmed by SMC signals and higher timeframe trend. It looks for breakouts that align with potential market structure shifts and key price levels (order blocks, swing highs/lows). The higher timeframe filter helps avoid trades that go against the overall trend.
In essence, the strategy attempts to identify high-probability breakout trades by combining momentum (Bollinger Bands) with structural analysis (SMC) and trend confirmation.
Key User-Adjustable Parameters:
Bollinger Bands Length
Standard Deviation Multiplier
Higher Timeframe
Higher Timeframe Confirmation (on/off)
SMC Elements Visibility (on/off)
Order block lookback length.
Swing lookback length.
Bollinger band fill opacity.
This detailed description should provide a comprehensive understanding of the strategy's logic and components.
***DISCLAIMER: This strategy is for educational purposes only. It is not financial advice. Past performance is not indicative of future results. Use at your own risk. Always perform thorough backtesting and forward testing before using any strategy in live trading.***
