expected range STRATEGYThis is the strategy version of "expected range STUDY". The buy and sell signals are generated with the study version, but what is displayed on the chart is different. Here, the PnL of each trade is shown on the chart, as well as the peak profit point of each trade up till the present. Black areas represent take profit and waiting for the next trade to start. Green = long. Red = short. Set to take profit at 53% and stoploss is set to -7%. Having a stoploss trigger does not put a black area on the chart. For the XBTUSD 2 hour chart, but use it however you like on whatever chart for backtesting.
Enjoy. Don't get rekt. A good backtest doesn't mean a good forward test. Use at your own risk.
Buscar en scripts para "backtesting"

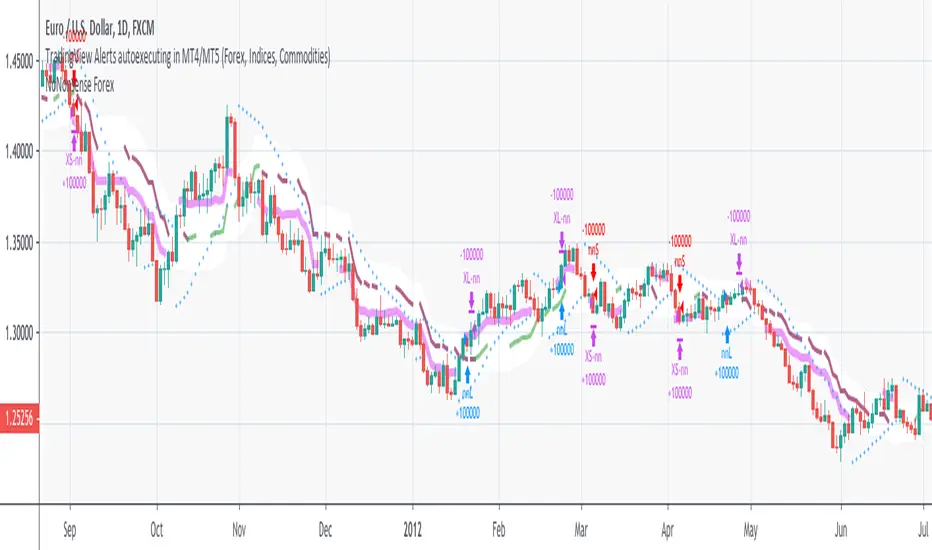
NoNonsense Forex - high timeframe trading absurd NON-REPAINTINGSome time ago I bumped into NoNonsense Forex - pretty good-looking course with well-designed videos, reasonable rules, etc. Nice explanatory videos, not selling anything, building indicators-only strategy. But there was one thing that really annoyed me - it was supposed to work only on Daily timeframe. What is the point in trading such high timeframe, if decisions changing market direction are playing out within 1 minute? What is the point in evaluating trades from 1994 if we are 25 years later?
Anyway, I have developed this strategy, which is:
- non-repainting
- not using trailing-stop
- not using any other known TradingView backtest bugs
And I'm showing it as an example of OVERFITTING. Backtesting results look absurd: 100% profitable. But if you change any of the many parameters in the Settings popup, they will turn into disaster. It means, the rules of this strategy are very fragile. Don't trade this! Remember about backtesting rule #1: past results do not guarantee success in the future.
I'm giving this strategy out with the source code. Feel free to do anything you want with it. But if you find parameters or modifications on, which allow profitable trading on lower timeframes, don't be shy, let me know :)
*********
Forex / Indices / Commodities traders who want to start AUTO-TRADING might want to take a look at "TradingConnector", which allows no-latency trades execution from TradingView to MT4/MT5.
WOW no repainting and no security() call! 100% real results!If you couldn't tell by the title, this is a joke lmao.
TV has an awful backtesting engine and I just wanted to prove this with a super simple script.
We buy when close > open
and sell when close < open.
That's it.
There is also some risk management and trade closing when we reach a certain drawdown, but wait!
TradingView doesn't know what equity drawdown is because they don't use tick data or any lower timeframe data! Wowow!
Ps - all tickdata for Forex & CFD historical data is free from Dukascopy if you want to perform your own backtesting ;)
Dukascopy Data
Enjoy
-DasanC
Complete turtles strategy based on the donchian channelsDear Traders and investor,
I want to demonstrate scrypt of the iconic "trend following strategy" coded by my
The main idea was borrowed from the book "Way of the Turtle: The Secret Methods that Turned Ordinary People into Legendary". The strategy is based on the donchian channels and is one of the oldest and easiest strategy in the using. Also strategy include risk managment and trends filter which prevent false entries and high drawndowns. The results are based on the period from 2006 to present, but you can also change timeframe and period of backtesting.
Best regards,
Vlad

SimpleCrossOver_BotThis is a simple example of how you can compile your own strategy
This script contains the code for alerts and for backtesting.
In order to use the backtester, comment out the sections to be used for signals, and comment in the sections to be used on the back tester, and visa versa for using the script for alerts in order to automate your own bot.
Awesome Oscillator.MMouse_Lager_BCEAwesome Oscillator with added options for turning short trades on and off, as well as a start date for backtesting.

Pivot Reversal Strategy - TimeFramedThis is Pivot Reversal Strategy including the time frames for backtesting.

Updated TurtlesThis script has been updated to prevent double orders (short/long) from occurring and modifying backtests results.
This is an update to the script that was written a few years ago to prevent double longs/shorts from occurring and skewin backtesting results. Check out the updated indicator here and let me know what you think.
I also added:
- date range inputs if you want to do some backtesting on a particular set of dates.
- the ability to toggle shorting

3 Duck's Trading System from Babypips.comThe 3 Duck's Trading System from Babypips.com
The 3 Duck's Trading System is the most popular and active trading system thread on the the babypips.com forum. It is a system that is mainly for beginners because it teaches you discipline, learning to cope with price moving against your position and learning to stay in a trade and keep profits running. For the thread and more info on the 3 Duck's Trading System click here
How does it work?
The system is a very simple enter/exit based on the 60 SMA of 3 different time frames: 4 hour, 1 hour and 5 minute.
The Rules, er, the Ducks! The Ducks must all be in a row for a trade to take place!
Duck 1 - To go long, price must be above the 60 SMA on the 4 hour chart.
Duck 2 - To go long, price must be above the 60 SMA on the 1 hour chart.
Duck 3 - To go long, price must cross above the 60 SMA on the 5 minute chart and the 60 SMA of the 5 minute chart must be below that of the 4 hour and 1 hour chart. (obviously the reverse for shorting)
YOU MUST USE THIS SYSTEM ONLY ON THE 5 MINUTE CHART.
I say this because I have already charted all of the Ducks into the 5 minute chart so you don't have to flip back and forth.
I have also added some inputs for profit targets, stop targets, trailing stops and times to trade for backtesting.
If you have any questions or comments, please let me know! If you see I messed up on something, please let me know!
Also a VERY special thanks to the babypips.com user Captain_Currency . He wrote this strategy 10 years ago (2007 was 10 years ago?!) and he is still active on the thread and posting results and offering help!

Adam Smith - MovingAvg CrossSimple Moving Average Cross script. Test on stocks and currency. For stocks test shorter time periods, meaning intra-day time periods such as 3min to 30min and so on to fit what is best. For currency, try longer periods with this model such as day to weeks depending on which currency.
NOTE: Take a look at your Max Drawdowns when testing. This will be the main indicator once you figure out your time period for backtesting. This will also let you know how much money to save and/or hold back in savings for down periods.
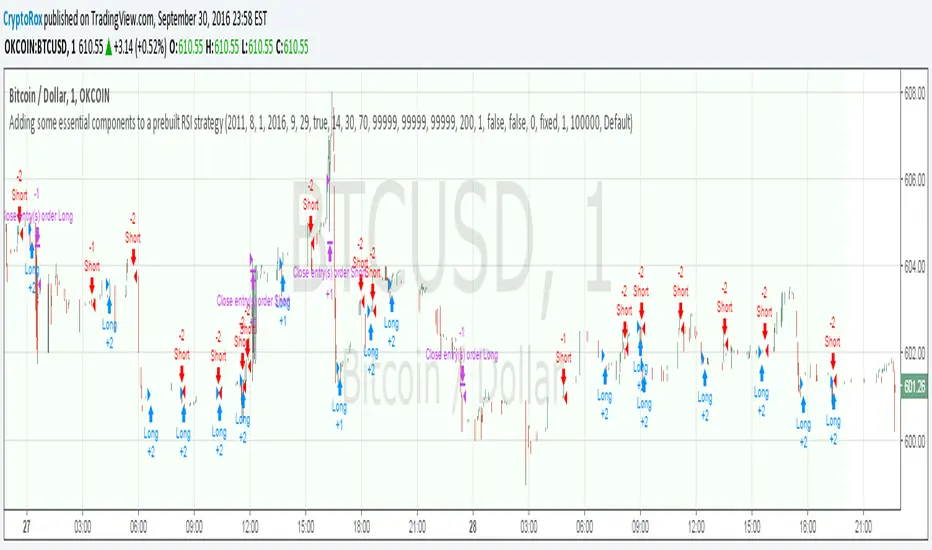
Adding some essential components to a prebuilt RSI strategyThis is more to be used as a blank_slate for any strategy build adding more effective backtesting with a period selector and inputs like TS, TP, SL that can all be used as plots for alerts.
It has the BackTest Component created by Pbergden
It also includes the standard long/short with trailing stop, take profit, stop loss and margin call.
Here is a video using the blank_slate to add in the built-in RSI Strategy.
youtu.be
We hope this brings good results and helps speed things up for everyone.
Institutional Execution Engine v3 [Nishith Rajwar]
Institutional Execution Engine v3
Market-Structure-Driven Execution Framework (Indicator + Strategy Hybrid)
The **Institutional Execution Engine v3** is a professional-grade execution framework designed to model **how institutional participants interact with liquidity, volatility regimes, and market structure**.
It is built for **index traders, crypto traders, and systematic intraday participants** who require **non-repainting, forward-validated signals** with strict risk control.
This is **not a mashup of indicators**.
Every module is purpose-built and interacts through a unified execution pipeline.
---
🔍 Core Concepts & Methodology
1️⃣ Market Structure & POI Engine
* Identifies **Points of Interest (POIs)** using swing structure, volatility context, and liquidity positioning
* POIs are **confirmed only after bar close** (strict non-repaint enforcement)
* Adaptive pivot sensitivity based on selected execution preset
2️⃣ Liquidity-Aware Scoring System
Each potential trade is filtered through a **multi-factor execution score**, including:
* Structural alignment
* Volatility normalization (ATR regime)
* Liquidity reaction quality
* Directional efficiency
Trades are only allowed when the **minimum institutional score threshold** is met.
3️⃣ Regime Detection (Forward-Walk Safe)
The engine dynamically classifies market conditions into execution regimes:
* Trending
* Rotational
* Mean-reverting
Regime detection is **forward-walk compatible** and does **not leak future data**.
4️⃣ Risk-First Execution Model
* ATR-normalized stop placement
* R-multiple-based take-profit targeting
* Optional **single-trade-per-session guard**
* Strategy engine includes **open-trade protection** to prevent over-execution
5️⃣ Strategy + Indicator Hybrid
This script can be used in **two ways**:
* **Indicator mode** → discretionary execution with visual POIs, signals, and context
* **Strategy mode** → systematic backtesting with full TradingView Strategy Tester support
Both modes share the **same execution logic** (no divergence).
---
⚙️ Preset-Driven Architecture
Built-in execution presets auto-configure internal parameters without changing core logic:
* **Scalp (Index)**
* **Daytrade (Index)**
* **Crypto Intraday**
* **Institutional Research (FWalk)**
Presets adjust pivot sensitivity, score thresholds, ATR behavior, and risk profile — while preserving execution integrity.
---
## 🚫 Non-Repainting & Data Integrity
* No look-ahead bias
* No future bar references
* No repainting signals
* VWAP and regime logic reset correctly per session
* Safe handling of strategy.opentrades to avoid execution errors
All signals are **bar-close confirmed**.
---
📊 Who This Is For
✔ Index traders (NIFTY / BANKNIFTY / SENSEX)
✔ Crypto intraday traders
✔ Systematic traders validating execution logic
✔ Traders who value **structure + liquidity + risk discipline** over indicators
---
⚠️ Disclaimer
This script is a **research and execution framework**, not financial advice.
Always forward-test and adapt risk parameters to your instrument and timeframe.
---
**Author:** Nishith Rajwar
**Version:** v3
**Execution Philosophy:** Trade where institutions execute — not where indicators react.

Buy-Dip / Sell-Pullback Buy the Dip / Sell the Pullback – Trend-Following Strategy (EOD → Next Day Execution)
Overview
This is a trend-following futures strategy designed to participate in pullbacks within established trends, not to predict reversals.
It works on End-of-Day (EOD) confirmation and executes trades on the next trading session, making it suitable for positional and swing traders.
The strategy combines momentum, trend direction, volatility, and price location to filter for high-quality setups while avoiding overtrading.
🔍 Core Philosophy
Trade only in the direction of the prevailing trend
Buy dips in uptrends
Sell pullbacks in downtrends
Avoid chasing price after extended gaps
Use volatility-adjusted risk management (ATR-based SL & targets)
📊 Indicators Used
RSI (20)
Measures underlying momentum strength
Stochastic Oscillator (55, 34, 21)
Confirms pullback exhaustion within a trend
Supertrend (10, 2)
Defines primary trend direction
Bollinger Bands (20, 2)
Provides structural trend bias
ATR (5)
Used for:
Entry gap filter
Stop-loss
Profit target
Supertrend buffer
✅ Long (Buy) Setup – Evaluated at EOD
A long setup is generated when all of the following conditions are satisfied at the close of the trading day:
RSI(20) is above the bullish threshold (default: 48)
Stochastic %K is above %D (confirming pullback momentum)
Supertrend direction is bullish
Price is near or above Supertrend, allowing a volatility-adjusted buffer (ATR-based)
Price is above the Bollinger Band middle line
This combination ensures:
The market is trending up
Momentum supports continuation
The pullback is controlled, not a breakdown
❌ Short (Sell) Setup – Evaluated at EOD
A short setup is generated when:
RSI(20) is below the bearish threshold (default: 52)
Stochastic %K is below %D
Supertrend direction is bearish
Price is near or below Supertrend, with an ATR buffer
Price is below the Bollinger Band middle line
This filters for pullbacks within sustained downtrends.
⏰ Trade Execution Logic (Next Day Rule)
Once a setup is confirmed at EOD, a trade is attempted on the next trading session
To avoid chasing gaps:
Long trades are allowed only if price does not move more than a defined multiple of the previous day’s True Range
Short trades follow the same logic in reverse
This is implemented via limit orders, ensuring realistic backtesting and execution behavior
🛑 Risk Management
All exits are volatility-adjusted using ATR:
Stop-Loss:
1.1 × ATR(5) from entry price
Target:
2.2 × ATR(5) from entry price
This results in a risk–reward ratio of approximately 1:2
ATR is frozen at entry to avoid forward-looking bias.
🧠 Why This Strategy Works
Avoids low-quality trades during consolidation
Participates only when trend + momentum align
Prevents emotional gap-chasing
Adapts automatically to changing volatility
Suitable for index futures and liquid stocks
📌 Recommended Usage
Timeframe: Daily
Instruments:
Index Futures (e.g. NIFTY, BANKNIFTY)
Highly liquid stocks
Market Type: Trending markets
Not ideal for: Sideways or low-volatility environments
⚙️ Customization Tips
You can control trade frequency and aggressiveness by adjusting:
RSI thresholds
Supertrend buffer (ATR multiple)
Gap filter multiplier
Stochastic edge parameter
Looser settings → more trades
Stricter settings → higher selectivity
⚠️ Disclaimer
This strategy is for educational and research purposes only.
Backtest results do not guarantee future performance.
Always validate with paper trading before deploying real capital.

PMax - Asymmetric MultipliersDescription: This script is an enhanced version of the popular PMax (Profit Maximizer) indicator, originally developed by KivancOzbilgic. It has been converted into a full strategy with advanced customization options for backtesting and trend following.
Key Features & Modifications:
Asymmetric ATR Multipliers: Unlike the standard version, this script allows you to set different ATR multipliers for Upper (Short/Resistance) and Lower (Long/Support) bands.
Default Upper: 1.5 (Tighter trailing for Short positions)
Default Lower: 3.0 (Wider trailing for Long positions to avoid whipsaws)
Expanded MA Types: Added HULL (HMA) and VAR (Variable Index Dynamic Average) options.
VAR is highly recommended for filtering out noise in ranging markets.
HULL is ideal for scalping and faster reactions.
Built-in Risk Management: A fixed 5% Stop Loss mechanism is integrated into the strategy. It protects your capital by closing positions if the price moves 5% against you, even if the trend hasn't reversed yet.
Visibility Fix: Solved the issue where the PMax line would disappear or start at zero in the initial bars.
How to Use:
Use the VAR MA type for trend following in volatile markets.
Adjust the "Stop Loss Percent" input to fit your risk appetite.
The strategy employs an "Always In" logic (Long/Short) but respects the hard Stop Loss.
Credits: Original PMax logic by KivancOzbilgic.

Double&Triple Pattern[TS_Indie]📌 Description – Double & Triple Pattern Indicator
The Double & Triple Pattern Indicator is developed to help traders systematically and clearly identify Double Top, Double Bottom, Triple Top, and Triple Bottom chart patterns.
⚙️ Core Logic & Working Mechanism
The Double & Triple Pattern Indicator is built on the concept of price swing formation, based on the logic of Trend Entry_0 , which focuses on structured market analysis and price action behavior.
The indicator detects three main swing points (Swing 1, Swing 2, and Swing 3). A Fibonacci Box is then created using Swing A and Swing B as reference points to define the swing detection zone.
When all three swings remain inside the defined Fibonacci Box, the structure is considered a valid Price Action setup.
The indicator then plots key lines on the chart:
➩ Break Line – used to confirm the signal (confirmation)
➩ Cancel Line – used to invalidate the price action if price moves against the conditions
➛ When price breaks the Break Line , the structure is confirmed and a Pending Order is placed at Swing B , with the Stop Loss set at Swing 1.
➛ If price breaks the Cancel Line first, the price action structure is immediately invalidated.
⚙️ Fibonacci Entry Zone & Change SL Settings
➩ When Fibo Entry Zone is set to 0, the Pending Order is placed directly at Swing B.
➩ When the value is greater than 0, the Pending Order is calculated using Fibonacci levels drawn from Swing B to the Stop Loss level.
➩ Change SL allows switching the Stop Loss reference between Swing 1 and Swing A.
⚙️ Min & Max Control for Swing Size : xATR
When enabling Control Size Swing : xATR , the indicator filters Swing B based on the defined Min and Max range.
This allows traders to selectively test larger or smaller swing-based price actions , depending on their trading strategy.
⭐ Pending Order Cancellation Conditions
A Pending Order will be canceled under the following conditions:
1.A new Price Action signal appears on either the Buy or Sell side.
2.When Time Session is enabled, the Pending Order is canceled once price exits the selected session.
🕹 Order Management Rule
When there is an active open position, the indicator restricts the creation of new Pending Orders to prevent overlapping positions.
💡 Double Pattern Example
💡 Triple Pattern Example
⚠️ Disclaimer
This indicator is designed for technical analysis purposes only and does not constitute investment advice.
Users should apply proper risk management and make decisions at their own discretion.
🥂 Community Sharing
If you find parameter settings that work well or produce strong statistical results, feel free to share them with the community so we can improve and develop this indicator together.

Trend Following $ZEC - Multi-Timeframe Structure Filter + Revers# Trend Following CRYPTOCAP:ZEC - Strategy Guide
## 📊 Strategy Overview
Trend Following CRYPTOCAP:ZEC is an enhanced Turtle Trading system designed for cryptocurrency spot trading, combining Donchian Channel breakouts, multi-timeframe structure filtering, and ATR-based dynamic risk management for both long and short positions.
---
## 🎯 Core Features
1. Multi-Timeframe Structure Filtering
- Uses Swing High/Low to identify market structure
- Customizable structure timeframe (default: 1 minute)
- Only enters trades in the direction of the trend, avoiding counter-trend positions
2. Reverse Signal Exit
- No fixed stop-loss or fixed-period exits
- Exits only when a reverse entry signal triggers
- Maximizes trend profits, reduces premature exits
3. ATR Dynamic Pyramiding
- Adds positions when price moves 0.5 ATR in favorable direction
- Supports up to 2 units maximum (adjustable)
- Pyramid scaling to enhance profitability
4. Complete Risk Management
- Fixed position size (5000 USD per unit)
- Commission fee 0.06% (Binance spot rate)
- Initial capital 10,000 USD
---
## 📈 Trading Logic
Entry Conditions
✅ Long Entry:
- Close price breaks above 20-period high
- Structure trend is bullish (price breaks above Swing High)
✅ Short Entry:
- Close price breaks below 20-period low
- Structure trend is bearish (price breaks below Swing Low)
Add Position Conditions
- Long: Price rises ≥ 0.5 ATR
- Short: Price falls ≥ 0.5 ATR
- Maximum 2 units including initial entry
Exit Conditions
- Long Exit: When short entry signal triggers (price breaks 20-period low + structure turns bearish)
- Short Exit: When long entry signal triggers (price breaks 20-period high + structure turns bullish)
---
## ⚙️ Parameter Settings
Channel Settings
- Entry Channel Period: 20 (Donchian Channel breakout period)
- Exit Channel Period: 10 (reserved parameter, actually uses reverse signal exit)
ATR Settings
- ATR Period: 20
- Stop Loss ATR Multiplier: 2.0 (reserved parameter)
- Add Position ATR Multiplier: 0.5
Structure Filter
- Swing Length: 160 (Swing High/Low calculation period)
- Structure Timeframe: 1 minute (can change to 5/15/60, etc.)
Position Management
- Maximum Units: 2 (including initial entry)
- Capital Per Unit: 5000 USD
---
## 🎨 Visualization Features
Background Colors
- Light Green: Bullish structure
- Light Red: Bearish structure
- Dark Green: Long entry
- Dark Red: Short entry
Optional Display (Default: OFF)
- Entry/exit channel lines
- Structure high/low lines
- ATR stop-loss line
- Next add position indicator
- Entry/exit labels
---
## 📱 Alert Message Format
Strategy sends notifications on entry/exit with the following format:
- Entry: `1m Long EP:428.26`
- Add Position: `15m Add Long 2/2 EP:429.50`
- Exit: `1m Close Long Reverse Signal`
Where:
- `1m`/`15m` = Current chart timeframe
- `EP` = Entry Price
---
## 💰 Backtest Settings
Capital Allocation
- Initial Capital: 10,000 USD
- Per Entry: 5,000 USD (split into 2 entries)
- Leverage: 0x (spot trading)
Trading Costs
- Commission: 0.06% (Binance spot VIP0)
- Slippage: 0
---
## 🎯 Use Cases
✅ Best Scenarios
- Trending markets
- Moderate volatility assets
- 1-minute to 4-hour timeframes
⚠️ Not Suitable For
- Highly volatile choppy markets
- Low liquidity small-cap coins
- Extreme market conditions (black swan events)
---
## 📊 Usage Recommendations
Timeframe Suggestions
| Timeframe | Trading Style | Suggested Parameter Adjustment |
|-----------|--------------|-------------------------------|
| 1-5 min | Scalping | Swing Length 100-160 |
| 15-30 min | Short-term | Swing Length 50-100 |
| 1-4 hour | Swing Trading | Swing Length 20-50 |
Optimization Tips
1. Adjust swing length based on backtest results
2. Different coins may require different parameters
3. Recommend backtesting on 1-minute chart first before live trading
4. Enable labels to observe entry/exit points
---
## ⚠️ Risk Disclaimer
1. Past Performance Does Not Guarantee Future Results
- Backtest data is for reference only
- Live trading may be affected by slippage, delays, etc.
2. Market Condition Changes
- Strategy performs better in trending markets
- May experience frequent stops in ranging markets
3. Capital Management
- Do not invest more than you can afford to lose
- Recommend setting total capital stop-loss threshold
4. Commission Impact
- Frequent trading accumulates commission fees
- Recommend using exchange discounts (BNB fee reduction, etc.)
---
## 🔧 Troubleshooting
Q: No entry signals?
A: Check if structure filter is too strict, adjust swing length or timeframe
Q: Too many labels displayed?
A: Turn off "Show Labels" option in settings
Q: Poor backtest performance?
A:
1. Check if the coin is suitable for trend-following strategies
2. Adjust parameters (swing length, channel period)
3. Try different timeframes
Q: How to set alerts?
A:
1. Click "Alert" in top-right corner of chart
2. Condition: Select "Strategy - Trend Following CRYPTOCAP:ZEC "
3. Choose "Order filled"
4. Set notification method (Webhook/Email/App)
---
## 📞 Contact Information
Strategy Name: Trend Following CRYPTOCAP:ZEC
Version: v1.0
Pine Script Version: v6
Last Updated: December 2025
---
## 📄 Copyright Notice
This strategy is for educational and research purposes only.
All risks of using this strategy for live trading are borne by the user.
Commercial use without authorization is prohibited.
---
## 🎓 Learning Resources
To understand the strategy principles in depth, recommended reading:
- "The Complete TurtleTrader" - Curtis Faith
- "Trend Following" - Michael Covel
- TradingView Pine Script Official Documentation
---
Happy Trading! Remember to manage your risk 📈

Advanced Breakout System v2.0Advanced Breakout System v2.0
Developed by: Mohammed Bedaiwi
This script hunts for high-probability breakouts by combining price consolidation zones, volume spikes vs. average volume, smart money flow (OBV), and a Momentum Override for explosive moves that skip consolidation. Additionally, it automatically identifies and plots Support and Resistance levels with price labels to help you visualize market structure.
The system follows a "Watch & Confirm" logic: it first prints a WATCH setup, then a BUY only if price confirms strength.
💡 JUSTIFICATION OF CONCEPTS (MASHUP & ORIGINALITY)
This script is an original mashup combining several analytical concepts to address common breakout failures:
Volatility Compression Engine: Uses built-in functions like ta.highest() and ta.lowest() to mathematically define the setup phase where price volatility is compressed below a user-defined threshold.
Volume Spike Confirmation: The breakout must be confirmed by a volume increase greater than a moving average of volume, signaling strong market interest.
Smart Volume Filter (OBV): This is the key component. By checking if ta.obv is above its own Moving Average, we confirm that accumulation has been occurring during the consolidation period, suggesting institutional positioning before the price break.
Multi-Exit Risk System: Employs dynamic exits (EMA cross, volume dump, bearish pattern) instead of static stop-losses to manage risk adaptively based on real-time market action.
Market Structure Visualization: The script also includes a Support & Resistance engine to plot key swing pivots and price labels for visual context.
✅ STRATEGY RESULTS & POLICY COMPLIANCE
To ensure non-misleading and transparent backtesting results, this strategy is published with the following fully compliant properties:
Dataset Compliance: The backtest is performed on the CMTL Daily (1D) chart across a long history, generating 201 total trades. This significantly exceeds the minimum requirement of 100 trades, providing a robust test dataset.
Risk Control: The strategy uses a conservative order size set to 2% of equity (default_qty_value=2), strictly adhering to the sustainable risk recommendation of 5-10% of equity per trade.
Transaction Costs: Realistic trading conditions are modeled using 0.07% commission and 3 ticks slippage to prevent the overestimation of profitability.
⚙️ VISUAL GUIDE & SIGNAL LOGIC
Key Color Legend (Visual Guide):
WATCH – Setup (Yellow Arrow Down): Potential breakout setup detected.
BUY – Confirmation (Green Arrow Up): Confirmed breakout, triggered when price trades above the high of the WATCH candle.
SELL – Break (Orange Arrow): Short-term trend weakness, triggered when price closes below the Fast EMA (9).
SELL – Dump (Dark Red Arrow): Distribution / volume dump, triggered by a bearish candle with abnormally high volume.
SELL – Pattern (Purple Arrow): Bearish price-action pattern (such as a bearish engulfing).
Support & Resistance Lines (Red/Green): Small horizontal lines plotted at key swing points with exact price labels.
⌨️ INPUTS (DEFAULT SETTINGS)
Entry settings: Consolidation Lookback (default 20) = bars used to detect consolidation. Consolidation Range % (default 12%) = max allowed range size. Volume Spike Multiplier (default 1.2) = factor above average volume to count as a spike. Force Signal on Big Moves (default ON) = forces a WATCH signal on high-momentum moves.
Exit settings: Enable Fast Exit (EMA 9) toggles the SELL – Break signal. Dump Volume Multiplier defines what counts as “dump” volume.
Support & Resistance: Adjustable Pivot Left/Right bars control the sensitivity of the support and resistance lines.
⚠️ Disclaimer Trading involves significant risk of loss. This script is for educational and informational purposes only and is not financial advice or a recommendation to buy or sell any asset. BUY and SELL signals are rule-based and derived from historical behavior and do not guarantee future performance. Always use your own analysis and risk management. This is an open-source strategy; users are encouraged to test it across different symbols and timeframes.

BTC DCA Risk Metric StrategyBTC DCA Risk Strategy - Automated Dollar Cost Averaging with 3Commas Integration
Overview
This strategy combines the proven Oakley Wood Risk Metric with an intelligent tiered Dollar Cost Averaging (DCA) system, designed to help traders systematically accumulate Bitcoin during periods of low risk and take profits during high-risk conditions.
Key Features
📊 Multi-Component Risk Assessment
4-Year SMA Deviation: Measures Bitcoin's distance from its long-term mean
20-Week MA Analysis: Tracks medium-term momentum shifts
50-Day/50-Week MA Ratio: Captures short-to-medium term trend strength
All metrics are normalized by time to account for Bitcoin's maturing market dynamics
💰 3-Tier DCA Buy System
Level 1 (Low Risk): Conservative entry with base allocation
Level 2 (Lower Risk): Increased allocation as opportunity improves
Level 3 (Extreme Low Risk): Maximum allocation during rare buying opportunities
Buys execute every bar while risk remains below thresholds, enabling true DCA accumulation
📈 Progressive Profit Taking
Sell Level 1: Take initial profits as risk increases
Sell Level 2: Scale out further positions during elevated risk
Sell Level 3: Final exit during extreme market conditions
Sell levels automatically reset when new buy signals occur, allowing flexible re-entry
🤖 3Commas Integration
Fully automated webhook alerts for Custom Signal Bots
JSON payloads formatted per 3Commas API specifications
Supports multiple exchanges (Binance, Coinbase, Kraken, Gemini, Bybit)
Configurable quote currency (USD, USDT, BUSD)
How It Works
The strategy calculates a composite risk metric (0-1 scale):
0.0-0.2: Extreme buying opportunity (green zone)
0.2-0.5: Favorable accumulation range (yellow zone)
0.5-0.8: Neutral to cautious territory (orange zone)
0.8-1.0+: High risk, profit-taking zone (red zone)
Buy Logic: As risk decreases, position sizes increase automatically. If risk drops from L1 to L3 threshold, the strategy combines all three tier allocations for maximum exposure.
Sell Logic: Sequential profit-taking ensures you capture gains progressively. The system won't advance to Sell L2 until L1 completes, preventing premature full exits.
Configuration
Risk Metric Parameters:
All calculations use Bitcoin price data (any BTC chart works)
Time-normalized formulas adapt to market maturity
No manual parameter tuning required
Buy Settings:
Set risk thresholds for each tier (default: 0.20, 0.10, 0.00)
Define dollar amounts per tier (default: $10, $15, $20)
Fully customizable to your risk tolerance and capital
Sell Settings:
Configure risk thresholds for profit-taking (default: 1.00, 1.50, 2.00)
Set percentage of position to sell at each level (default: 25%, 35%, 40%)
3Commas Setup:
Create a Custom Signal Bot in 3Commas
Copy Bot UUID and Secret Token into strategy inputs
Enable 3Commas Alerts checkbox
Create TradingView alert: Condition → "alert() function calls only", Webhook → api.3commas.io
Backtesting Results
Strengths:
Systematically buys dips without emotion
Averages down during extended bear markets
Captures explosive bull run profits through tiered exits
Pyramiding (1000 max orders) allows true DCA behavior
Considerations:
Requires sufficient capital for multiple buys during prolonged downtrends
Backtest on Daily timeframe for most reliable signals
Past performance does not guarantee future results
Visual Design
The indicator pane displays:
Color-coded risk metric line: Changes from white→red→orange→yellow→green as risk decreases
Background zones: Green (buy), yellow (hold), red (sell) areas
Dashed threshold lines: Clear visual markers for each buy/sell level
Entry/Exit labels: Green buy labels and orange/red sell labels mark all trades
Credits
Original Risk Metric: Oakley Wood
Strategy Development & 3Commas Integration: Claude AI (Anthropic)
Modifications: pommesUNDwurst
Disclaimer
This strategy is for educational and informational purposes only. Cryptocurrency trading carries substantial risk of loss. Always conduct your own research and never invest more than you can afford to lose. The authors are not financial advisors and assume no responsibility for trading decisions made using this tool.

MA Strategy: Dual Entry FilterConfigurable MA Dual-Filter Strategy
This strategy is an enhanced and highly configurable Moving Average (MA) Crossover system designed to mitigate false signals and align trades with the prevailing market trend. It is built to offer traders granular control over entry criteria, elevating it beyond basic, built-in MA crossover indicators.
Originality & Key Features
The script's originality and utility lie in the combination of its two primary, optional filtering mechanics:
Dual Entry Mode (Key Filter): Users can choose between two distinct methods for trade entry:
Crossover (Classic): Immediate entry when the price crosses the main MA.
Full Candle Confirmation (Unique Feature): This mode requires the entire candle body (open, high, low, and close) to be completely above or below the main MA after a crossover event to confirm the signal before entry. This strict confirmation helps to filter out weak crossovers, reducing whipsaws in choppy markets.
Optional Trend Filter: A second, slower MA (Trend Filter MA) can be activated. Trades are only permitted when the faster main MA is aligned with the slower Trend MA (i.e., long only if main MA > Trend MA), ensuring trades are executed with the established higher-timeframe direction.
How to Use the Strategy
The strategy logic is built on simple MA principles but utilizes Pine Script's switch function to allow users to select from six different MA types for both the main signal and the trend filter: SMA, EMA, WMA, HMA, VWMA, and RMA.
Core Logic:
Signal: A cross of the price over the Main MA (filtered by the chosen Entry Mode).
Directional Filter: The Trend Filter must confirm the direction (if enabled).
Exit: Trades are exited on the opposite price crossover of the Main MA.
Customizable Settings Include:
Main MA Type & Length (Default: 40 EMA): The primary signal generator.
Trend Filter MA Type & Length (Default: 70 EMA): The optional, slower trend bias.
Entry Mode: Switch between Crossover or Full Candle Confirmation.
Strategy Results and High-Risk Disclaimer
The default setting for trade size is set to 40% of equity for backtesting demonstration purposes only. This high value is used to generate a large and diverse sample size of trades for historical review on the chart.
This 40% value is NOT a recommended setting for live trading. Per TradingView guidelines, traders are strongly advised to change this input to a sustainable risk level, typically 5% to 10% of equity per trade. Past performance is not a guarantee of future results.

ChronoPulse MS-MACD Resonance StrategyChronoPulse MS-MACD Resonance Strategy
A systematic trading strategy that combines higher-timeframe market structure analysis with dual MACD momentum confirmation, ATR-based risk management, and real-time quality assurance monitoring.
Core Principles
The strategy operates on the principle of multi-timeframe confluence, requiring agreement between:
Market structure breaks (CHOCH/BOS) on a higher timeframe
Dual MACD momentum confirmation (classic and crypto-tuned profiles)
Trend alignment via directional EMAs
Volatility and volume filters
Quality score composite threshold
Strategy Components
Market Structure Engine : Detects Break of Structure (BOS) and Change of Character (CHOCH) events using confirmed pivots on a configurable higher timeframe. Default structure timeframe is 240 minutes (4H).
Dual MACD Fusion : Requires agreement between two MACD configurations:
Classic MACD: 12/26/9 (default)
Fusion MACD: 8/21/5 (default, optimized for crypto volatility)
Both must agree on direction before trade execution. This can be disabled to use single MACD confirmation.
Trend Alignment : Uses two EMAs for directional bias:
Directional EMA: 55 periods (default)
Execution Trend Guide: 34 periods (default)
Both must align with trade direction.
ATR Risk Management : All risk parameters are expressed in ATR multiples:
Stop Loss: 1.5 × ATR (default)
Take Profit: 3.0 × ATR (default)
Trail Activation: 1.0 × ATR profit required (default)
Trail Distance: 1.5 × ATR behind price (default)
Volume Surge Filter : Optional gate requiring current volume to exceed a multiple of the volume SMA. Default threshold is 1.4× the 20-period volume SMA.
Quality Score Gate : Composite score (0-1) combining:
Structure alignment (0.0-1.0)
Momentum strength (0.0-1.0)
Trend alignment (0.0-1.0)
ATR volatility score (0.0-1.0)
Volume intensity (0.0-1.0)
Default threshold: 0.62. Trades only execute when quality score exceeds this threshold.
Execution Discipline : Trade budgeting system:
Maximum trades per session: 6 (default)
Cooldown bars between entries: 5 (default)
Quality Assurance Console : Real-time monitoring panel displaying:
Structure status (pass/fail)
Momentum confirmation (pass/fail)
Volatility readiness (pass/fail)
Quality score (pass/fail)
Discipline compliance (pass/fail)
Performance metrics (win rate, profit factor)
Net PnL
Certification requires: Win Rate ≥ 40%, Profit Factor ≥ 1.4, Minimum 25 closed trades, and positive net profit.
Integrity Suite : Optional validation panel that audits:
Configuration sanity checks
ATR data readiness
EMA hierarchy validity
Performance realism checks
Strategy Settings
strategy(
title="ChronoPulse MS-MACD Resonance Strategy",
shorttitle="ChronPulse",
overlay=true,
max_labels_count=500,
max_lines_count=500,
initial_capital=100000,
currency=currency.USD,
pyramiding=0,
commission_type=strategy.commission.percent,
commission_value=0.015,
slippage=2,
default_qty_type=strategy.percent_of_equity,
default_qty_value=2.0,
calc_on_order_fills=true,
calc_on_every_tick=true,
process_orders_on_close=true
)
Key Input Parameters
Structure Timeframe : 240 (4H) - Higher timeframe for structure analysis
Structure Pivot Left/Right : 3/3 - Pivot confirmation periods
Structure Break Buffer : 0.15% - Buffer for structure break confirmation
MACD Fast/Slow/Signal : 12/26/9 - Classic MACD parameters
Fusion MACD Fast/Slow/Signal : 8/21/5 - Crypto-tuned MACD parameters
Directional EMA Length : 55 - Primary trend filter
Execution Trend Guide : 34 - Secondary trend filter
ATR Length : 14 - ATR calculation period
ATR Stop Multiplier : 1.5 - Stop loss in ATR units
ATR Target Multiplier : 3.0 - Take profit in ATR units
Trail Activation : 1.0 ATR - Profit required before trailing
Trail Distance : 1.5 ATR - Distance behind price
Volume Threshold : 1.4× - Volume surge multiplier
Quality Threshold : 0.62 - Minimum quality score (0-1)
Max Trades Per Session : 6 - Daily trade limit
Cooldown Bars : 5 - Bars between entries
Win-Rate Target : 40% - Minimum for QA certification
Profit Factor Target : 1.4 - Minimum for QA certification
Minimum Trades for QA : 25 - Required closed trades
Signal Generation Logic
A trade signal is generated when ALL of the following conditions are met:
Higher timeframe structure shows bullish (CHOCH/BOS) or bearish structure break
Both MACD profiles agree on direction (if fusion enabled)
Price is above both EMAs for longs (below for shorts)
ATR data is ready and above minimum threshold
Volume exceeds threshold × SMA (if volume gate enabled)
Quality score ≥ quality threshold
Trade budget available (under max trades per day)
Cooldown period satisfied
Risk Management
Stop loss and take profit are set immediately on entry
Trailing stop activates after 1.0 ATR of profit
Trailing stop maintains 1.5 ATR distance behind highest profit point
Position sizing uses 2% of equity per trade (default)
No pyramiding (single position per direction)
Limitations and Considerations
The strategy requires sufficient historical data for higher timeframe structure analysis
Quality gate may filter out many potential trades, reducing trade frequency
Performance metrics are based on historical backtesting and do not guarantee future results
Commission and slippage assumptions (0.015% + 2 ticks) may vary by broker
The strategy is optimized for trending markets with clear structure breaks
Choppy or ranging markets may produce false signals
Crypto markets may require different parameter tuning than traditional assets
Optimization Notes
The strategy includes several parameters that can be tuned for different market conditions:
Quality Threshold : Lower values (0.50-0.60) allow more trades but may reduce average quality. Higher values (0.70+) are more selective but may miss opportunities.
Structure Timeframe : Use 240 (4H) for intraday trading, Daily for swing trading, Weekly for position trading
Volume Gate : Disable for low-liquidity pairs or when volume data is unreliable
Dual MACD Fusion : Disable for mean-reverting markets where single MACD may be more responsive
Trade Discipline : Adjust max trades and cooldown based on your risk tolerance and market volatility
Non-Repainting Guarantee
All higher timeframe data requests use lookahead=barmerge.lookahead_off to prevent repainting. Pivot detection waits for full confirmation before registering structure breaks. All visual elements (tables, labels) update only on closed bars.
Alerts
Three alert conditions are available:
ChronoPulse Long Setup : Fires when all long entry conditions are met
ChronoPulse Short Setup : Fires when all short entry conditions are met
ChronoPulse QA Certification : Fires when Quality Assurance console reaches CERTIFIED status
Configure alerts with "Once Per Bar Close" delivery to match the non-repainting design.
Visual Elements
Structure Labels : CHOCH↑, CHOCH↓, BOS↑, BOS↓ markers on structure breaks
Directional EMA : Orange line showing trend bias
Trailing Stop Lines : Green (long) and red (short) trailing stop levels
Dashboard Panel : Real-time status display (structure, MACD, ATR, quality, PnL)
QA Console : Quality assurance monitoring panel
Integrity Suite Panel : Optional validation status display
Recommended Usage
Forward test with paper trading before live deployment
Monitor the QA console until it reaches CERTIFIED status
Adjust parameters based on your specific market and timeframe
Respect the trade discipline limits to avoid over-trading
Review quality scores and adjust threshold if needed
Use appropriate commission and slippage settings for your broker
Technical Implementation
The strategy uses Pine Script v6 with the following key features:
Multi-timeframe data requests with lookahead protection
Confirmed pivot detection for structure analysis
Dynamic trailing stop management
Real-time quality score calculation
Trade budgeting and cooldown enforcement
Comprehensive dashboard and monitoring panels
All source code is open and available for review and modification.
Disclaimer
This script is for educational and informational purposes only. It is not intended as financial, investment, or trading advice. Past performance does not guarantee future results. Trading involves substantial risk of loss and is not suitable for all investors. Always conduct your own research and consult with a qualified financial advisor before making any trading decisions. The author and TradingView are not responsible for any losses incurred from using this strategy.

ATR ZigZag BreakoutATR ZigZag Breakout
This strategy uses my ATR ZigZag indicator (powered by the ZigZagCore library) to scalp breakouts at volatility-filtered highs and lows.
Everyone knows stops cluster around clear swing highs and lows. Breakout traders often pile in there, too. These levels are predictable areas where aggressive orders hit the tape. The idea here is simple:
→ Let ATR ZigZag define clean, volatility-filtered pivots
→ Arm a stop market order at those pivots
→ Join the breakout when the crowd hits the level
The key to greater success in this simple strategy lies in the ZigZag. Because the pivots are filtered by ATR instead of fixed bar counts or fractals, the levels tend to be more meaningful and less noisy.
This approach is especially suited for intraday trading on volatile instruments (e.g., NQ, GC, liquid crypto pairs).
How It Works
1. Pivot detection
The ATR ZigZag uses an ATR-based threshold to confirm swing highs and lows. Only when price has moved far enough in the opposite direction does a pivot become “official.”
2. Candidate breakout level
When a new swing direction is detected and the most recent high/low has not yet been broken in the current leg, the strategy arms a stop market order at that pivot.
• Long candidate → most recent swing high
• Short candidate → most recent swing low
These “candidate trades” are shown as dotted lines.
3. Entry, SL, and TP
If price breaks through the level, the stop order is filled and a bracket is placed:
• Stop loss = ATR × SL multiplier
• Take profit = SL distance × RR multiplier
Once a level has traded, it is not reused in the same swing leg.
4. Cancel & rotate
If the market reverses and forms a new swing in the opposite direction before the level is hit, the pending order is cancelled and a new candidate is considered in the new direction.
Additional Features
• Optional session filter for backtesting specific trading hours

Hyper Insight MA Strategy [Universal]Hyper Insight MA Strategy ** is a comprehensive trend-following engine designed for traders who require precision and flexibility. Unlike standard indicators that lock you into a single calculation method, this strategy serves as a "Universal Adapter," allowing you to **Mix & Match 13 different Moving Average types** for both the Fast and Slow trend lines independently.
Whether you need the smoothness of T3, the responsiveness of HMA, or the classic reliability of SMA, this script enables you to backtest thousands of combinations to find the perfect edge for your specific asset class.
---
🔬 Deep Dive: Calculation Logic of Included MAs
This strategy includes 13 distinct calculation methods. Understanding the math behind them will help you choose the right tool for your specific market conditions.
#### 1. Standard Averages
* **SMA (Simple Moving Average):** The unweighted mean of the previous $n$ data points.
* *Logic:* Treats every price point in the period with equal importance. Good for identifying long-term macro trends but reacts slowly to recent volatility.
* **WMA (Weighted Moving Average):** A linear weighted average.
* *Logic:* Assigns heavier weight to current data linearly (e.g., $1, 2, 3... n$). It reacts faster than SMA but is still relatively smooth.
* **SWMA (Symmetrically Weighted Moving Average):**
* *Logic:* Uses a fixed-length window (usually 4 bars) with symmetrical weights $ $. It prioritizes the center of the recent data window.
#### 2. Exponential & Lag-Reducing Averages
* **EMA (Exponential Moving Average):**
* *Logic:* Applies an exponential decay weighting factor. Recent prices have significantly more impact on the average than older prices, reducing lag compared to SMA.
* **RMA (Running Moving Average):** Also known as Wilder's Smoothing (used in RSI).
* *Logic:* It is essentially an EMA but with a slower alpha weight of $1/length$. It provides a very smooth, stable line that filters out noise effectively.
* **DEMA (Double Exponential Moving Average):**
* *Logic:* Calculated as $2 \times EMA - EMA(EMA)$. By subtracting the "lag" (the smoothed EMA) from the original EMA, DEMA provides a much faster reaction to price changes with less noise than a standard EMA.
* **TEMA (Triple Exponential Moving Average):**
* *Logic:* Calculated as $3 \times EMA - 3 \times EMA(EMA) + EMA(EMA(EMA))$. This effectively eliminates the lag inherent in single and double EMAs, making it an extremely fast-tracking indicator for scalping.
#### 3. Advanced & Adaptive Averages
* **HMA (Hull Moving Average):**
* *Logic:* A composite formula involving Weighted Moving Averages: ASX:WMA (2 \times Integer(n/2)) - WMA(n)$. The result is then smoothed by a $\sqrt{n}$ WMA.
* *Effect:* It eliminates lag almost entirely while managing to improve curve smoothness, solving the traditional trade-off between speed and noise.
* **ZLEMA (Zero Lag Exponential Moving Average):**
* *Logic:* This calculation attempts to remove lag by modifying the data source before smoothing. It calculates a "lag" value $(length-1)/2$ and applies an EMA to the data: $Source + (Source - Source )$. This creates a projection effect that tracks price tightly.
* **T3 (Tillson T3 Moving Average):**
* *Logic:* A complex smoothing technique that runs an EMA through a filter multiple times using a "Volume Factor" (set to 0.7 in this script).
* *Effect:* It produces a curve that is incredibly smooth and free of "overshoot," making it excellent for filtering out market chop.
* **ALMA (Arnaud Legoux Moving Average):**
* *Logic:* Uses a Gaussian distribution (bell curve) to assign weights. It allows the user to offset the moving average (moving the peak of the weight) to align it perfectly with the price, balancing smoothness and responsiveness.
* **LSMA (Least Squares Moving Average):**
* *Logic:* Calculates the endpoint of a Linear Regression line for the lookback period. It essentially guesses where the price "should" be based on the best-fit line of the recent trend.
* **VWMA (Volume Weighted Moving Average):**
* *Logic:* Weights the closing price by the volume of that bar.
* *Effect:* Prices on high volume days pull the MA harder than prices on low volume days. This is excellent for validating true trend strength (i.e., a breakout on high volume will move the VWMA significantly).
---
### 🛠 Features & Settings
* **Universal Switching:** Change the `Fast MA` and `Slow MA` types instantly via the settings menu.
* **Trend Cloud:** A dynamic background fill (Green/Red) highlights the crossover zone for immediate visual trend identification.
* **Strategy Mode:** Built-in Backtesting logic triggers `LONG` entries when Fast MA crosses over Slow MA, and `EXIT` when Fast MA crosses under.
### ⚠️ Disclaimer
This script is intended for educational and research purposes. The wide variety of MA combinations can produce vastly different results. Past performance is not indicative of future results. Please use proper risk management.

Long Only EMA Strategy (9/20 with 200 EMA Filter)Details:
This strategy is built around a very simple idea: follow the primary trend and enter only when momentum supports it.
It uses three EMAs on a standard candlestick chart:
1. 9‑period EMA – short‑term momentum
2. 20‑period EMA – medium‑term structure
3. 200‑period EMA – long‑term trend filter
The strategy is ** long‑only ** and is mainly designed for swing trading and positional trading.
It avoids counter‑trend trades by taking entries only when price is trading ** above the 200 EMA **, which is commonly used as a long‑term trend reference.
The rules are deliberately kept simple so that they are easy to understand, modify, and test on different markets and timeframes.
---
Key Features
1. **Trend‑Filtered Entries**
- Fresh long positions are considered only when:
- The 9 EMA crosses above the 20 EMA
- The closing price is **above** the 200 EMA
- This attempts to combine short‑term momentum with a higher‑timeframe trend filter.
2. **Clean Exit Logic**
- The long position is exited when the closing price crosses **below** the 20 EMA.
- This creates an objective, rule‑based way to trail the trade as long as the medium‑term structure remains intact.
3. **Long‑Only, No Short Selling**
- The script intentionally ignores short setups.
- This makes it suitable for markets or accounts where short selling is restricted, or for traders who prefer to participate only on the long side of the market.
4. **Simple Visuals**
- All three EMAs are plotted directly on the chart:
- 9 EMA (fast)
- 20 EMA (medium)
- 200 EMA (trend)
- Trade entries and exits are handled by TradingView’s strategy engine, so users can see results in the Strategy Tester as well as directly on the chart.
5. **Backtest‑Friendly Structure**
- Uses TradingView’s built‑in `strategy()` framework.
- Can be applied to different symbols, timeframes, and markets (equities, indices, crypto, etc.).
- Works on standard candlestick charts, which are supported by TradingView’s backtesting engine.
6. **Configurable in Code**
- The EMA periods are defined in the code and can be easily adjusted.
- Users can tailor the parameters to fit their own style (for example, faster EMAs for intraday trading, slower EMAs for positional trades).
---
How to Use
1. **Add the Strategy to Your Chart**
1. Open any symbol and select a **standard candlestick chart**.
2. Apply the strategy from your “My Scripts” section.
3. Make sure it is enabled so that the trades and results appear.
2. **Select Timeframe**
- The logic can be tested on various timeframes:
- Higher timeframes (1H, 4H, 1D) for swing and positional setups.
- Lower timeframes (5m, 15m) for more active trading, if desired.
- Users should experiment and see where the strategy behaves more consistently for their chosen market.
3. **Read the Signals**
- **Entry:**
- A long trade is opened when the 9 EMA crosses above the 20 EMA while the closing price is above the 200 EMA.
- **Exit:**
- The open long position is closed when the closing price crosses below the 20 EMA.
- All orders are generated automatically once the strategy is attached to the chart.
4. **Use the Strategy Tester**
- Go to the **Strategy Tester** tab in TradingView.
- Check:
- Net profit / drawdown
- Win rate and average trade
- List of trades and the equity curve
- Change the date range and timeframe to see how stable the results are over different periods.
5. **Adjust Parameters if Needed**
- Advanced users can open the code and experiment with:
- EMA lengths (for example 8/21 with 200, or 10/30 with 200)
- Risk sizing and capital settings within the `strategy()` call
- Any changes should be thoroughly re‑tested before considering real‑world application.
---
Practical Applications
1. **Swing Trading on Daily Charts**
- Can be applied to stocks, indices, or ETFs on the daily timeframe.
- The 200 EMA acts as a trend filter to stay aligned with the broad direction, while the 9/20 crossover helps catch medium‑term swings inside that trend.
2. **Positional Trades on Higher Timeframes**
- On 4H or 1D charts, this approach can help in holding trades for several days to weeks.
- The exit rule based on the 20 EMA crossing helps avoid emotional decisions and provides a rules‑based way to trail the trend.
3. **Trend‑Following Filter**
- Even if used purely as a filter, the 200 EMA condition can help traders:
- Avoid taking long trades when the market is in a clear downtrend.
- Focus only on instruments that are trading above their long‑term average.
4. **Educational Use**
- The script is intentionally kept straightforward so that newer users can:
- Learn how a moving average crossover strategy works.
- See how to combine a short‑term signal with a long‑term filter.
- Understand how TradingView’s strategy engine handles entries and exits.
5. **Basis for Further Development**
- This can serve as a starting point for more advanced systems.
- Traders can extend it by adding:
- Additional filters (RSI, volume, volatility filters, time‑of‑day filters, etc.)
- Risk management rules (fixed stop loss, take profit, trailing stops).
- The current version is kept minimal on purpose, so modifications are easy to implement and test.
---
Important Notes & Disclaimer
1. This strategy is provided **for testing, research, and educational purposes only**.
2. It is ** not ** a recommendation to buy or sell any financial instrument.
3. Past performance on historical data does not guarantee similar results in live markets.
4. Markets are risky and trading can lead to financial loss; users should always do their own research, manage risk appropriately, and consult a qualified financial professional if needed.
5. Before using any strategy with real capital, it is strongly advised to:
- Forward test it on a demo / paper trading account.
- Check how it behaves during different market phases (trending, sideways, high‑volatility conditions).
You are free to modify the parameters and logic to better align it with your own trading style and risk tolerance.
