Cyatophilum SuperTrend [BACKTEST]The SuperTrend Indicator and Strategy built upon Average True Range.
- Backtest Version -
>> READ HOW TO USE HERE <<
Buscar en scripts para "backtest"

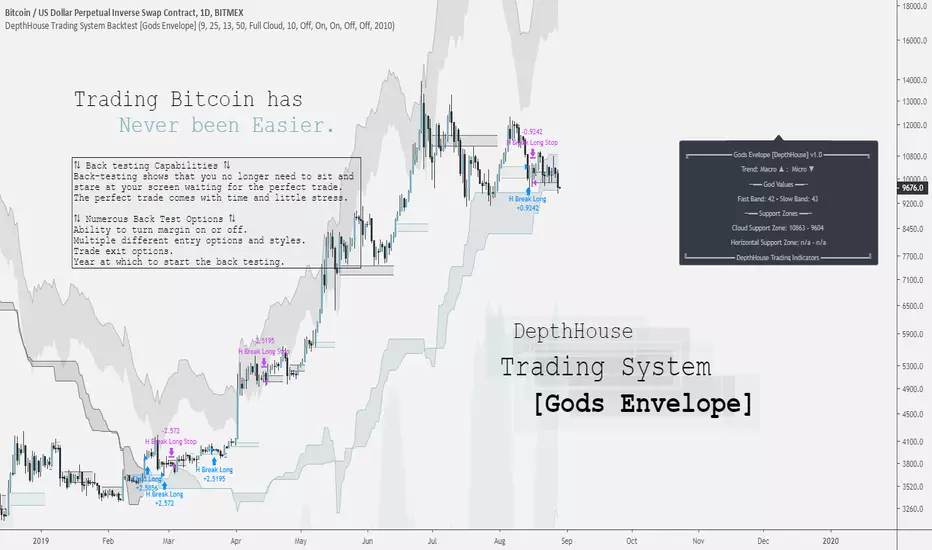
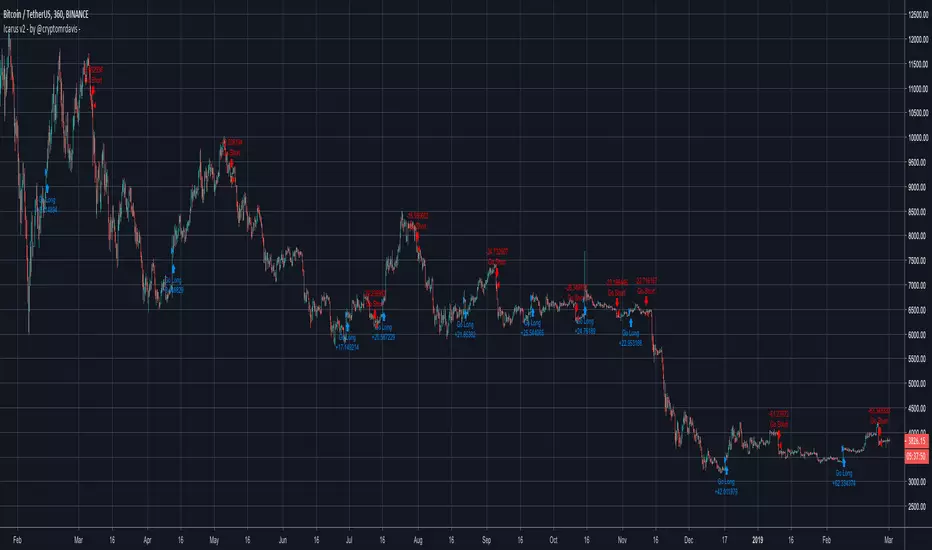
DepthHouse Trading System [Gods Envelope] Backtest StrategyCreated for Bitcoin!
*All testing has been done on the 1 Day time frame of BTC USD pairs.
Use at your own risk.
DepthHouse Trading System Basics
The Cloud:
The cloud is used in a very similar manner as the ichimoku cloud. A complete cross above or below the represents a macro trend change. The cloud then could be used as dynamic support and resistance zones.
By default there is no smoothing to the full cloud. If you wish to add smoothing, you can change the ‘Trend Base On’ option to ‘Modded Cloud Average’ to add price action and smoothing into the cloud’s calculations. The Modded Cloud can then be used in the same manner as the Full Cloud. Generally, the Full Cloud is more forgiving and has less Macro Trend changes. By default, this option is turned off. The support or resistance zone created will be shown on the info panel on the right.
Horizontal Levels:
A Horizonal zone is generated each time there is a micro level trend change. For example, as soon as a positive micro trend change occurs a green horizontal level will be plotted.
These levels then can be used as temporary support and resistance zones. The Horizontal Break Trading Strategy is entirely based on these levels. These levels are also shown on the info panel on the right.
The Envelope Itself: (by default this is off)
By selecting the Overbought and Oversold Ranges option, a cloud envelope will appear around the price action. This envelope represents the overbought and oversold ranges. If the price action should go into these zones, the info panel on the right will show ‘CAUTION’ beside the God Values as this signals that the pair is either overbought or oversold.
The God Values:
The God values are listed on the info panel on the right. These are the values created by the Godmode indicator. Generally, below 20 or above 80 it signals for caution as the price action has overextended itself.
The Back-Test Strategy Options:
⇅ - Child Fomo Positioning:
Child Fomo Positioning strategy is entirely based on the macro trend change with the center cloud. As soon as there is a complete candle close above or below the cloud and a trend change takes place. The back-test places a market order as soon as the next candle opens. By default, it then will not close this position until the price action fully crosses the cloud once again.
⇅ - Horizontal Break Trading:
Horizontal Break Trading Strategy is entirely based on the horizontal levels generated and the macro trend direction. For example, say the Macro Trend is up, and a green, positive horizontal level is formed. As soon as a complete candle closes above the upper level of the positive zone, a limit order is placed in hope that the price action comes back down and retests, filling the order. This long will not close then until a negative level is formed. As soon as a negative level is formed a stop/loss order is placed on the lower level of the horizontal support zone. It will then do the opposite in a bearish trend, and margin trading is turned on.
⇅ - Parent Positions :
Parent Positioning Strategy is based on the overall trend and the center cloud levels. This strategy has limit orders waiting on the level of the cloud that is closest to the price action. Therefore, using this strategy alone, the back-test system waits for the trend to be confirmed, and then follows the price action with limit orders waiting on the cloud to be retested. By default this order does not close until a Marco trend change occurs.
⇅ - Take 50% Partial Profits:
This options allows the back-test to take 50% profit or loss when one of the two options occur.
Horizontal Break: This would close 50% of the position in the same manner it would close a trade using the horizontal break trading system.
God Values: Once the price action enters the oversold or overbought clouds, it would then place a close order as soon as the price action exits the cloud.
⟲ - Backtest Year Start Date :
Start year of the back-testing. If set to ex. 2017, the back-test will not calculate any trades that took place before Jan. 1 of 2017.
⚖ - Margin Trading :
By default, margin trading is turned off. Simply switch this option to on the enable ‘Short Trading’ into the strategy back-test.
Notes: If you are back testing multiple strategies at the same time, you must increase the pyramiding to correspond to the number or strategies.
My Favorite Settings:
Margin = Off
Pyramiding = 2 [Settings → Properties → Pyramiding → 2 orders
Child Fomo Positioning = On
Horizontal Break Trading = On
Everything else off 😊
DISCLAIMER: Past performance does not guarantee future results.
Use at your own risk.
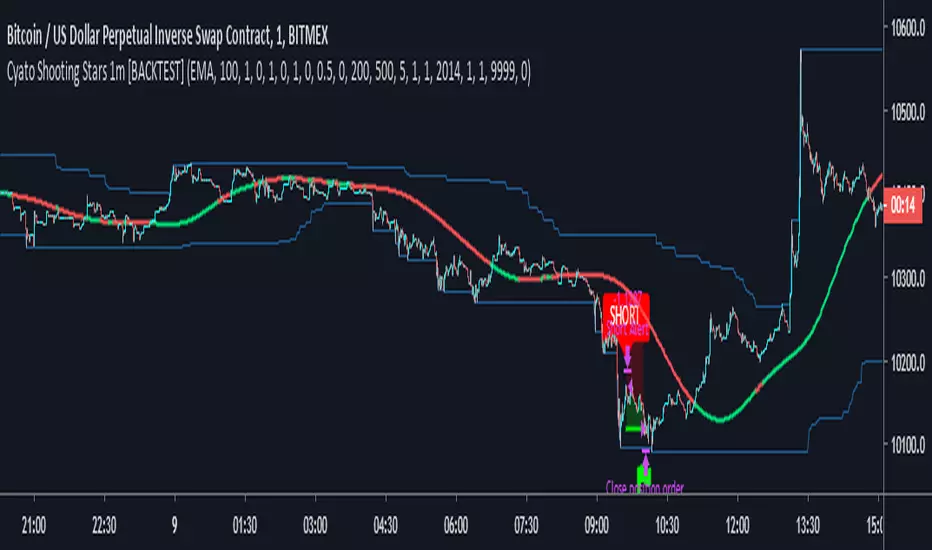
Cyatophilum Shooting Stars 1m [BACKTEST]A Scalping Script for the 1m Timeframe, using the cheesy candle pattern "Shooting Stars" plus some Trend Detection, Stop Loss and Take Profit integrated system, allowing these nice backtest results.
Currently in continuous development / real time testing on BitMEX data.
RePaNoCHa V4 [Backtest]This is the Backtest version of the previous one.
It's important to correctly set the "TICKS / PIPS CORRECTION" parameter in each different chart.
Enjoy!

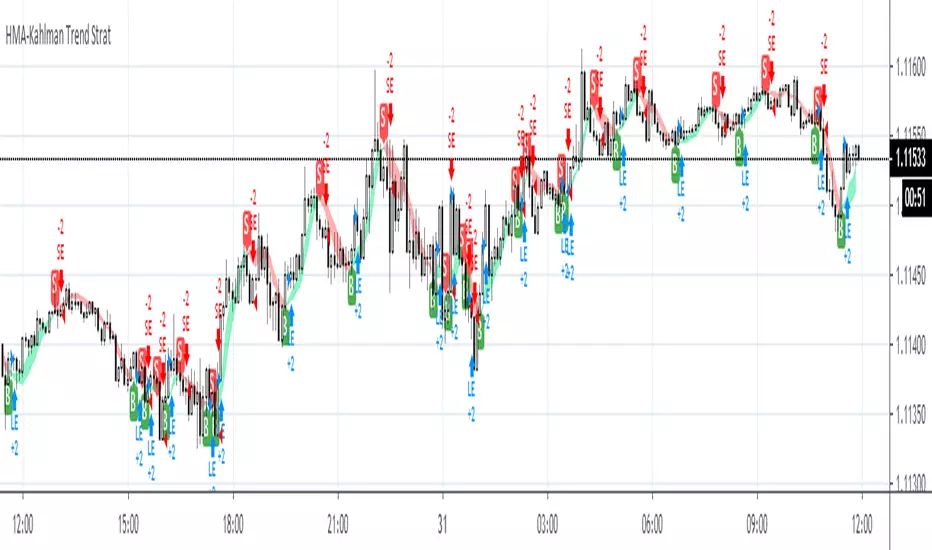
Hull Trend with Kahlman Strategy BacktestA simple backtest version of a Hull Trend with Kahlman strategy
Smeared VCI BacktestThis is the strategy with backtest date range and trailing-stop / stop-loss for vitelot's Smeared VCI indicator:

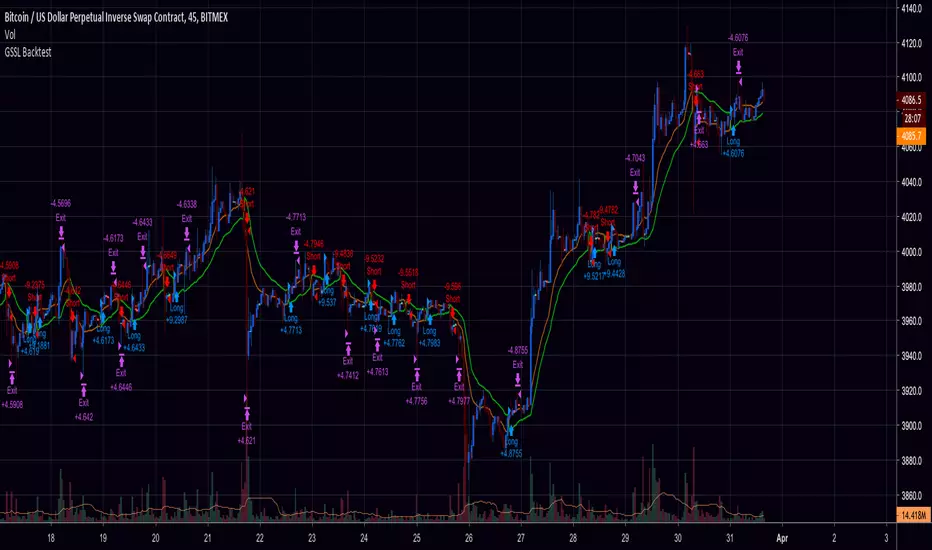
Generalized SSL Backtest w/ TSSLStrategy with Backtest Date Range and Trailing-Stop / Stop-Loss for vitelot's indicator:
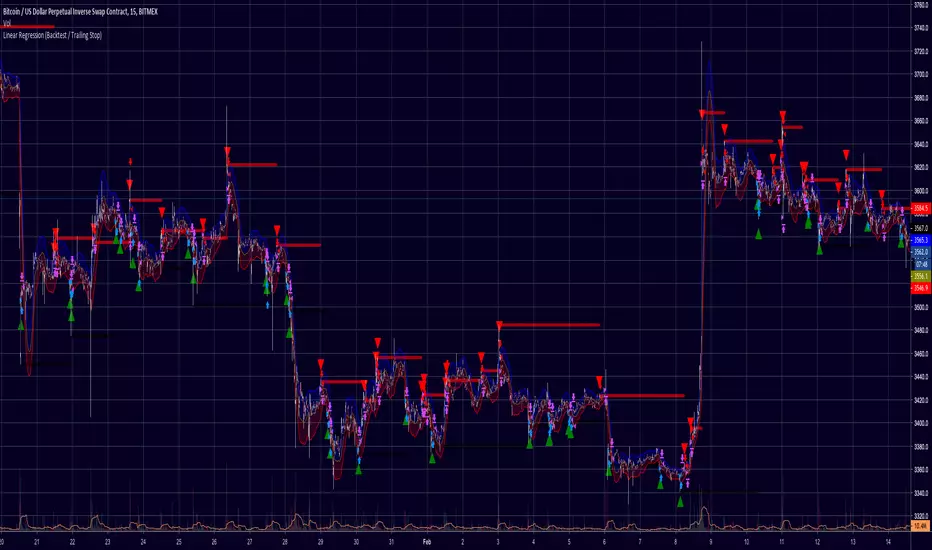
Linear Regression (Backtest / Trailing Stop)A Strategy with Backtest and Trailing Stop for Long/Short
Credits: Study by RafaelZioni - Thanks buddy!
Fisher Transform Multi-Timeframe (Backtest)This is the Backtest Strategy for mortdiggiddy's "Fisher Transform Multi-Timeframe"
For more details check his study:

Cyatophilum Ichimoku Oscillator [BACKTEST][STRATEGY]An Automated Strategy based on Ichimoku Cloud. Works on any timeframe and market.
Backtest is done using the largest period TradingView has to offer for 1H. Net profit is calculated using the Strategy Tester, with only long entries at Green triangles and exits at red triangles. Profit can be greater if you short Sell signals (red triangles). Commission used is 0.05%.
This strategy is on my website. You can get access if you purchase the Cyatophilum Indicators. blockchainfiesta.com
The Alert Setup version is here :
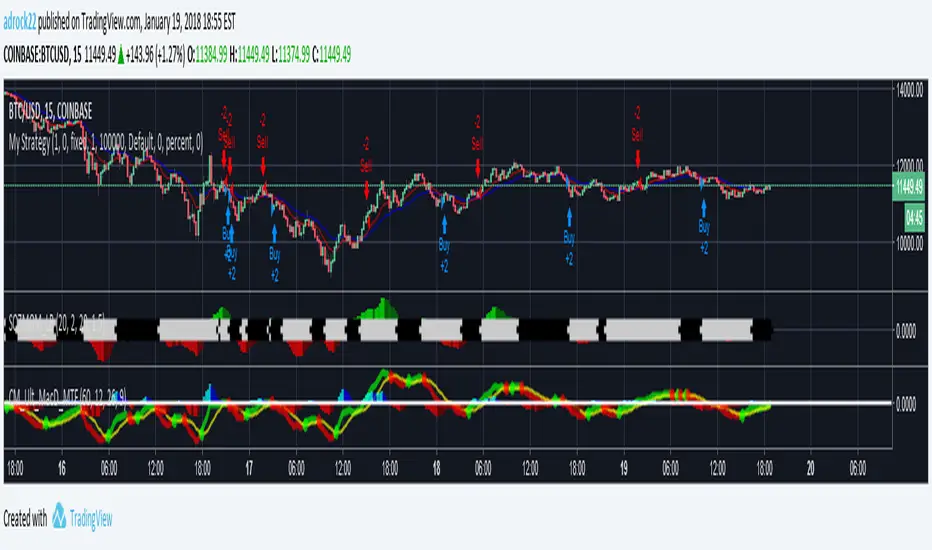
Default Strategy Inputs (Forex / Crypto)The code in this post contains a set of default strategy inputs I use in new projects / backtests in Tradingview.
Full code commentary is available on the Backtest-Rookies website. To comply with house rules, I cannot post the direct link here.
Features
Trade Direction: So that you can limit the strategy for long only, short only or trade in both directions. It is important to note that when you select “Long Only”, you will still see Short signals on the chart. However, they are only used to close a position rather than reverse it. This is the default behaviour for strategies. The same applies to “Short Only”.
Date Ranges: So that you can isolate backtesting to specific periods of interest such as bull or bear markets.
Sessions: So you can easily get an idea of the expected results during your own session. You may also notice that performance of the strategy varies depending on which session it is deployed in.
Some example stop losses: It is not an exhaustive list but it should be enough to provide some inspiration for different types of stops that you can experiment with.
Happy Scripting. I hope the community finds it useful.
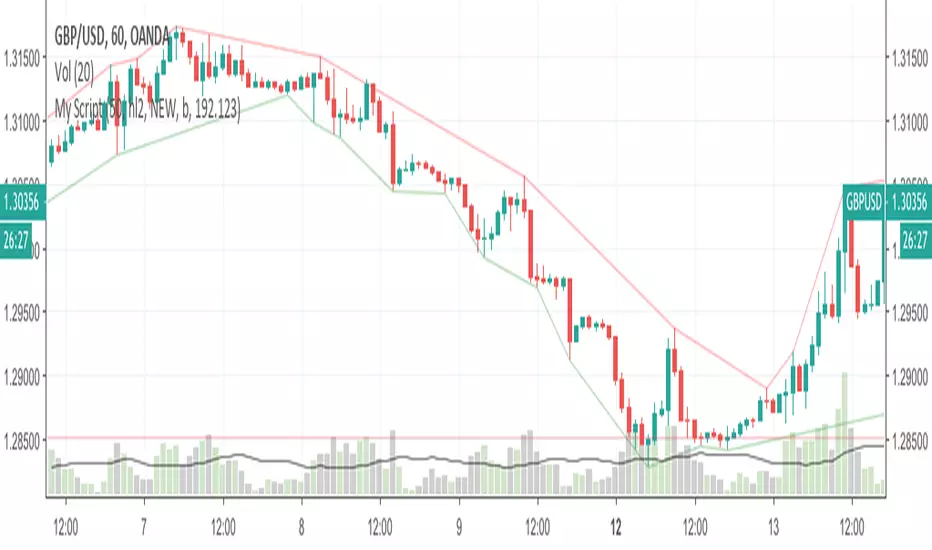
Parabolic SAR StrategyParabolic SAR strategy with a couple of extra features. Developed as a professional service and published for customer verification/approval.
Please visit the backtest-rookies (.com) website if you are interested in development services
Features
Parabolic SAR stop entry strategy.
Backtesting Ranges and dates for testing over specific regimes/periods
Long only or dual direction inputs

Setting XScript Published for a Backtest-Rookies services customer. It has been published only for testing and acceptance. Access cannot be granted.
For community members who are interested in custom development services, please visit the backtest-rookies.com website
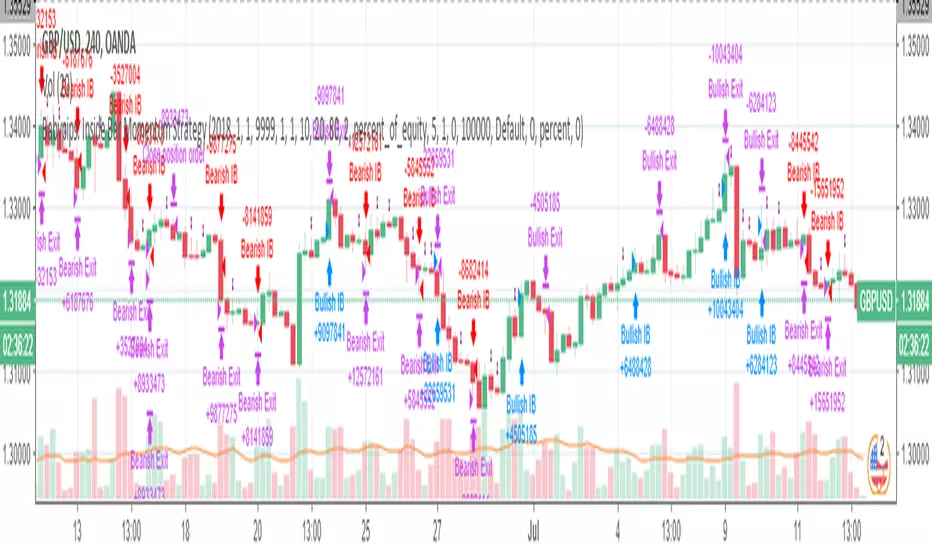
Babypips: Inside Bar Momentum StrategyThe strategy contained in this post comes courtesy of babypips (.com), an excellent resource for all thing forex related. If you are new to trading, the site is definitely worth checking out!
Code commentary and an introduction to Inside Bars are available for this post on the Backtest-Rookies (.com) website.
Note: If you are interested in custom development services, please check out our services page on the Backtest-Rookies site.
Strategy Overview
Inside Bar Momentum Strategy.
Inside Bar Detection
Position sizing based on stoploss distance ( Note: Based on equity and assumes that the account currency is the counter currency.
Stop buys for entries
Takeprofit / Stoplosses for exits
Control Stopbuy, Takeprofit and Stoploss targets with inputs
Control Backtest start/end dates
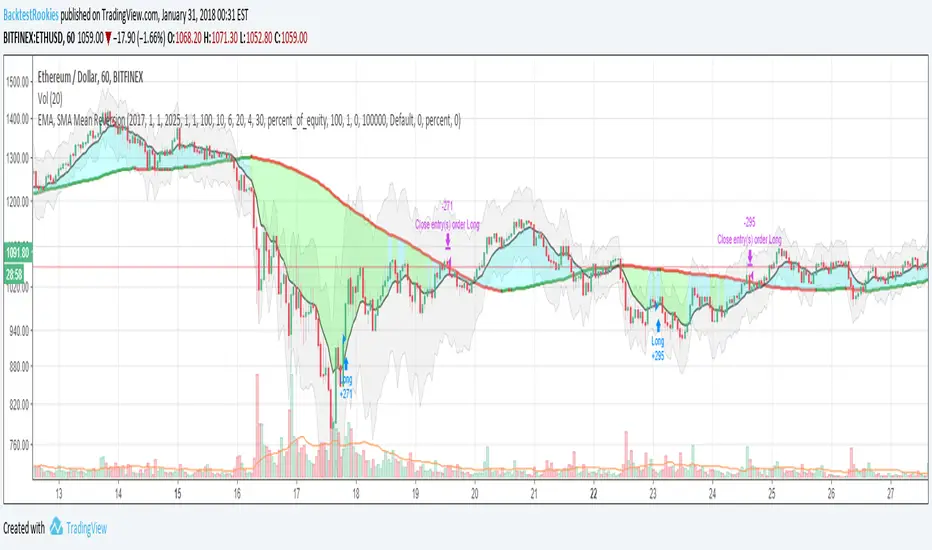
EMA, SMA Mean ReversionInvite Only: But everyone will be accepted
Invite-only in order to understand demand and interest in this type of strategy. All requests are welcome and will be accepted.
Full Source is available
A blog post containing full source code and commentary of the strategy is available on the backtest-rookies website. To comply with house rules, I cannot post a direct link here. (Hint add ".com" to backtest-rookies)
Overview
The strategy uses two moving averages to represent the historical mean and a slightly smoothed version of the current price action. It will place long or short trades when the fast EMA moves far away from the historical mean (the slow SMA).
Features
Set Backtest Date ranges
Enter when EMA is x% away from the mean
Independent inputs for the long and short side
Only enter when the EMA has started to reverse. (Input)
Optional Stop loss
Limit trades to a single direction to "Buy the dip" or "Sell the top"
CB: CCI & MFI IndicatorCustom Indicator development for a Backtest Rookies professional services customer. Published for customer testing and acceptance.
backtest-rookies.com

CB: CCI & MFI StrategyCustom Development for a Backtest Rookies professional services customer. Published for customer testing and acceptance.
backtest-rookies.com

BacktestLibraryLibrary "BacktestLibrary"
A library providing functions for equity calculation and performance metrics.
since(date, active)
: Calculates the number of candles since a specified date.
Parameters:
date (simple float) : (simple float): The starting date in timestamp format (e.g., input.time(timestamp()))
active (simple bool) : (simple bool): If true, counts the number of candles since the date; if false, returns 0.
Returns: (int): The number of candles since the specified date.
buy_and_hold(r, startDate)
: Calculates the Buy and Hold Equity from a specified date.
Parameters:
r (float) : (series float): Daily returns of the asset (e.g., 0.02 for 2% move).
startDate (simple float) : (simple float): Timestamp of the starting date for the equity calculation.
Returns: (float): Buy and Hold Equity of the asset from the specified date.
equity(sig, threshold, r, startDate, signals)
: Calculates the strategy's equity on a candle-by-candle basis.
Parameters:
sig (float) : (series float): Signal values; positive for long, negative for short.
threshold (simple float) : (simple float): Signal threshold for entering trades.
r (float) : (series float): Daily returns of the asset (e.g., 0.02 for 2% move).
startDate (simple float) : (simple float): Timestamp of the starting date for the equity calculation.
signals (simple string) : (simple string): Type of signals to backtest ("Long & Short", "Long Only", "Short Only").
Returns: (float): Strategy equity on a candle-by-candle basis.
PerformanceMetrics(base, Lookback, startDate)
: Calculates performance metrics of a strategy from a specified date.
Parameters:
base (float) : (series float): Equity values of the strategy or Buy and Hold equity.
Lookback (int) : (series int): Number of periods since the start date; recommended to use the 'since' function.
startDate (simple float) : (simple float): Timestamp of the starting date for the equity calculation.
Returns: (float ): Array of performance metrics.
PerfMetricTable(buy_and_hold, strategy)
: Plots a table comparing performance metrics of Buy and Hold and Strategy equity.
Parameters:
buy_and_hold (array) : (float ): Metrics from the PerformanceMetrics() function for Buy and Hold.
strategy (array) : (float ): Metrics from the PerformanceMetrics() function for the strategy.
Returns: : Table displaying the performance metrics comparison.

Hucklekiwi Pip - HLHB Trend-Catcher SystemThe strategy was authored by Hucklekiwi Pip back in 2015 and is still being updated today. She says that the system was designed to simply catch short-term forex trends. At its heart, the system is a simple EMA crossover strategy with a couple of other indicators used for confirming entries.
Strategy Rules
See her original post here:
www.babypips.com
Be sure to check out the updates and tweaks over the years!
HOW TO USE
For full information on how to use this strategy and how to correctly set the exit time, see this post:
backtest-rookies.com

IFTSTOCH + RSI 1.0IFTSTOCH Strategy with 50% exits and full stops.
This strategy was developed for a backtest-rookies services customer. I has been published only for testing and acceptance. Access cannot be granted to anyone else sorry!
Other open source scripts are available on the Backtest Rookies profile.
