Newton Pulse Pro AI Exclusive – Newton
Next-Generation Trend Intelligence & Smart Range Filtering
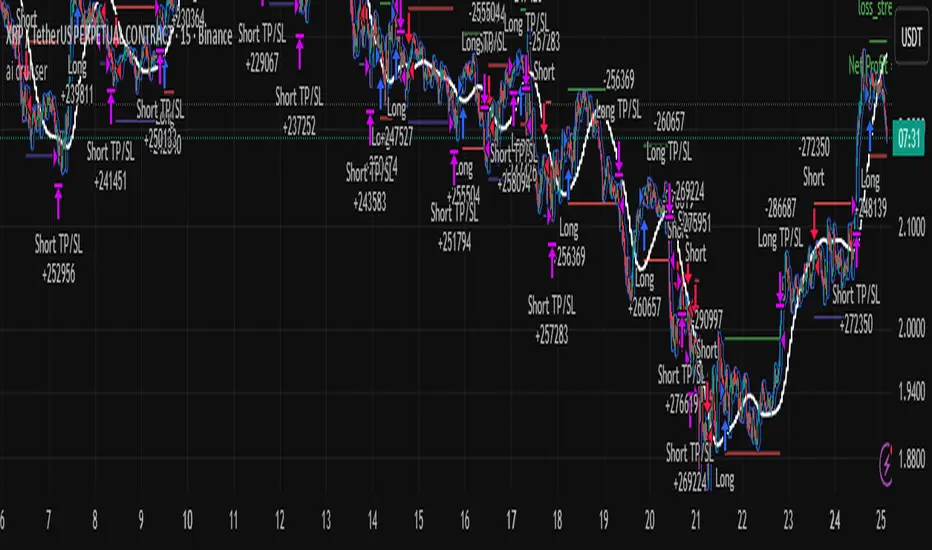
Introduction Newton is the newest powerhouse in the AI Exclusive series, specifically engineered to master trend dynamics. While most indicators fail during choppy, sideways markets, Newton uses advanced AI logic to distinguish between a true trending move and a high-risk range. It is designed for traders who value quality over quantity, providing signals only when the market has clear momentum.
Key Benefits
✅ Smart Range Filtering: Automatically detects sideways markets and remains silent to protect you from "choppy" price action.
✅ Pure Trend Following: Focuses exclusively on high-probability Buy and Sell entries within established trends.
✅ Noise Reduction: Eliminates false signals by ignoring minor price fluctuations that do not lead to real moves.
✅ Strategic Patience: Encourages disciplined trading by only appearing when the market conditions are optimal.
✅ Universal Application: Optimized for Forex, Crypto, Stocks, and Commodities.
General Specifications
Product Name: Newton (Powered by AI Exclusive)
Trading Style: Trend Following & Momentum
Signal Type: Non-Repaint (Signals are fixed once the candle closes)
Market Phase Detection: Intelligent Range/Trend differentiation
Visual Design: Clean, minimalist interface focused on entry execution
Individual Product Presentation: Newton (Trend Master)
Overview: An AI-driven indicator that specializes in identifying the "Law of Motion" in the market. It provides Buy/Sell signals only when a trend is confirmed, staying completely inactive during ranging phases to prevent capital erosion.
Benefits:
Avoids "Death by a Thousand Cuts" in sideways markets.
Provides clear, decisive entry points for Buy and Sell orders.
Simplifies the chart by removing unnecessary clutter and noise.
Features:
Proprietary Trend Logic: Analyzes market structure to ensure signals are backed by real volume and momentum.
Zero-Signal Range Mode: The indicator remains quiet when the market lacks a clear direction—one of its most powerful features.
Visual Precision: High-contrast labels and signals for instant decision-making.
Compatibility: Works seamlessly across all timeframes, from 1-minute scalping to weekly swing trading.
⚙️ Installation & Activation Guide
Secure Your License Purchase the Newton indicator or the full AI Exclusive Package through our official website.
Submit Your TradingView Details After purchase, send your TradingView email address to our support team for authorization.
Account Verification Our team will process your request and grant access to the proprietary script.
Activation & Use * Open TradingView.
Navigate to Indicators → Invite-Only Scripts.
Select AI Exclusive: Newton to apply it to your chart.
Pro Tip: When Newton is not showing signals, it is a signal in itself—it's telling you to stay on the sidelines and wait for a high-probability breakout.
Indicador Pine Script®