MMA, Mid-Price Moving Averages (Open + Close Based MAs)📝 Script Description
This script introduces a custom set of moving averages based on the mid-price, calculated as the average of the open and close prices:
Mid Price = (Open + Close) / 2
Instead of traditional close-based MAs, this approach reflects the average sentiment throughout the trading session, offering a smoother and more realistic view of price action.
🔍 Key Features:
✅ Gap-aware smoothing
Captures opening gaps, offering a better representation of intraday shifts.
✅ Reduced noise
Less vulnerable to sharp closing moves or one-off spikes, making it easier to identify true trend breaks or supports.
✅ Closer to actual flow
Reflects a more natural midline of price movement, ideal for traders who prioritize clean, sustained trends.
✅ Better support/resistance alignment
Especially useful for identifying stable uptrends and minimizing false breakout signals.
📐 Included Moving Averages:
MA 5
MA 10
MA 20
MA 60
MA 120
MA 200
(All based on mid-price, not close)
🎯 Recommended For:
Traders seeking smoother and more reliable trendlines
Those who want a more realistic depiction of support and resistance
Ideal for filtering out noisy movements while focusing on clean, straight-moving charts
Buscar en scripts para "TRENDLINES"

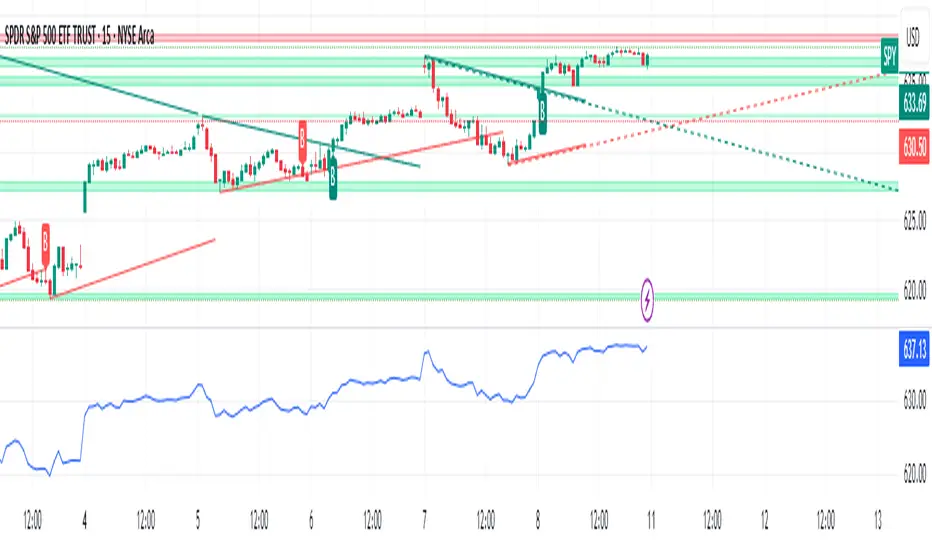
Trend Break Target
The Trend Break Target indicator helps traders identify and trade potential breakout opportunities with precision. It offers the following key benefits:
Customizable Trend Anchors
Allows traders to set specific start and end dates for the trendline, ensuring analysis is aligned with chosen time windows.
Supports different price sources (High, Low, Close) to fit diverse trading styles.
Automatic Trendline Projection
Dynamically plots a trendline between selected anchor points and extends it forward, providing a clear visual guide for future price interactions.
Breakout Detection
Instantly detects when price breaks above or below the trendline.
Plots breakout markers (▲ / ▼) directly on the chart to highlight actionable trade signals.
Pivot-Based Target Calculation
Uses the nearest valid pivot high/low before the breakout (or a fallback lookback if unavailable).
Measures the distance between the pivot and the trendline, then projects a target price in the breakout direction.
Clear Visual Targets
Draws a dotted target line to show where price may reach after the breakout.
Adds a connector line from breakout to target and a measurement line from pivot to trendline, improving clarity of the setup.
Automatic Reset & Efficiency
Resets calculations when new anchors are applied, keeping charts clean and reducing noise.
Deletes old lines and labels automatically to optimize chart readability.
Strategic Trade Planning
Helps traders quickly identify risk-reward opportunities by visualizing breakout levels and price targets.
Useful for trend continuation as well as reversal trading strategies.
👉 In short, the FTBT indicator provides a structured way to analyse trendlines, confirm breakouts, and project realistic price targets—making it a powerful tool for both discretionary and systematic traders.

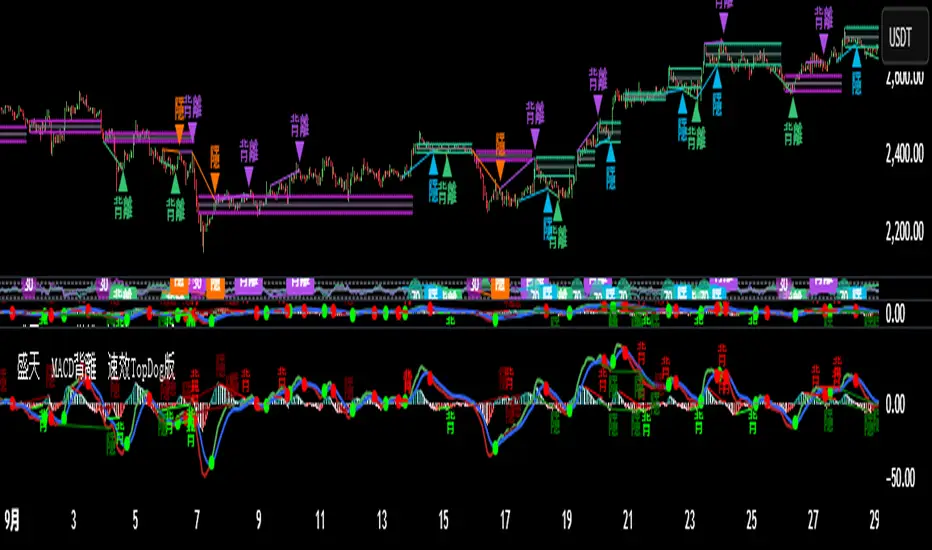
♨️盛天®MACD背離Ⓜ️速效TopDog版🕯📊功能概述
該指標整合了傳統 MACD(移動平均線收斂-發散指標)的核心功能,並新增了背離檢測、Top Dog Trading 的 MOM 和 DAD 模式、多時間框架支持以及靈活的視覺化和警報設置。
以下是其主要功能👇 :
1️⃣ MACD 核心計算MACD 線:由快速移動平均線(Fast MA)減去慢速移動平均線(Slow MA)計算得出,反映價格的短期與長期趨勢差異。
信號線:對 MACD 線進行平滑處理(通常使用 EMA 或 SMA),用於識別趨勢轉換點。
直方圖:MACD 線與信號線的差值,顯示動量的強弱和方向。
靈活性:用戶可選擇使用 EMA(指數移動平均線)或 SMA(簡單移動平均線)進行計算,並可設置快速均線、慢速均線和信號線的週期。
📊Feature Overview
This indicator integrates the core functionality of the traditional MACD (Moving Average Convergence-Divergence) indicator and adds divergence detection, Top Dog Trading's MOM and DAD modes, support for multiple time frames, and flexible visualization and alert settings.
Here are its key features:
1. MACD Core Calculation: The MACD Line is calculated by subtracting the Slow Moving Average (Slow MA) from the Fast Moving Average (Fast MA) and reflects the divergence between short-term and long-term price trends.
Signal Line: The MACD Line is smoothed (typically using an EMA or SMA) to identify trend reversals.
Histogram: The difference between the MACD Line and the Signal Line indicates the strength and direction of momentum.
Flexibility: Users can choose to use either EMA (Exponential Moving Average) or SMA (Simple Moving Average) for calculations, and can set the periods for the fast and slow moving averages, as well as the signal line.
2️⃣多時間框架支持通過 request.security 函數,允許用戶選擇不同的時間框架(例如 1 小時、日線等)來計算 MACD,適用於分析更高或更低時間框架的趨勢,無需改變圖表的當前時間框架。
2️⃣Multi-timeframe support is available through the request.security function, allowing users to select different timeframes (such as 1 hour, daily, etc.) to calculate the MACD. This is suitable for analyzing trends in higher or lower timeframes without changing the current timeframe of the chart.
3️⃣Top Dog Mode:
The Top Dog Mode is an advanced feature of the indicator that enhances the MACD's sensitivity to short-term momentum and its ability to identify long-term trends through specific moving average periods (5, 20, 30) and MOM/DAD visualization. It is particularly suitable for short-term traders, swing traders, and market participants who need fast momentum signals. Through crossover dots, MOM histograms, DAD direction alerts, and divergence detection, the Top Dog Mode provides traders with flexible signal generation tools suitable for various market environments.
The signal line period (30) is longer than the standard MACD's 9, which helps filter out short-term fluctuations and confirm long-term trends.
The Top Dog pattern is suitable for the following trading scenarios:
(🔵➤ Short-term trading scenario: In highly volatile markets (such as forex or cryptocurrencies), use the rapid crossover signals of the MOM and DAD to capture short-term price fluctuations.
Recommendation: Use this pattern on lower timeframes (such as the 5-minute or 15-minute timeframe) and set a stop-loss to control risk.
(🔵➤ Trend confirmation scenario: Use the direction of the DAD to confirm the long-term trend and combine it with the MOM histogram to determine entry points.
Recommendation: Use this pattern on higher timeframes (such as the 1-hour or 4-hour timeframe) and combine it with trendlines or moving averages.
(🔵➤ Reversal trading scenario: Combine the Top Dog pattern's divergence signals (labeled "divergence" or "hidden") to identify potential trend reversals.
Recommendation: Confirm divergence signals near key support/resistance levels to reduce the risk of false positives.
(🔵➤ Trend Continuation Scenarios: Using Hidden Divergences (labeled "Hidden") to Identify Trend Continuation Opportunities 👇
4. Divergence Detection: Regular Divergences (labeled "Divergence"): Bullish Divergence: When the price makes lower lows, but the MACD histogram or MACD line makes higher lows, it indicates weakening bearish momentum and may signal a reversal.
Bearish Divergence: When the price makes higher highs, but the MACD histogram or MACD line makes lower highs, it indicates weakening bullish momentum and may signal a reversal. 👇
Hidden Divergences (labeled "Hidden"): Hidden Bullish Divergence: When the price makes higher lows, but the MACD histogram or MACD line makes lower lows, it may signal the possibility of trend continuation.
Hidden Bearish Divergence: When the price makes lower highs, but the MACD histogram or MACD line makes lower highs, it may signal a reversal. The line has made a higher high, indicating the possibility of trend continuation👇
3️⃣Top Dog 模式:
Top Dog 模式是該指標的一個進階功能,通過特定的均線週期(5、20、30)和 MOM/DAD 的視覺化方式,增強了 MACD 對短期動量的敏感性和長期趨勢的確認能力。它特別適合短線交易者、波段交易者和需要快速動量信號的市場參與者。通過交叉圓點、MOM 直方圖、DAD 方向警報和背離檢測,Top Dog 模式為交易者提供了靈活的信號生成工具,適用於多種市場環境。
信號線週期(30)比標準 MACD 的 9 更長,有助於過濾短期波動,確認長期趨勢。
Top Dog 模式適用於以下交易場景:
(🔵➤短線交易場景:在高波動市場(如外匯或加密貨幣)中,利用 MOM 和 DAD 的快速交叉信號捕捉短期價格波動。
建議:在低時間框架(如 5 分鐘或 15 分鐘)使用,並設置止損以控制風險。
(🔵➤ 趨勢確認場景:利用 DAD 的方向確認長期趨勢,結合 MOM 直方圖判斷進場時機。
建議:在較高時間框架(如 1 小時或 4 小時)使用,結合趨勢線或移動平均線。
(🔵➤反轉交易場景:結合 Top Dog 模式的背離信號(標籤“背”或“隱”),識別潛在的趨勢反轉。
建議:在關鍵支撐/阻力位附近確認背離信號,降低假信號風險。
(🔵➤ 趨勢延續場景:利用隱藏背離(標籤“隱”)捕捉趨勢延續機會👇
4. Divergence Detection: Regular Divergence (labeled "Divergence"): Bullish Divergence: When prices make lower lows, but the MACD histogram or MACD line makes higher lows, it indicates weakening downside momentum and may signal a reversal.
Bearish Divergence: When prices make higher highs, but the MACD histogram or MACD line makes lower highs, it indicates weakening upside momentum and may signal a reversal.
4️⃣背離檢測常規背離(標籤為“背”):看漲背離:當價格創出更低低點,但 MACD 直方圖或 MACD 線創出更高低點,表明下跌動量減弱,可能預示反轉。
看跌背離:當價格創出更高高點,但 MACD 直方圖或 MACD 線創出更低高點,表明上漲動量減弱,可能預示反轉👇。
隱藏背離(標籤為“隱”):隱藏看漲背離:當價格創出更高低點,但 MACD 直方圖或 MACD 線創出更低低點,表明趨勢延續的可能。
隱藏看跌背離:當價格創出更低高點,但 MACD 直方圖或 MACD 線創出更高高點,表明趨勢延續的可能👇
5️⃣ Trend Coloring MACD Line: Based on the position of the MACD line relative to the signal line (crossing above for an uptrend, crossing below for a downtrend), you can choose whether to display the trend color (default green for uptrend, red for downtrend)👇.
5️⃣ 趨勢著色MACD 線:根據 MACD 線相對於信號線的位置(上穿為上升趨勢,下穿為下降趨勢),可選擇是否顯示趨勢顏色(默認綠色為上升,紅色為下降)👇 。
6️⃣ Crossover Dots:
When the MACD line crosses the signal line, a dot appears: Upward crossover (MACD line crosses above the signal line): a green dot.
Downward crossover (MACD line crosses below the signal line): a red dot. You can set whether to display the dot and its width.
6️⃣ 交叉圓點:
當 MACD 線與信號線交叉時,顯示圓點:上穿(MACD 線上穿信號線):綠色圓點。
下穿(MACD 線下穿信號線):紅色圓點。可設置是否顯示以及寬度👇 。
7️⃣ Display Flexibility: Users can choose whether to display the MACD line, signal line, histogram, histogram outline, MOM histogram (Top Dog pattern), crossover dots, and divergence labels.
Line widths (MACD line, signal line, histogram, dots) and color settings are adjustable.
7️⃣顯示靈活性用戶可選擇是否顯示 MACD 線、信號線、直方圖、直方圖外框、MOM 直方圖(Top Dog 模式)、交叉圓點和背離標籤。
可調整線條寬度(MACD 線、信號線、直方圖、圓點)和顏色設置👇 。
8️⃣警報功能:
MACD交叉警報:
🚨MACD 線上穿信號線(看漲信號)。
🚨MACD 線下穿信號線(看跌信號)。
🚨MACD > 0 且上穿(強看漲信號)。
🚨MACD < 0 且下穿(強看跌信號)。
背離警報:
🚨MACD 直方圖/MOM 的常規和隱藏看漲/看跌背離。
🚨MACD 線/DAD 的常規和隱藏看漲/看跌背離。
DAD 方向警報:
🚨DAD(信號線)方向改變(交叉前一根 K 線的信號線值)。
🚨DAD 向上(信號線上升)。
🚨DAD 向下(信號線下降)。
所有警報默認啟用,可通過 TradingView 的警報設置面板配置通知方式。
8️⃣Alert Features:
MACD Crossover Alerts:
🚨MACD Line crosses above Signal Line (bullish signal).
🚨MACD Line crosses below Signal Line (bearish signal).
🚨MACD > 0 and crosses upward (strong bullish signal).
🚨MACD < 0 and crosses downward (strong bearish signal).
Divergence Alerts:
🚨Regular and hidden bullish/bearish divergences of the MACD Histogram/MOM.
🚨Regular and hidden bullish/bearish divergences of the MACD Line/DAD.
DAD Direction Alerts:
🚨DAD (Signal Line) direction changes (crosses over the previous candlestick's Signal Line value).
🚨DAD up (Signal Line rising).
🚨DAD down (Signal Line falling).
All alerts are enabled by default, and notification methods can be configured through the TradingView Alerts panel.
Dynamic Support and Resistance V2 | AnonycryptousThe Dynamic Support and Resistance V2 indicator, an easy tool to identify key support, resistance, trendline levels, pivot points and volume data.
Pivot Points.
Calculates support, resistance and trendline levels using pivot points, which are derived from the high, low, and close prices of previous trading periods.
Customize the pivot calculation by using Close' or 'High/Low' and adjusting the lookback periods for both the left and right sides of the pivot calculation.
Pivot points are crucial for forecasting potential market turning points, so it allows traders to adapt the indicator to different market conditions and timeframes.
By using pivot points, traders can spot reversal and consolidation levels or trendlines early on, allowing them to react to them in time.
Volume Levels.
This option focuses on identifying support and resistance levels based on volume data, specifically the Point of Control.
The POC is the highest traded volume price level during a time period.
This POC calculation, allow traders to areas of significant trading levels as support or resistance zones.
Volume-based levels gives insights into market sentiment and showes strong support and resistance based on trading volume.
Traders can choose between pivot-based and volume-based levels or use both simultaneously, depending on their analysis.
The indicator offers custom colors, so the trader can customize their visual analysis to their own style.
It calculates the importance of each level based on the number of touches and the duration it holds.
This indicator is intended for educational and informational purposes only and should not be considered financial advice.
Trading involves significant risk, and you should consult with a financial advisor before making any trading decisions.
The performance of this indicator is not guaranteed, and past results do not predict future performance.
Use at your own risk.

ATR x2 AUTODescription:
This indicator automatically plots ATR-based horizontal levels for each of the most recent candles, helping traders visualize potential stop-loss hunting zones, breakout areas, or price reaction points.
It works by taking the Average True Range (ATR) over a customizable period and multiplying it by a user-defined factor (default: ×2). For each of the last N candles (default: 5), it calculates and draws:
Below green candles (bullish) → A horizontal line placed ATR × multiplier below the candle’s low.
Above red candles (bearish) → A horizontal line placed ATR × multiplier above the candle’s high.
Doji candles → No line is drawn.
Each line extends to the right indefinitely, allowing traders to monitor how price reacts when returning to these ATR-based levels. This makes the tool useful for:
Identifying likely stop-loss clusters below bullish candles or above bearish candles.
Anticipating liquidity sweeps and fakeouts.
Supporting breakout or reversal strategies.
Key Features:
Customizable ATR length, multiplier, number of recent candles, and line thickness.
Separate colors for bullish and bearish candle levels.
Automatic real-time updates for each new bar.
Clean overlay on the main price chart.
Inputs:
ATR Length → Period used for ATR calculation.
Multiplier → Factor applied to the ATR distance.
Number of Candles → How many recent candles to track.
Line Thickness and Colors → Full visual customization.
Usage Tip:
These levels can be combined with key market structure points such as support/resistance, trendlines, or the 200 EMA to anticipate high-probability price reactions.

Source-indicatorsSource Indicators – A premium TradingView tool combining automated support/resistance levels, dynamic trendlines, and breakout alerts.
Perfect for spotting key market zones and trend shifts in real-time.
BuySell-byALHELWANI🔱 BuySell-byALHELWANI | مؤشر التغيرات الاتجاهية الذكية
BuySell-byALHELWANI هو مؤشر احترافي متقدّم يرصد نقاط الانعكاس الحقيقية في حركة السوق، باستخدام خوارزمية تعتمد على تحليل القمم والقيعان الهيكلية للسعر (Structure-Based Detection) وليس على مؤشرات تقليدية.
المؤشر مبني على مكتبة signalLib_yashgode9 القوية، مع تخصيص كامل لأسلوب العرض والتنبيهات.
⚙️ ما يقدمه المؤشر:
🔹 إشارات واضحة للشراء والبيع تعتمد على كسر هيكل السوق.
🔹 تخصيص مرن للعمق والانحراف وخطوات التراجع (Backstep) لتحديد الدقة المطلوبة.
🔹 علامات ذكية (Labels) تظهر مباشرة على الشارت عند كل نقطة قرار.
🔹 تنبيهات تلقائية فورية عند كل تغير في الاتجاه (Buy / Sell).
🧠 الآلية المستخدمة:
DEPTH_ENGINE: يتحكم في مدى عمق النظر لحركة السعر.
DEVIATION_ENGINE: يحدد المسافة المطلوبة لتأكيد نقطة الانعكاس.
BACKSTEP_ENGINE: يضمن أن كل إشارة تستند إلى تغير هيكلي حقيقي في الاتجاه.
📌 المميزات:
✅ لا يعيد الرسم (No Repaint)
✅ يعمل على كل الأطر الزمنية وكل الأسواق (فوركس، مؤشرات، كريبتو، أسهم)
✅ تصميم بصري مرن (ألوان، حجم، شفافية)
✅ يدعم الاستخدام في السكالبينغ والسوينغ
ملاحظة:
المؤشر لا يعطي إشارات عشوائية، بل يستند إلى منطق السعر الحقيقي عبر تتبع التغيرات الحركية للسوق.
يُفضّل استخدامه مع خطة تداول واضحة وإدارة رأس مال صارمة.
🔱 BuySell-byALHELWANI | Smart Reversal Detection Indicator
BuySell-byALHELWANI is a high-precision, structure-based reversal indicator designed to identify true directional shifts in the market. Unlike traditional indicators, it doesn't rely on lagging oscillators but uses real-time swing analysis to detect institutional-level pivot points.
Powered by the robust signalLib_yashgode9, this tool is optimized for traders who seek clarity, timing, and strategic control.
⚙️ Core Engine Features:
🔹 Accurate Buy/Sell signals generated from structural highs and lows.
🔹 Adjustable sensitivity using:
DEPTH_ENGINE: Defines how deep the algorithm looks into past swings.
DEVIATION_ENGINE: Sets the deviation required to confirm a structural change.
BACKSTEP_ENGINE: Controls how many bars are validated before confirming a pivot.
🧠 What It Does:
🚩 Detects market structure shifts and confirms them visually.
🏷️ Plots clear Buy-point / Sell-point labels directly on the chart.
🔔 Sends real-time alerts when a directional change is confirmed.
🎯 No repainting – what you see is reliable and final.
✅ Key Benefits:
Works on all timeframes and all asset classes (FX, crypto, indices, stocks).
Fully customizable: colors, label size, transparency.
Ideal for scalping, swing trading, and strategy automation.
High visual clarity with minimal noise.
🔐 Note:
This script is designed for serious traders.
It highlights real market intent, especially when used with trendlines, zones, and volume analysis.
Pair it with disciplined risk management for best results.

Fibonacci-Based Volume Flow (VFI)Fibonacci-based Volume Flow is an advanced next-generation evolution of LazyBear’s original VFI script that calculates and averages up to 21 Fibonacci-based VFI pairings to create a smoothed composite volume flow signal. This unique and powerful approach reduces noise, adapts to volatility, and provides a clearer view of trend strength and market structure across all timeframes. It also includes dynamic fibonacci guide levels, adaptive lookbacks, EMA crossovers, and structure-aware pivot labeling to help traders identify high-quality reversals, confirm directional bias, and detect divergences with greater precision. It's ideal for traders looking to enhance momentum analysis through volume-based confirmation.
🧠 Key Features🧠
🔹 Multi-VFI Fibonacci Fusion🔹
Blends up to 21 VFI signals (5, 13, 21, 34… up to 610) into smartly paired averages (e.g., 13/34, 55/144) — forming a smoothed composite VFI that’s more adaptive, less noisy, and highly responsive across market conditions.
🔸🔸 Dynamic Lookbacks🔸 🔸
Automatically adjusts histogram high/low tracking based on your chart’s timeframe — no more static tuning. Perfect for scalping fast charts or confirming long-term trends.
🟥🟩 Color-Coded Histogram🟥🟩
Visualizes VFI momentum with gradient coloring.
🧩🧩 Signal Crossovers 🧩🧩
Color-coded crossover lines persistently show bullish or bearish dominance.
Includes three powerful crossover systems:
➖5/13 VFI: Fast, early reversal detection
➖8/21 VFI: Swing-trading sweet spot
➖55/144 VFI: Trend confirmation across long cycles
🏷️ 🏷️Pivot Structure Labels🏷️🏷️
Labels oscillator swings with full structural logic:
➖HH, HL, LH, LL, EQ
➖Displays percent change, price at pivot, oscillator reading
➖Smart coloring detects divergence & trend continuation
📈 📈Dynamic Histogram Guides📈📈
Optional zero and ±50% bands anchor histogram levels based on real histogram extremes, not static thresholds — visually frame momentum shifts with context.
📍 📍Persistent High/Low Pivot Lines📍📍
Track the most significant histogram pivots (not price) across time, with smart labels:
➖Volume flow structure zones
➖Label shows price at pivot, oscillator level, and bars since event
➖Ideal for spotting divergence zones, momentum failures, and trend exhaustion.
🔍 🔍Volatility Table (ATR%)🔍🔍
💡Shows real-time volatility compression or expansion
💡Uses multiple ATR periods (e.g., 14 & 55) for short- and medium-term comparison
💡Helps traders understand whether momentum is likely to continue or stall
🔩🔩Volume-weighted VFI baselines🔩🔩
🟢A daily session-based VWAP of the VFI, which resets each day and highlights intraday volume flow context.
🟠A rolling VWA of VFI, which acts like a VWMA over a fixed window (e.g., 55 bars), smoothing short-term fluctuations and supporting trend/momentum confirmation.
These VWAP-style overlays help traders identify strength vs. weakness relative to volume-weighted baselines — useful for divergence spotting, mean reversion setups, or breakout confirmation.
🧰 🧰Under the Hood: How It Works🧰🧰
🔧 Core VFI Logic
Based on LazyBear’s foundational VFI:
➖Uses log returns of price (HLC3)
➖Filters insignificant moves using volatility-weighted thresholds
➖Normalizes volume via adaptive capping (e.g., 2.5× average)
🌀 Composite Blend System
Each VFI instance is smoothed and then fused via user-selectable pairs. This creates a customizable average VFI representing short, mid, and long-term pressure — one value, many time horizons.
📊 EMA Signal Layer
Crosses trigger persistent color shifts in signal lines, making trend strength clear at a glance.
VFI blend feeds into EMA crossovers. You can toggle visibility for:
➖Fast (5/13)
➖Medium (8/21)
➖Slow (55/144)
🧭 Pivot Framework
Structure logic only compares pivots on same-side polarity:
➖Highs compare to highs above zero
➖Lows compare to lows below zero
This avoids nonsensical comparisons and preserves logical sequences (HH → LH → HL).
🧱 Dynamic Labels
All pivots and persistent levels display:
➖Oscillator value
➖Price value
➖Structure tag (e.g., LH, HL)
➖% change from prior pivot
➖Lookback info
➖Bar age
Unlike traditional VFI:
✅ It blends timeframes with Fibonacci precision
✅ Uses dynamic, volatility-aware logic
✅ Embeds visual structure & divergence intelligence
✅ Enhances entry confidence and exit timing
🔧 This isn’t just an indicator — it’s a volume-informed decision engine.
Ideal For:
🔶Trend-followers wanting cleaner volume-based confirmation
🔶Reversal traders spotting structure + divergence
🔶Scalpers or investors needing adaptable signals
🔶Those who loved LazyBear's VFI
📌 Final Note:
As powerful as Fibonacci Blended Volume Flow is, no single indicator should be used in isolation. For best results, combine it with price action analysis, higher-timeframe context, and complementary tools like trendlines, moving averages, or support/resistance levels. Use it as part of a well-rounded trading approach to confirm setups — not to define them alone.

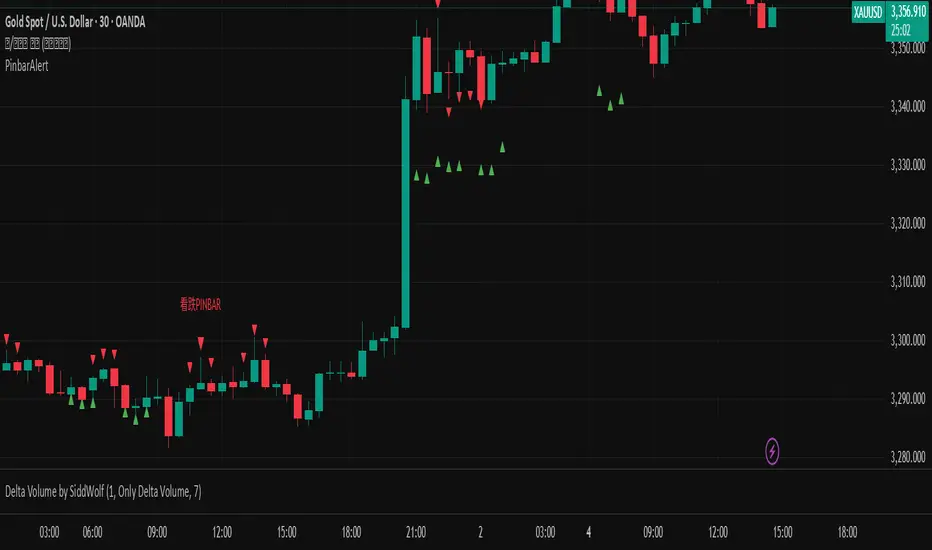
Pinbar signal 顶/底分型 指标Top/Bottom Fractal Indicator is a technical analysis tool used to identify potential reversal points in a market trend. It is based on the concept of fractal patterns, which consist of specific candlestick formations that signal local highs (top fractals) or lows (bottom fractals).
A top fractal typically occurs when the high of a middle candlestick is higher than the highs of the two candles on either side. This formation suggests that upward momentum may be weakening and a downward reversal could follow. Conversely, a bottom fractal forms when the low of a middle candlestick is lower than the lows of the two adjacent candles, indicating a potential shift from a downtrend to an uptrend.
This indicator is commonly used to spot market turning points, determine entry or exit signals, and enhance the reliability of other indicators such as Bollinger Bands or MACD. Because of its clear structure and reliable reversal signals, the Top/Bottom Fractal Indicator is also widely applied in wave theory and price action strategies.
A Pin Bar is a powerful candlestick pattern used in technical analysis to identify potential price reversals or continuations in the market. It is characterized by a small body located at one end of the candle and a long tail or wick on the opposite side, which indicates a strong rejection of price in that direction. A bullish Pin Bar has a long lower wick, showing that sellers pushed the price down but buyers regained control, suggesting a potential upward move. Conversely, a bearish Pin Bar has a long upper wick, indicating that buyers attempted to drive prices higher but were overpowered by sellers, hinting at a possible downward move. For high-probability setups, traders typically look for Pin Bars that form at key support or resistance levels, trendlines, or Fibonacci zones, and they often use them in combination with overall trend direction. Entry strategies include entering at the close of the Pin Bar, on a retracement, or above/below the wick with stop-losses placed beyond the wick’s extreme. When used correctly in the right context, the Pin Bar can be a highly effective signal in a trader’s toolkit.

Pinbar signalA Pin Bar is a powerful candlestick pattern used in technical analysis to identify potential price reversals or continuations in the market. It is characterized by a small body located at one end of the candle and a long tail or wick on the opposite side, which indicates a strong rejection of price in that direction. A bullish Pin Bar has a long lower wick, showing that sellers pushed the price down but buyers regained control, suggesting a potential upward move. Conversely, a bearish Pin Bar has a long upper wick, indicating that buyers attempted to drive prices higher but were overpowered by sellers, hinting at a possible downward move. For high-probability setups, traders typically look for Pin Bars that form at key support or resistance levels, trendlines, or Fibonacci zones, and they often use them in combination with overall trend direction. Entry strategies include entering at the close of the Pin Bar, on a retracement, or above/below the wick with stop-losses placed beyond the wick’s extreme. When used correctly in the right context, the Pin Bar can be a highly effective signal in a trader’s toolkit.
RAMS TrapMaster ConfluenceOverview:
The TrapMaster Confluence indicator is a tactical multi-factor confirmation system designed to identify high-probability intraday and swing trade setups. It aligns multiple technical signals—momentum, trend, volume, and price action—to generate a clear bias score. By requiring confluence across several dimensions, it filters out weak or noisy signals and highlights trades with broader technical agreement. This tool is tailored for semi-advanced retail traders across equities, futures, and crypto who seek objective, structured confirmations before entering a position.
Confluence Components:
RSI (Relative Strength Index):
Evaluates momentum strength and trend bias. The script dynamically checks for crossovers at the 50 midline and extreme overbought/oversold zones to determine directional pressure.
MACD (Moving Average Convergence Divergence):
Detects momentum shifts using signal line crossovers and MACD histogram polarity. The script uses MACD direction and histogram flips to contribute to bullish or bearish pressure.
SMA 5 vs. SMA 20:
Captures short-term trend shifts via fast–slow moving average crossovers. A rising 5-SMA over a falling 20-SMA supports a bullish thesis and vice versa.
SMA 50 vs. SMA 200:
Used to confirm longer-term trend bias (e.g. golden cross or death cross) and add weight to the broader market structure.
SMA 5 Trend Direction:
Assesses immediate trend slope. An upward or downward slope of the 5-SMA confirms recent price acceleration or deceleration.
Volume Spike:
Flags high-volume price moves, helping validate whether momentum is supported by institutional participation or liquidity interest.
Rising Volume Bars:
Confirms directional strength through consistent increases in volume during trends. Sustained rising volume suggests growing conviction.
VWAP (Volume-Weighted Average Price):
Anchors price to institutional average cost per session. Price above VWAP typically indicates bullish sentiment; below signals bearish sentiment.
Candlestick Confirmation:
Confirms signals using recent price action (e.g. engulfing candles, breakouts with volume). Adds an extra layer of price behavior validation.
Contrarian Mode (Optional):
This feature flips the typical logic to catch high-probability reversal zones. When many signals align in one direction, contrarian mode allows the user to search for exhaustion points in sentiment or momentum, potentially capturing mean reversions.
Each confluence factor contributes a vote to a composite bias count. Users define a threshold (e.g., 4 out of 6 conditions) to trigger a signal. The indicator does not rely on any one signal, but instead rewards alignment across multiple technical aspects.
Signal Generation & Alerts:
When the defined confluence threshold is met, a signal label appears on the chart with directional context (long or short). Alerts can be tied to these signals, allowing the user to be notified in real time when actionable setups occur. The system supports “next candle confirmation,” which delays signal printing until the bar closes, minimizing premature alerts. All labels are limited to the most recent few to reduce chart clutter.
Dashboard Overview:
The optional real-time dashboard shows which confluence components are active on the current candle. This visual panel is customizable, updating dynamically and remaining hidden when no conditions are met. It includes:
Each factor with active/inactive status
Current bullish and bearish score counts
Real-time snapshot of bias development
Customization & Controls:
All components can be toggled on or off. Traders can choose to require stricter or looser confirmation thresholds. Label visibility, signal timing, and dashboard position/size are fully adjustable. This allows the indicator to adapt across timeframes and trading styles — whether scalping or swing trading.
Suggested Use with Trendlines and support and resistance:
TrapMaster becomes significantly more powerful when used alongside manual or automated support/resistance and trendline analysis. Confluence signals occurring near:
major support zones,
resistance levels,
trendline retests.
Fibonacci retracements,
help validate the price’s reaction to those areas. Traders can pre-mark key price zones, then use TrapMaster to confirm entries as momentum builds at those levels. This strengthens conviction and supports timing decisions when structure and indicators align.
Why It’s Different:
Most scripts offer a single signal or simplistic crossover logic. TrapMaster offers multi-dimensional logic that evaluates a comprehensive set of confluence factors—each customizable—with real-time logic that updates on every bar. The built-in dashboard provides a highly readable tactical summary. Its optional contrarian bias engine, dashboard visuals, factor-level customization, and risk-filtering logic (e.g. delayed confirmation and volume context) make it a flexible and advanced system not commonly found in traditional retail indicators.
Disclaimers:
This tool is for educational and analytical use only. It is not intended as trading or financial advice. All trading carries risk, and past performance is not indicative of future results. Always use proper risk management and conduct your own independent analysis before making trading decisions.
Developed by: TRAPPER-RAMS
Jul 24
Release Notes
This is the official update to RAMS TrapMaster Confluence, featuring massive enhancements across visual clarity, confluence accuracy, and real-time alert precision.
What's New:
Accurate Confluence Dashboard
Triple-row layout: Bullish , Bearish , and clear headers
Bull/Bear condition separation for total clarity
SMA 5/20 & 50/200 cross states tracked and displayed
Fully Integrated Alerts
Alerts for 5/20 and 50/200 SMA crosses
Bullish 💸 and Bearish 💰 confluence entry alerts
Instant trigger-ready setup
Visual Label Overhaul
💸 = Buy Signal (normal mode)
💰 = Sell Signal (normal mode)
🧨 = Contrarian Bull Flip
💣 = Contrarian Bear Flip
Cross labels show exact bar: "5/20 X", "50/200 X"
CoolDown & Memory-Efficient Label Logic
• Configurable label cooldown per N bars
• Old signals auto-deleted to prevent overflow
Use Cases:
This update is ideal for traders looking for precision entry timing, while understanding the full bull/bear backdrop in real-time.


ZigZag Based RSIDescription
ZigZag Trend RSI (ZZ-RSI) is an advanced momentum indicator that combines ZigZag-based trend detection with a trend-adjusted RSI to deliver smarter overbought and oversold signals. Unlike traditional RSI that reacts purely to price movement, this indicator adapts its sensitivity based on the prevailing trend structure identified via the ZigZag pattern.
By dynamically adjusting RSI thresholds according to market direction, ZZ-RSI helps filter out false signals and aligns RSI readings with broader trend context—crucial for trend-following strategies, counter-trend entries, and volatility-based timing.
Core Components
ZigZag Pattern Recognition:
Identifies significant swing highs and lows based on price deviation (%) and pivot sensitivity (length). The most recent pivot determines the prevailing trend direction:
🟢 Bullish: last swing is a higher high
🔴 Bearish: last swing is a lower low
⚪ Neutral: no recent significant movement
Trend-Weighted RSI:
Modifies traditional RSI input by emphasizing price changes in the direction of the trend:
In bull trends, upside moves are magnified.
In bear trends, downside moves are emphasized.
Dynamic RSI Zones:
Overbought and Oversold thresholds adapt to the trend:
In uptrends: higher OB and slightly raised OS → tolerate stronger rallies
In downtrends: lower OS and slightly reduced OB → accommodate stronger sell-offs
In neutral: default OB/OS values apply
How to Use
✅ Entries (Reversal or Mean Reversion Traders):
Look for oversold signals (green triangle) in downtrends or neutrals to catch potential reversals.
Look for overbought signals (red triangle) in uptrends or neutrals to fade momentum.
Confirm with price action or volume for higher conviction.
📈 Trend Continuation (Momentum or Trend-Followers):
Use the trend direction label (Bullish / Bearish / Neutral) to align your trades with the broader move.
Combine with moving averages or price structure for entry timing.
Avoid counter-trend signals unless confirmed by divergence or exhaustion.
🧠 Signal Interpretation Table (top right of chart):
Trend: Indicates the current market direction.
RSI: Real-time trend-adjusted RSI value.
Signal: OB/OS/Neutral classification.
Customization Options
ZigZag Length / Deviation %:
Adjust pivot sensitivity and filter out minor noise.
RSI Length:
Controls how fast RSI responds to trend-adjusted price.
Color Settings:
Personalize visual cues for trend direction and OB/OS backgrounds.
Alerts Included
📢 Overbought/oversold conditions
🔄 Trend reversals (bullish or bearish shift)
These alerts are ideal for automated strategies, mobile notifications, or algorithmic workflows.
Ideal For
Traders seeking smarter RSI signals filtered by market structure
Trend-followers and swing traders looking for reliable reversals
Those frustrated with false OB/OS signals in volatile or trending markets
Best Practices
Use in confluence with price structure, trendlines, or S/R levels.
For intraday: consider lowering ZigZag Length and RSI Length.
For higher timeframes: use higher deviation % and smoother RSI to reduce noise.

Marketmap by Logicat📊 Marketmap is truly a "Capital Flow Sensor Indicator" – Uncover the Truth Behind Price Movements
Have you ever been frustrated by sudden market reversals?
Have you been stopped out during fake breakouts or deceptive rallies?
This indicator was born to solve exactly those pain points.
📌 Core Features of the Indicator:
1. Capital Flow Detection
By calculating the interaction between volume and price, this tool identifies the flow of smart money — spotting abnormal volume spikes, accumulation signs, and distribution signals.
2. Automatic Marking of Hidden Order Zones (Smart Money Zones)
It detects footprints of institutional activity and highlights meaningful support/resistance zones, rather than drawing random lines — helping you focus on price levels that truly matter to the market.
3. Volume Analysis of Support/Resistance Zones
Each marked zone includes real-time volume strength analysis, helping to determine whether a zone is likely to hold or break.
4. Interest Zone Detection
The indicator can preemptively identify price zones likely to be revisited, allowing you to distinguish between support retests and continuation setups.
5. Automatic Trendline Drawing
Draws real-time trendlines to help determine directional bias and test points.
6. Live Trend Calculation
Displays a simple real-time strength comparison table between gold and USD.
🧠 More Than Just an Indicator — A Market Structure and Liquidity Engine
It integrates:
Price + Volume Structure
Smart Money Traces
Dynamic Strength of S/R Zones
High Timeframe (HTF) Liquidity Perspective
💡 Recommended For:
Ideal for swing traders, intraday scalpers, and even order flow-focused traders.
Can be paired with trend-following strategies or naked chart trading systems to strengthen entry logic.
🔔 Disclaimer:
This indicator is not a crystal ball. It is a visual tool for highlighting high-probability zones and real transaction footprints.
You remain responsible for risk management and final trading decisions.

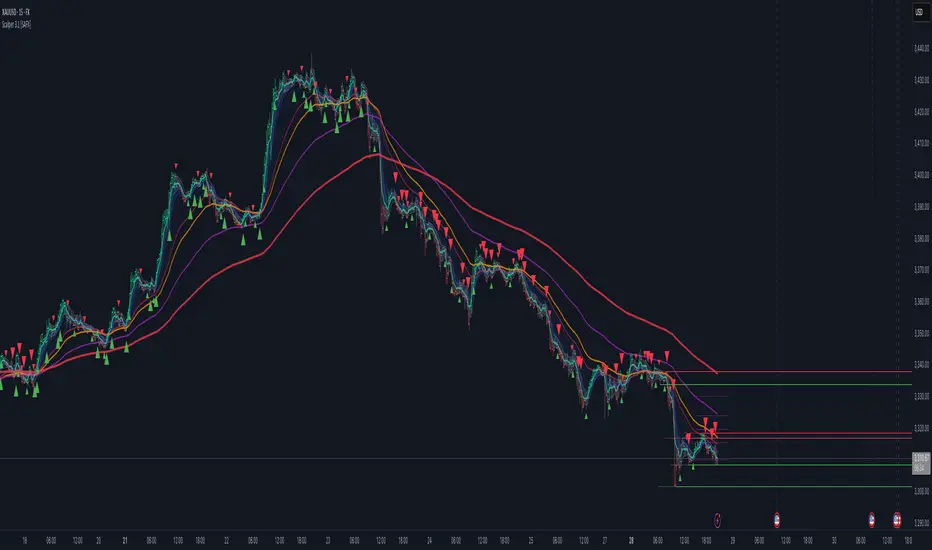
Scalper v3.1 [SystemAlphaFX]Scalper v3.1 indicator covers all aspects of this sophisticated trading tool.
Key Features:
Performance Presets - Four optimization levels from Maximum Performance to Full Features
Core Components - Detailed explanation of PAC system, EMAs, and signal systems
Advanced Features - Pivot points, S/R levels, trendlines, and Fibonacci tools
Trading Strategies - Specific entry/exit rules for different approaches
Alert System - Complete setup instructions for all 8 alert types
Optimization Tips - Settings for different timeframes and market conditions
Troubleshooting - Solutions for common performance and signal issues
Notable Features of This Indicator:
Price Action Channel (PAC) - The core system using EMA-based dynamic channels
Multiple Signal Systems - Impulse, TTM, and trend-based confirmations
Performance Optimization - Smart preset system to balance features vs. speed
Comprehensive Alerts - 8 different alert conditions for various trading scenarios
Smart RSI Divergence PRO | Auto Lines + Alerts📌 Purpose
This indicator automatically detects Regular and Hidden RSI Divergences between price action and the RSI oscillator.
It plots divergence lines directly on the chart, labels signals, and includes alerts for automated monitoring.
🧠 How It Works
1. RSI Calculation
RSI is calculated using the selected Source (default: Close) and RSI Length (default: 14).
2. Divergence Detection via Fractals
Swing points on both price and RSI are detected using fractal logic (5-bar patterns).
Regular Divergence:
Bearish: Price forms a higher high, RSI forms a lower high.
Bullish: Price forms a lower low, RSI forms a higher low.
Hidden Divergence:
Bearish: Price forms a lower high, RSI forms a higher high.
Bullish: Price forms a higher low, RSI forms a lower low.
3. Auto Drawing Lines
Lines are drawn automatically between divergence points:
Red = Regular Bearish
Green = Regular Bullish
Orange = Hidden Bearish
Blue = Hidden Bullish
Line width and transparency are adjustable.
4. Labels and Alerts
Labels mark divergence points with up/down arrows.
Alerts trigger for each divergence type.
📈 How to Use
Use Regular Divergences to anticipate trend reversals.
Use Hidden Divergences to confirm trend continuation.
Combine with support/resistance, trendlines, or volume for higher probability setups.
Recommended Timeframes: Works on all timeframes; more reliable on 1h, 4h, and Daily.
Markets: Forex, Crypto, Stocks.
⚙️ Inputs
Source (Close, HL2, etc.)
RSI Length
Toggle Regular / Hidden Divergence visibility
Toggle Lines / Labels
Line Width & Line Transparency
⚠️ Disclaimer
This script is for educational purposes only. It does not constitute financial advice.
Always test thoroughly before using in live trading.

FVG-Bully BearsFVG-Bully Bears Indicator
The FVG-Bully Bears indicator is a powerful tool designed to identify Fair Value Gaps (FVGs) on your TradingView charts. FVGs are price gaps that occur when the market moves sharply, leaving areas where little to no trading activity took place. These gaps often act as key support or resistance zones, making them valuable for traders looking to spot potential reversal or continuation points.
This indicator highlights Bullish FVGs (potential support zones) and Bearish FVGs (potential resistance zones) with customizable boxes and labels, helping you visualize these critical price levels with ease.
Features
Bullish and Bearish FVGs: Detects gaps where price has left untested areas, marking bullish (green) and bearish (red) FVGs.
Customizable Display: Choose to show or hide bullish/bearish FVGs, adjust colors, and control box visibility.
FVG Labels: Optional labels on each FVG box to clearly identify bullish or bearish gaps, with adjustable text size.
Delete Filled FVGs: Automatically removes FVGs once price revisits and fills the gap, keeping your chart clean.
Box Extension: Extend FVG boxes into the future (up to 100 bars) to track unfilled gaps over time.
Performance Optimization: Limits the number of displayed FVG boxes (default: 50) to ensure smooth chart performance.
How It Works
Bullish FVG: Identified when the high of a candle two bars ago is lower than the low of the current candle, indicating a sharp upward move.
Bearish FVG: Identified when the low of a candle two bars ago is higher than the high of the current candle, indicating a sharp downward move.
FVGs are drawn as colored boxes (green for bullish, red for bearish) and can include labels for easy identification.
If enabled, filled FVGs (where price revisits the gap) are deleted to reduce chart clutter.
Settings
FVG Settings
Show Bullish FVGs: Enable/disable bullish FVG boxes (default: enabled).
Show Bearish FVGs: Enable/disable bearish FVG boxes (default: enabled).
Bullish FVG Color: Customize the color and transparency of bullish FVG boxes (default: light green).
Bearish FVG Color: Customize the color and transparency of bearish FVG boxes (default: light red).
Max FVG Boxes: Set the maximum number of FVG boxes displayed (default: 50, range: 1–500).
Extend FVG Boxes (Bars): Extend FVG boxes into the future by a specified number of bars (default: 8, range: 0–100).
Show FVG Labels: Enable/disable text labels on FVG boxes (default: enabled).
Label Size: Choose the size of FVG labels (options: Tiny, Small, Normal, Large, Huge; default: Small).
Delete Filled FVGs: Automatically remove FVGs when price fills the gap (default: enabled).
How to Use
Add the FVG-Bully Bears indicator to your TradingView chart.
Customize the settings to match your trading style (e.g., adjust colors, toggle labels, or change box extensions).
Watch for green (bullish) and red (bearish) FVG boxes:
Bullish FVGs: Potential support zones where price may bounce or consolidate.
Bearish FVGs: Potential resistance zones where price may reverse or stall.
Use FVGs in combination with other indicators (e.g., support/resistance, trendlines) for better trade decisions.
If “Delete Filled FVGs” is enabled, filled gaps will disappear, keeping your chart focused on active FVGs.
Ideal For
Swing Traders: Identify key price zones for entries or exits.
Day Traders: Spot intraday support/resistance levels created by rapid price moves.
Price Action Traders: Use FVGs to confirm market structure and potential reversal points.
Notes
For best performance, keep “Max FVG Boxes” at a reasonable value (e.g., 50) to avoid chart lag.
FVGs are most effective on lower timeframes (e.g., 5m, 15m, 1H) but can be used on any timeframe.
Combine with other tools like volume or trend indicators for a complete trading strategy.
Enjoy trading with FVG-Bully Bears and take advantage of Fair Valu

[Teyo69] T1 Wyckoff Aggressive A/D Setup📘 Overview
The T1 Wyckoff Aggressive A/D Setup is a dual-mode indicator that detects bullish accumulations and bearish distributions using core principles from the Wyckoff Method. It identifies price/volume behavior during Selling/Buying Climaxes, ARs, SOS/SOW, and triggers based on trend structure.
🔍 Features
✅ Automatic detection of:
Automatic Rally (AR)
Automatic Reaction (AR)
Sign of Strength (SOS) or Sign of Weakness (SOW)
🧠 Trend-sensitive logic with linear regression slope filters
⚙️ Configurable options for Reversal vs Trend Following mode
🎯 Smart structure timing filters using barssince() logic
🔊 Volume spike and wide-range candle detection
📊 Visual cues for bullish (green) and bearish (red) backgrounds
🛠 How to Use
Reversal Mode
Triggers early signals after a Climax + AR
Ideal for catching turning points during consolidations
Trend Following Mode
Requires Climax, AR, and confirmation (SOS or SOW)
Waits for structure confirmation before signaling
Use this when you want higher probability trades
⚙️ Configuration
Volume MA Length - Determines baseline volume to detect spikes
Wick % of Candle - Filters candles with long tails for SC/BC
Close Near Threshold - Ensures candles close near high/low
Breakout Lookback - Sets structure breakout level
Structure Threshold - Controls timing window for setups
Signal Option - Switch between Reversal or Trend Following mode
⚠️ Limitations
Doesn't confirm macro structure like full Wyckoff phase labeling (A–E)
May repaint on lower timeframes during volatile candles
Works best when combined with visual range recognition and market context
🧠 Advanced Tips
Use in confluence with:
Volume Profile ranges
Trendlines and supply/demand areas
Ideal timeframes: 8H to 1D for crypto and forex markets
Combine this with LPS/UTAD patterns for refined entries
📝 Notes
SC/AR/SOS = Bullish
BC/AR/SOW = Bearish
Trend coloring adapts background (green = rising slope, red = falling slope)
🛡️ Disclaimer
This tool is a market structure guide, not financial advice. Past behavior does not guarantee future performance. Always use proper risk management.

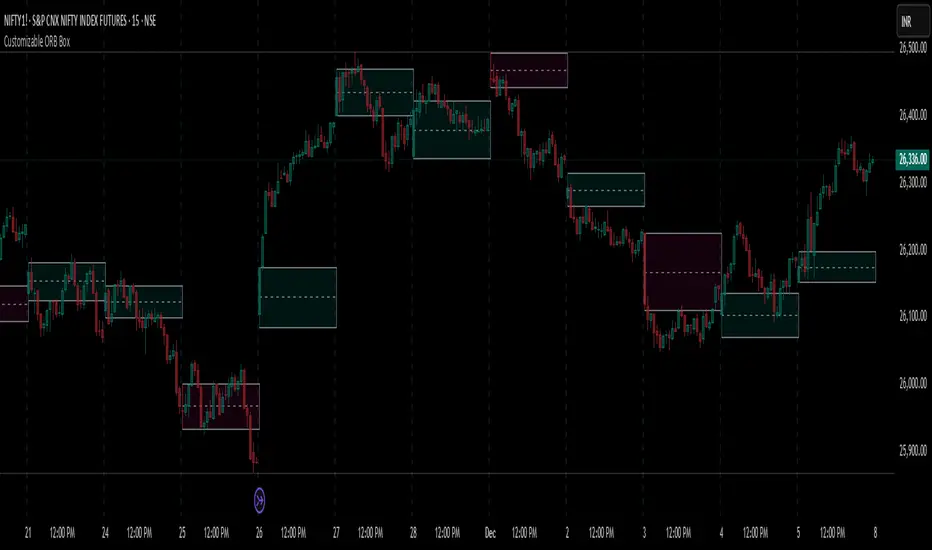
Customizable ORB BoxCustomizable ORB Box
📘 Description
A powerful and flexible Opening Range Breakout (ORB) visualization tool designed for intraday traders. This indicator plots the opening range using either the first candle or a user-defined custom timeframe, and updates in real time.
🔧 Key Features
First Candle Mode – Plots the high/low range of the first candle of each new trading day.
Custom Timeframe Mode – Builds the ORB box live over a chosen duration (e.g., 5, 15, 30 minutes) and finalizes it after the timeframe completes.
Dynamic Box Colors – Bullish and bearish color themes based on range closure direction.
Multi-Day Plotting – Displays ORB boxes across all days, not just today.
Alerts Included – Triggers when price breaks above or below the ORB range.
No repainting – Stable and historical-friendly behavior.
🕒 ETH Compatibility
This indicator respects your TradingView chart settings:
✅ If ETH is enabled, ORB begins with the first ETH candle.
✅ If ETH is disabled, ORB begins with Regular Trading Hours (RTH).
Tip: Control this via the chart’s ⚙️ “Session” settings for your instrument.
💡 How to Use
Use First Candle Mode for classic ORB strategy setups (quick early structure).
Use Custom Timeframe Mode on smaller timeframes (e.g., 3min) for dynamic range-building.
Combine with volume, VWAP, trendlines, or price action for breakout confirmation.
JXMJXRS - Anchor Bias ToolThe Anchor Bias Tool is a precision-based market structure tool designed to help traders visually quantify bias from any significant market event. Rather than relying on subjective trendlines or reactive signals, this tool lets you define a specific candle. Typically tied to a news event, breakout, or key swing point and then monitor how price behaves from that point forward.
You set an anchor candle using a specific date and time (UTC). The tool draws a horizontal anchor line at the closing price of that candle, calculates real-time price deviation from that level as a percentage, and then identifies whether price is in a bullish, bearish, or neutral zone based on how far it has moved from the anchor. This creates a clear, objective method for assessing whether the market is following through on an event or fading it.
Anchor Time (UTC) -
Define the exact candle you want to anchor from typically a reaction to a news event, breakout, or structural shift. All bias calculations begin from this candle’s closing price.
Bias Threshold (%) -
Sets how far price must move away from the anchor to be considered a valid directional bias. For example, 2.0% means price must be at least 2% above or below the anchor to enter bullish or bearish territory.
Show Bias Zones -
Toggles visual background shading on the chart. Green represents bullish bias, red for bearish. Helping you quickly identify where the market stands relative to the anchor.
Show Bias Labels -
Enables or disables the live label showing current bias (Bullish, Bearish, or Neutral) along with the real-time % deviation from the anchor level

Zero Lag MTF On Balance Volume Oscillator by CoffeeShopCryptoIntroducing the Zero Lag Multi Timeframe On Balance Volume Oscillator — the next evolution in volume trading.
Imagine tracking both your trading timeframe and any higher timeframe volume in real time, with absolutely zero lag and no waiting for candles to close.
Whether you’re comparing a 1-minute chart to a 2-hour chart, or a 5-minute to a daily, you’ll instantly see how volume is shifting across timeframes — live, as it happens.
This unique oscillator reveals volume divergences, confirms breakouts, and shows you exactly when buyers or sellers are in control by oscillating around a zero line — with no repainting, ever.
Don’t let delayed tools make you miss the move. Stay ahead of the market with the Zero Lag Multi Timeframe OBV Oscillator — and trade with volume on your side.
(OBV) was created by Joe Granville and introduced in his 1963 book Granville's New Key To Stock Market Profits.
The indicator is significant in history because it was one of the first known indicators to account for positive and negative volume flow.
However the concept and method most people use for today is simply observing a singular current timeframe chart of volume.
The purpose of this volume indicator is to tell you when both the higher timeframe volume and lower timeframe volume are moving in accordance with each other so you have a more clear understanding of the broad picture of the market movement.
This indicator uses the same basic concept of OBV but plots it as an oscillator.
Volume Divergence
What is a Volume Divergence:
A volume divergence takes place when the spread between the HTF and LTF volume isnt reaching higher highs or lower lows while price is reaching higher highs and lower lows. This is more accurate than noting divergence peaks from other indicators like the RSI or MACD because those are giving you an average but the OBV in its "RAW" setting is giving you actual bullish or bearish volume spikes per candle.
How to trade a Volume Divergence:
When you note either a bullish or bearish volume divergence you need to switch to a divergence trading strategy.
BULLISH DIVERGENCE STRATEGY
1.Zone out the range of candles that caused the divergence
2. If this is a bullish divergence, find the swing high on the volume between point A and B and mark that price level
3. This level should play out as a new support level for price.
4. Let the price break and retest this level
OR
BEARISH DIVERGENCE STRATEGY
1.Zone out the range of candles that caused the divergence
2. If this is a bearish divergence, find the swing low on the volume between point A and B and mark that price level
3. This level should play out as a new resistance level for price.
4. Let the price break and retest this level.
Confirming Trendline Breaks
While following short term trendlines on price, you can detect when price trends are broken.
If volume still supports the previous trend when the trendline is broken, you wait for price to react to a previous support or resistance level, or you want for price to retrace to a fair value gap and follow the trend that follows the supporting volume.
Confirming Trend Direction
Confirming a trend direction means that both the high timeframe and low timeframe trend agree with each other while price is moving away from a previously tested support or resistance area. Once price moves out of these key levels and the oscillator confirms a particular direction, you have the start of your new trend and are open for trades.
Volume Smoothing Settings
You can look at Volume in different ways. Commonly you want to smooth it to match your trading style. So if price is trending between range levels, you want to see HOW its trending. If your go to is to use an EMA, SMA, WMA, or other smoothing style, then set the ZLMTF OBV to match this in the "smoothing settings.
Here are the different ways you can set it and how it appears on the chart.
Raw Volume
This gives you the Raw volume calculations with no smoothing taking place.
(Commonly you would use this as price intercepts key levels.
SMA Smoothed Volume
This gives you the Raw volume smoothed over an SMA calculation which you would watch if you commonly use Smoothed Moving Averages on your chart while price is not near a support or resistance area.
Other Smoothing Outputs
You also have the ability to choose between EMA, SMMA, WMA, and VWAM types of smoothing to compare to the smoothing you use on your chart.

IU Inside/Harami candlestick patternDESCRIPTION
The IU Inside/Harami Candlestick Pattern indicator is designed to detect bullish and bearish inside bar formations, also known as Harami patterns. This tool gives users flexibility by allowing pattern detection based on candle wicks, bodies, or a combination of both. It highlights detected patterns using colored boxes and optional text labels on the chart, helping traders quickly identify areas of consolidation and potential reversals.
USER INPUTS :
Pattern Recognition Based on =
Choose between "Wicks", "Body", or "Both" to determine how the inside candle pattern is identified.
Show Box =
Toggle the appearance of colored boxes that highlight the pattern zone.
Show Text =
Toggle on-screen labels for "Bullish Inside" or "Bearish Inside" when patterns are detected.
INDICATOR LOGIC :
Bullish Inside Bar (Harami) is detected when:
* The current candle's high is lower and low is higher than the previous candle (wick-based),
* or the current candle’s open and close are inside the previous candle’s body (body-based),
* and the current candle is bullish while the previous is bearish.
Bearish Inside Bar (Harami) is detected when:
* The current candle's high is lower and low is higher than the previous candle (wick-based),
* or the current candle’s open and close are inside the previous candle’s body (body-based),
* and the current candle is bearish while the previous is bullish.
The user can choose wick-based, body-based, or both logics for pattern confirmation.
Boxes are drawn between the highs and lows of the pattern, and alert messages are generated upon confirmation.
Optional labels show the pattern name for quick visual identification.
WHY IT IS UNIQUE :
Offers three different logic modes: wick-based, body-based, or combined.
Highlights patterns visually with customizable boxes and labels.
Includes built-in alerts for immediate notifications.
Uses clean and transparent plotting without repainting.
HOW USER CAN BENEFIT FROM IT :
Receive real-time alerts when Inside/Harami patterns are formed.
Use the boxes and text labels to spot price compression zones and breakout potential.
Combine it with other tools like trendlines or support/resistance for enhanced accuracy.
Suitable for scalpers, swing traders, and price action traders looking to trade inside bar breakouts or reversals.
DISCLAIMER :
This indicator is not financial advice, it's for educational purposes only highlighting the power of coding( pine script) in TradingView, I am not a SEBI-registered advisor. Trading and investing involve risk, and you should consult with a qualified financial advisor before making any trading decisions. I do not guarantee profits or take responsibility for any losses you may incur.

Momentum Regression [BackQuant]Momentum Regression
The Momentum Regression is an advanced statistical indicator built to empower quants, strategists, and technically inclined traders with a robust visual and quantitative framework for analyzing momentum effects in financial markets. Unlike traditional momentum indicators that rely on raw price movements or moving averages, this tool leverages a volatility-adjusted linear regression model (y ~ x) to uncover and validate momentum behavior over a user-defined lookback window.
Purpose & Design Philosophy
Momentum is a core anomaly in quantitative finance — an effect where assets that have performed well (or poorly) continue to do so over short to medium-term horizons. However, this effect can be noisy, regime-dependent, and sometimes spurious.
The Momentum Regression is designed as a pre-strategy analytical tool to help you filter and verify whether statistically meaningful and tradable momentum exists in a given asset. Its architecture includes:
Volatility normalization to account for differences in scale and distribution.
Regression analysis to model the relationship between past and present standardized returns.
Deviation bands to highlight overbought/oversold zones around the predicted trendline.
Statistical summary tables to assess the reliability of the detected momentum.
Core Concepts and Calculations
The model uses the following:
Independent variable (x): The volatility-adjusted return over the chosen momentum period.
Dependent variable (y): The 1-bar lagged log return, also adjusted for volatility.
A simple linear regression is performed over a large lookback window (default: 1000 bars), which reveals the slope and intercept of the momentum line. These values are then used to construct:
A predicted momentum trendline across time.
Upper and lower deviation bands , representing ±n standard deviations of the regression residuals (errors).
These visual elements help traders judge how far current returns deviate from the modeled momentum trend, similar to Bollinger Bands but derived from a regression model rather than a moving average.
Key Metrics Provided
On each update, the indicator dynamically displays:
Momentum Slope (β₁): Indicates trend direction and strength. A higher absolute value implies a stronger effect.
Intercept (β₀): The predicted return when x = 0.
Pearson’s R: Correlation coefficient between x and y.
R² (Coefficient of Determination): Indicates how well the regression line explains the variance in y.
Standard Error of Residuals: Measures dispersion around the trendline.
t-Statistic of β₁: Used to evaluate statistical significance of the momentum slope.
These statistics are presented in a top-right summary table for immediate interpretation. A bottom-right signal table also summarizes key takeaways with visual indicators.
Features and Inputs
✅ Volatility-Adjusted Momentum : Reduces distortions from noisy price spikes.
✅ Custom Lookback Control : Set the number of bars to analyze regression.
✅ Extendable Trendlines : For continuous visualization into the future.
✅ Deviation Bands : Optional ±σ multipliers to detect abnormal price action.
✅ Contextual Tables : Help determine strength, direction, and significance of momentum.
✅ Separate Pane Design : Cleanly isolates statistical momentum from price chart.
How It Helps Traders
📉 Quantitative Strategy Validation:
Use the regression results to confirm whether a momentum-based strategy is worth pursuing on a specific asset or timeframe.
🔍 Regime Detection:
Track when momentum breaks down or reverses. Slope changes, drops in R², or weak t-stats can signal regime shifts.
📊 Trade Filtering:
Avoid false positives by entering trades only when momentum is both statistically significant and directionally favorable.
📈 Backtest Preparation:
Before running costly simulations, use this tool to pre-screen assets for exploitable return structures.
When to Use It
Before building or deploying a momentum strategy : Test if momentum exists and is statistically reliable.
During market transitions : Detect early signs of fading strength or reversal.
As part of an edge-stacking framework : Combine with other filters such as volatility compression, volume surges, or macro filters.
Conclusion
The Momentum Regression indicator offers a powerful fusion of statistical analysis and visual interpretation. By combining volatility-adjusted returns with real-time linear regression modeling, it helps quantify and qualify one of the most studied and traded anomalies in finance: momentum.
