Golden Cross Screener [Pineify]Golden Cross Screener Pineify – Multi-Symbol Trend Detection Screener for TradingView
Discover the Golden Cross Screener Pineify for TradingView: a multi-symbol, multi-timeframe indicator for crypto and other assets. Customizable Golden Cross detection, robust algorithm, and intuitive screener design for smarter portfolio trend analysis.
Key Features
Multi-symbol screening across major cryptocurrencies or assets – BTCUSD, ETHUSD, XRPUSD, USDT, BNB, SOLUSD, DOGEUSD, TRXUSD (fully customizable).
Multi-timeframe analysis (e.g., 1m, 5m, 10m, 30m), enabling robust trend detection from scalp to swing.
Customizable Moving Average settings for both Fast and Slow MA (source and length).
Efficient screener table, highlighting Golden Cross events and current asset trends in one panel.
Visual cues for bullish, bearish, and cross states using intuitive color-coding and labels.
Flexible symbol and timeframe inputs to tailor the screener to any portfolio or watchlist.
How It Works
The Golden Cross Screener Pineify leverages the classic Golden Cross methodology—a bullish trend signal triggered when a shorter-term moving average crosses above a longer-term moving average. To improve robustness, you are empowered to configure both Fast MA and Slow MA periods and sources, making the detection logic applicable to any symbol, timeframe, or asset class.
Internally, the script runs dedicated calculations on each chosen symbol and timeframe, generating independent signals using exponential moving averages (EMA). Using the TradingView `request.security` function, it fetches and processes price data for up to eight portfolio assets on four timeframes, displaying the detected Golden Cross, Bullish, or Bearish states in a central screener table.
Trading Ideas and Insights
Spot emerging bullish or bearish trends across your favorite crypto pairs or trading assets in real time.
Capture prime opportunities when multiple assets align with Golden Cross signals—ideal for portfolio rebalancing or rotational strategies.
Analyze trend consistency by monitoring cross events at multiple timeframes for a given asset.
Swiftly identify when short-term and long-term momentum diverge—flagging potential reversals or trend initiations.
The Golden Cross Screener Pineify is not just a trend signal; it’s a holistic multi-asset scanner built for traders who know the power of combining technical breadth with agile timing.
How Multiple Indicators Work Together
This screener stands out with its modular approach: each asset/timeframe pair is monitored in isolation, yet displayed collectively for multidimensional market insight. Each symbol’s price action is processed through independently configured EMAs—Fast and Slow—whose crossovers are analyzed for directional bias. The implementation’s real innovation is in its screener table engine: it aggregates signals, synchronizes timeframes, and color-codes market states, allowing users to see confluences, divergences, and sector trends at a glance.
Combining Golden Cross detection with customizable moving averages and flexible multi-timeframe, multi-symbol scanning means users can fine-tune sensitivity, focus on specific signals, and adapt screener logic for scalping, swing trading, or investing.
Unique Aspects
True multi-symbol screener within the TradingView indicator framework.
Full customization of screener assets, timeframes, and moving averages.
Advanced, efficient use of TradingView table for clear, actionable visualization.
No dependency on standard, static MA settings—adjust everything to match your strategy.
Big-picture and granular trend detection in one tool, designed for both active traders and portfolio managers.
How to Use
Add the Golden Cross Screener Pineify to your TradingView chart.
Choose up to eight symbols—crypto, stock, forex, or custom assets.
Set four timeframes for screening, from lower to higher intervals.
Adjust moving average sources (price, close, etc.) and period lengths for both Fast and Slow MAs to suit your trading style.
Interpret table cells: clear labels and color indicate Golden Cross (trend shift), Bullish (uptrend), Bearish (downtrend) states for each symbol/timeframe.
React to signal alignments—deploy or rebalance positions, increase alert sensitivity, or backtest sequence confluences.
Customization
The indicator’s inputs panel gives full control:
Select which symbols to screen, making it perfect for any asset watchlist.
Pick the desired timeframes—mix daily, hourly, or minute-based intervals.
Adjust Fast and Slow MA settings: switch source type, change period length, and fine-tune detection logic as needed.
Style your screener table via TradingView settings (colors, font sizes, alignment).
Every element is customizable—adapt the Golden Cross Screener Pineify for your specific portfolio, trading timeframe, and strategy focus.
Conclusion
The Golden Cross Screener Pineify elevates multi-symbol trend detection to a new level on TradingView. By combining configurable Golden Cross logic with a powerful screener engine, it serves both precision and broad market insight—crucial for agile traders and strategic portfolio managers. Whether you’re tracking crypto pairs, stocks, forex, or a mix, this tool transforms static trend analysis into an active, multi-dimensional trading edge.
Buscar en scripts para "GOLD"

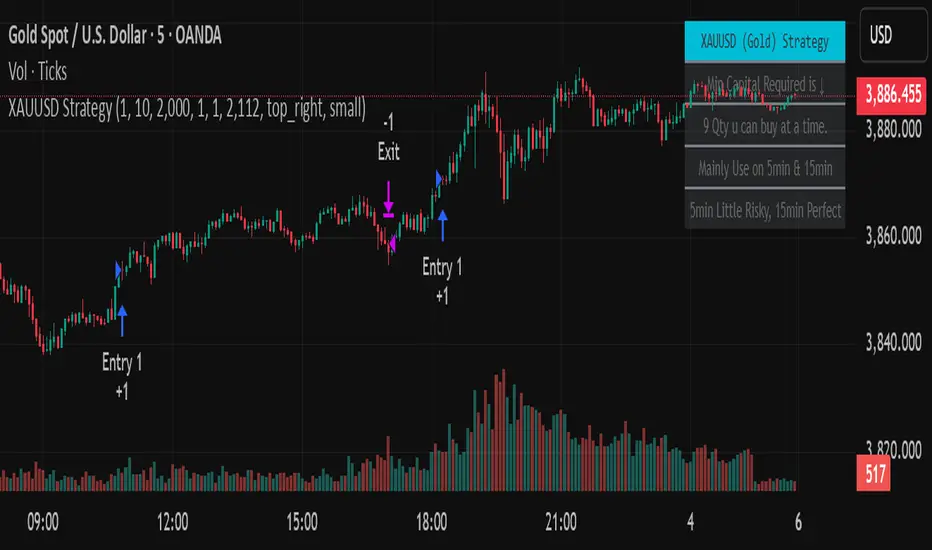
Golden StrategyTitle: XAUUSD (Gold) Smart Entry Strategy with Dynamic Scaling
Description:
This is a precision-based entry strategy for XAUUSD (Gold), optimized for lower timeframes like the 5-minute and 15-minute charts. It uses a custom logic engine to detect potential reversals and applies dynamic scaling (pyramiding) to build positions strategically based on price behavior.
🔍 Key Features:
✅ Smart entry logic for trend shifts
✅ Configurable position scaling up to 7 level
✅ Built-in capital efficiency for smaller accounts
✅ Backtest window control for historical testing
✅ Compact on-screen table for user guidance
Timeframes Recommended:
🔸 15-minute: Best balance of risk and consistency
🔸 5-minute: More frequent signals, slightly higher risk
⚠️ Important Disclaimer
This script is for educational and informational purposes only. It is not financial advice or a signal service. Trading carries risk, and past performance does not guarantee future results. Use at your own discretion and always manage risk appropriately.
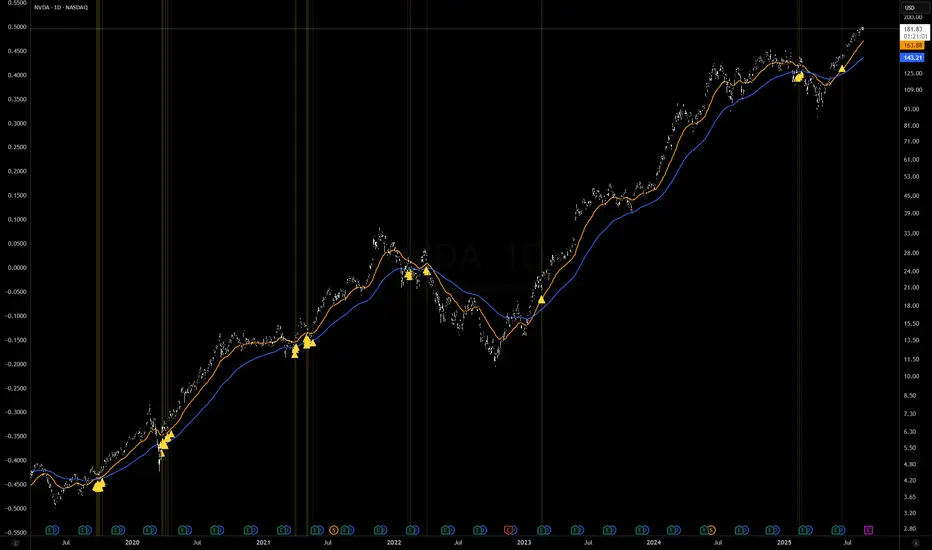
Golden Cross and Death Cross IndicatorThis screener identifies key technical signals known as the Golden Cross and Death Cross on any TradingView chart. The Golden Cross occurs when the 50-day simple moving average (SMA) crosses above the 200-day SMA, signaling a potential bullish trend or buy opportunity. Conversely, the Death Cross happens when the 50-day SMA crosses below the 200-day SMA, indicating a potential bearish trend or sell signal.
This indicator visually plots both SMAs on the price chart and marks the crossover points with clear green (buy) and red (sell) triangles. It also includes alert conditions for both signals, enabling traders to receive real-time notifications when these important trends develop.
Ideal for swing traders, investors, and technical analysts, this screener helps spot long-term trend shifts effectively, improving timing for entries and exits. It serves as a reliable tool to complement broader trading strategies focused on momentum and trend-following approaches.

Golden Launch Pad🔰 Golden Launch Pad
This indicator identifies high-probability bullish setups by analyzing the relationship between multiple moving averages (MAs). A “Golden Launch Pad” is formed when the following five conditions are met simultaneously:
📌 Launch Pad Criteria (all must be true):
MAs Are Tightly Grouped
The selected MAs must be close together, measured using the Z-score spread — the difference between the highest and lowest Z-scores of the MAs.
Z-scores are calculated relative to the average and standard deviation of price over a user-defined window.
This normalizes MA distance based on volatility, making the signal adaptive across different assets.
MAs Are Bullishly Stacked
The MAs must be in strict ascending order: MA1 > MA2 > MA3 > ... > MA(n).
This ensures the short-term trend leads the longer-term trend — a classic sign of bullish structure.
All MAs Have Positive Slope
Each MA must be rising, based on a lookback period that is a percentage of its length (e.g. 30% of the MA’s bars).
This confirms momentum and avoids signals during sideways or weakening trends.
Price Is Above the Fastest MA
The current close must be higher than the first (fastest) moving average.
This adds a momentum filter and reduces false positives.
Price Is Near the MA Cluster
The current price must be close to the average of all selected MAs.
Proximity is measured in standard deviations (e.g. within 1.0), ensuring the price hasn't already made a large move away from the setup zone.
⚙️ Customization Options:
Use 2 to 6 MAs for the stack
Choose from SMA, EMA, WMA, VWMA for each MA
Adjustable Z-score window and spread threshold
Dynamic slope lookback based on MA length
Volatility-adjusted price proximity filter
🧠 Use Case:
This indicator helps traders visually and systematically detect strong continuation setups — often appearing before breakouts or sustained uptrends. It works well on intraday, swing, and positional timeframes across all asset classes.
For best results, combine with volume, breakout structure, or multi-timeframe confirmation.
Hassi XAUUSD STRATEGY BOTGold (XAUUSD) 15m trend+momentum based signals with EMA(9/21/200), RSI, custom ADX, ATR-based SL/TP & alerts
Works on XAUUSD 15m.
Entry: EMA9/21 cross + price relative to EMA200 + RSI filter + custom ADX trend strength.
Risk: default SL=1.5×ATR, TP=2×ATR (editable).
Notes: No financial advice. Backtest before live use. Avoid high-impact news whipsaws.

Golden Sweep - ZTFGolden Sweep - ZTF: Multi-Confluence Reversal Detection System
Purpose & Methodology:
The Golden Sweep combines six distinct market structure analysis methods into a unified confluence system designed to identify high-probability reversal points at inverse Fair Value Gaps (iFVGs). Rather than relying on single-indicator signals, this system requires simultaneous confirmation across multiple independent market dimensions to filter out noise and reduce false signals.
Core Logic & Technical Approach:
1. Fair Value Gap Analysis Foundation
The system begins by detecting standard Fair Value Gaps (price inefficiencies where gaps exist between candle wicks) and monitors when price returns to fill these gaps, creating inverse FVGs. This forms the base signal trigger.
2. Liquidity Sweep Confirmation Engine
Uses pivot-based swing detection to identify when price has recently swept through key support/resistance levels, indicating stop-loss hunting activity. The algorithm tracks recent liquidity events within a configurable lookback period and correlates them with iFVG formations.
3. VWAP Statistical Positioning
Calculates real-time Volume Weighted Average Price with standard deviation bands. Signals are only validated when price is positioned at statistically significant VWAP deviations (configurable zones), ensuring alignment with institutional flow patterns.
4. Balanced Price Range (BPR) Structure Analysis
Detects overlapping bullish and bearish Fair Value Gaps that create consolidation zones. The system identifies when new iFVGs form within or near these balanced ranges, indicating potential breakout reversals from established accumulation/distribution areas.
5. Turtle Soup Reversal Pattern Recognition
Implements Larry Connors' turtle soup methodology to detect false breakouts. Identifies when price penetrates recent highs/lows but closes back within the prior range, indicating failed breakout attempts that often precede strong reversals.
6. Exhaustion Signal Detection
Employs dual-timeframe momentum analysis using Williams %R methodology with optimized smoothing parameters. Detects overbought/oversold exhaustion conditions and confirms when momentum shifts from extreme readings back toward equilibrium, indicating potential trend exhaustion reversals.
Confluence Requirement Logic:
A Golden Sweep signal only triggers when ALL enabled filters simultaneously confirm within their respective lookback periods. This six-dimensional approach significantly reduces signal frequency while increasing reliability by ensuring multiple market forces align before generating alerts.
Session & Timing Integration:
Incorporates session-based filtering to account for varying market dynamics across trading sessions (NY Open, London Close, etc.), as different sessions exhibit distinct liquidity and volatility characteristics.
Implementation Notes:
All calculations use confirmed bar data to prevent repainting
Configurable lookback periods allow adaptation to different timeframes and market conditions
Visual overlays are optional and independent of signal generation logic
Built-in risk management through signal rarity and confluence requirements
This systematic approach addresses the common problem of indicator overload by creating a structured framework where multiple analysis methods must agree before signaling, resulting in fewer but higher-quality trade opportunities.
⚠️ Disclaimer: This indicator is for educational purposes only. It does not constitute financial advice or a recommendation to buy or sell any security. Trading involves risk — always do your own research and use proper risk management.

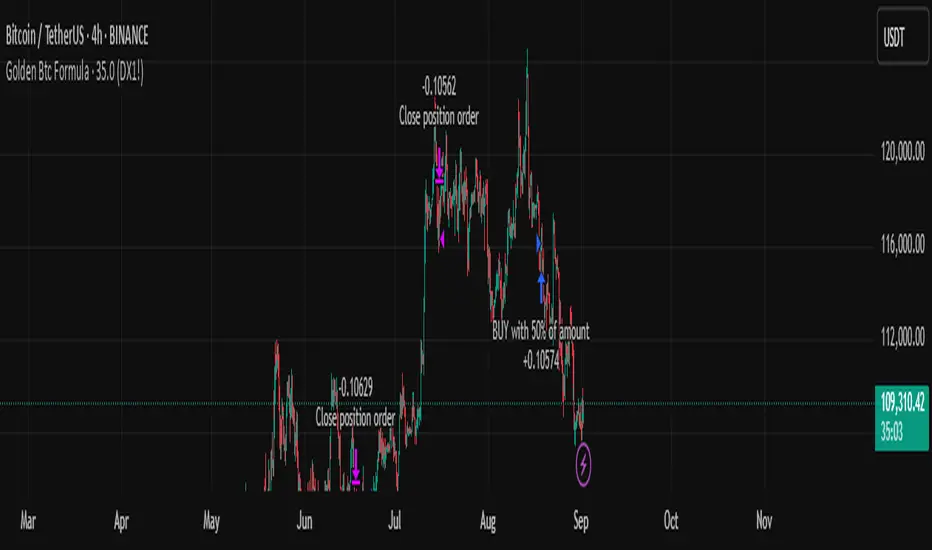
Golden Btc Formula🏆 Golden BTC Formula Bot
Introducing the Golden BTC Formula Bot — a smart trading strategy built specifically for Bitcoin on TradingView, designed to combine algorithmic precision with solid risk management.
📊 Backtest Overview:
The backtest shows that starting with a $10,000 balance and using a position size of 50% of equity per trade, the bot has delivered impressive, consistent returns over the tested period. The equity curve illustrates steady growth, minimal drawdowns, and controlled risk exposure — proving its robustness even in volatile market conditions.
⚙️ How It Works:
The bot automatically detects high-probability entries based on carefully tuned indicators and price action logic.
Targets and stop-loss levels are dynamically calculated to adapt to market volatility.
Built entirely in Pine Script for TradingView, so you can watch trades live or backtest historically.
🛡️ Risk Management Tips:
Even with a strong backtest, real trading always involves risk. Here’s how to use the Golden BTC Formula Bot responsibly:
✅ Use only part of your capital (e.g., 30–50%) for the bot.
✅ Set reasonable leverage (or stick to spot trading).
✅ Withdraw profits periodically instead of letting them fully compound forever.
✅ Always backtest and forward-test before going live, and consider running it in paper trading mode at first.
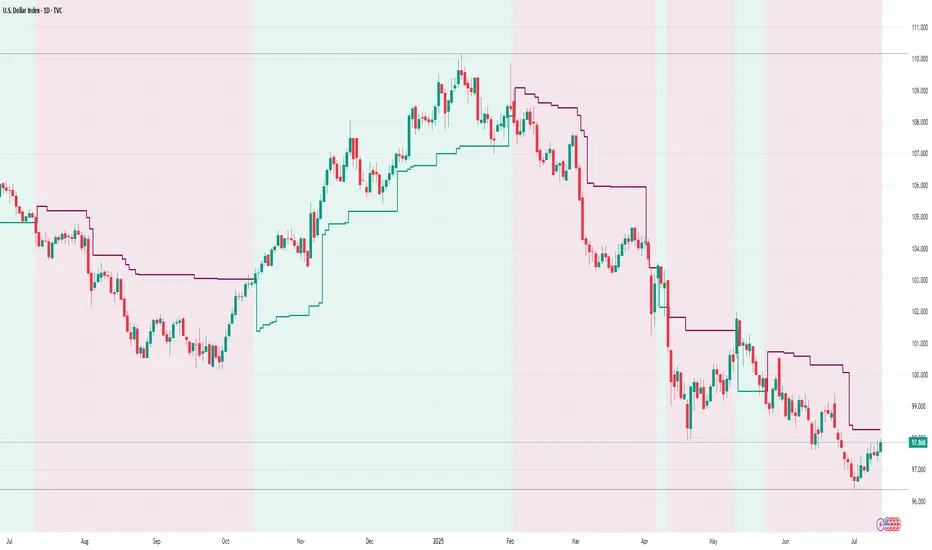
Golden Ratio Trend Persistence [EWT]Golden Ratio Trend Persistence
~~~~~~~~~~~~~~~~~~~~~~~~~~~~~~~~~~~~~~~~~~~~
Overview
The Golden Ratio Trend Persistence is a dynamic tool designed to identify the strength and persistence of market trends. It operates on a simple yet powerful premise: a trend is likely to continue as long as it doesn't retrace beyond the key Fibonacci golden ratio of 61.8%.
This indicator automatically identifies the most significant swing high or low and plots a single, dynamic line representing the 61.8% retracement level of the current move. This line acts as a "line in the sand" for the prevailing trend. The background color also changes to provide an immediate visual cue of the current market direction.
~~~~~~~~~~~~~~~~~~~~~~~~~~~~~~~~~~~~~~~~~~~~
The Power of the Golden Ratio (61.8%)
The golden ratio (ϕ≈1.618) and its inverse (0.618, or 61.8%) are fundamental mathematical constants that appear throughout nature, art, and science, often representing harmony and structure. In financial markets, this ratio is a cornerstone of Fibonacci analysis and is considered one of the most critical levels for price retracements.
Market movements are not linear; they progress in waves of impulse and correction. The 61.8% level often acts as the ultimate point of support or resistance. A trend that can hold this level demonstrates underlying strength and is likely to persist. A breach of this level, however, suggests a fundamental shift in market sentiment and a potential reversal.
~~~~~~~~~~~~~~~~~~~~~~~~~~~~~~~~~~~~~~~~~~~~
How to Use This Indicator
This indicator is designed for clarity and ease of use.
Identifying the Trend : The visual cues make the current trend instantly recognizable.
A teal line with a teal background signifies a bullish trend. The line acts as dynamic support.
A maroon line with a maroon background signifies a bearish trend. The line acts as dynamic resistance.
Confirming Trend Persistence : As long as the price respects the plotted level, the trend is considered intact.
In an uptrend, prices should remain above the teal line. The indicator will automatically adjust its anchor to new, higher lows, causing the support line to trail the price.
In a downtrend, prices should remain below the maroon line.
Spotting Trend Reversals : The primary signal is a trend reversal, which occurs when the price closes decisively beyond the plotted level.
Potential Sell Signal : When the price closes below the teal support line, it indicates that buying pressure has failed, and the uptrend is likely over.
Potential Buy Signal : When the price closes above the maroon resistance line, it indicates that selling pressure has subsided, and a new uptrend may be starting.
Think of this tool as an intelligent, adaptive trailing stop that is based on market structure and the time-tested principles of Fibonacci analysis.
~~~~~~~~~~~~~~~~~~~~~~~~~~~~~~~~~~~~~~~~~~~~
Input Parameters
You can customize the indicator's sensitivity through the following inputs in the settings menu:
Pivot Lookback Left : This number defines how many bars to the left of a candle must be lower (for a pivot high) or higher (for a pivot low) to identify a potential swing point. A higher value will result in fewer, but more significant, pivots being detected.
Pivot Lookback Right : This defines the number of bars that must close to the right before a swing point is confirmed. This parameter prevents the indicator from repainting. A higher value increases confirmation strength but also adds a slight lag.
Fibonacci Ratio : While the default is the golden ratio (0.618), you can adjust this to other key Fibonacci levels, such as 0.5 (50%) or 0.382 (38.2%), to test for different levels of trend persistence.
Adjusting these parameters allows you to fine-tune the indicator for different assets, timeframes, and trading styles, from short-term scalping to long-term trend following.
Golden Crossover Momentum Check📊 Golden Cross Momentum Screener — Summary
🔍 What It Does
This indicator identifies Golden Cross events — where the 50 EMA crosses above the 200 EMA, signaling a potential long-term trend reversal — and evaluates the momentum strength to help determine whether price is likely to:
Surge immediately (Group B), or
Retrace first (Group A)
It uses 5 momentum-confirming conditions to score the quality of the breakout and display a single label on the chart with a classification.
✅ Momentum Conditions Validated
RSI > 60 and rising – Indicates bullish buying pressure
MACD Histogram > 0 and rising – Confirms increasing momentum
Volume > 2× 20-day average – Validates participation on the breakout
ADX > 25 – Measures trend strength
Price is >5% above 200 EMA – Confirms price extension above long-term trend
Each passing condition adds 1 point to the momentum score (0–5).
📈 How to Use
Watch for a Golden Cross signal (triangle appears below candle)
If momentum score ≥ 4, the script labels the setup as:
"🚀 Surge Likely (Group B)" — consider immediate breakout entries
If score is 2–3, labeled:
"🔄 Pullback Likely (Group A)" — expect retest/consolidation before continuation
If score < 2, labeled:
"❌ No Momentum Confirmed" — avoid or wait for confirmation

Golden Key: Opening Channel DashboardGolden Key: Opening Channel Dashboard
Complementary to the original Golden Key – The Frequency
Upgrade of 10 Monday's 1H Avg Range + 30-Day Daily Range
This indicator provides a structured dashboard to monitor the opening channel range and related metrics on 15m and 5m charts. Built to work alongside the Golden Key methodology, it focuses on pip precision, average volatility, and SL sizing.
What It Does
Detects first 4 candles of the session:
15m chart → first 4 Monday candles (1 hour)
5m chart → first 4 candles of each day (20 minutes)
Calculates pip range of the opening move
Stores and averages the last 10 such ranges
Calculates daily range average over 10 or 30 days
Generates SL size based on your multiplier setting
Auto-adjusts for FX, JPY, and XAUUSD pip sizes
Displays all values in a clean table in the top-right
How to Use It
Add to a 15m or 5m chart
Compare the current opening range to the average
Use the daily average to assess broader volatility
Define SL size using the opening range x multiplier
Customize display colors per table row
About This Script
This is not a visual box-style indicator. It is designed to complement the original “Golden Key – The Frequency” by focusing on metric output. It is also an upgraded version of the earlier "10 Monday’s 1H Avg Range" script, now supporting multi-timeframe logic and additional customization.
Disclaimer
This is a technical analysis tool. It does not provide trading advice. Use it in combination with your own research and strategy.

Gold ValuationGold Value Index
The Gold Value Index (GVI) is a macro-driven oscillator that estimates the relative value of gold based on real-time movements in the US Dollar Index (DXY) and the 10-Year US Treasury Yield (US10Y). It helps traders contextualize gold’s price within broader macroeconomic pressure — identifying when gold may be over- or undervalued relative to these key drivers.
How It Works – Macro Inputs:
DXY (US Dollar Index): Typically moves inversely to gold. A rising dollar suggests downward pressure on gold value.
US10Y Yield: Higher yields increase the opportunity cost of holding gold, often leading to weaker gold prices.
Both inputs are Z-score normalized and inverted to reflect their typical negative correlation with gold. When combined, they form a single, scaled index from 0 (undervalued) to 100 (overvalued).
Why Use This Tool?
Gold reacts to macro forces as much as technical ones. The GVI blends these inputs into a clear, visual gauge to:
Anticipate mean-reversion setups.
Avoid emotionally-driven trades in extreme macro conditions.
Enhance timing by understanding gold's macro context.
Important Notes:
Data sources include ICEUS:DXY and TVC:US10Y via TradingView.
Code is protected — this is a private, invite-only script.
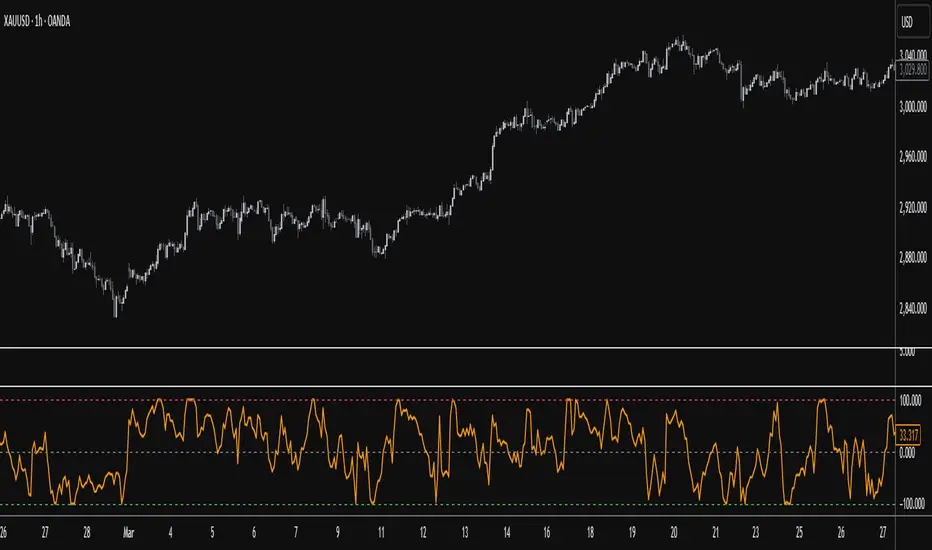
Golden Ratio Oscillator (GRO)Here is a description for your Golden Ratio Oscillator (GRO) indicator:
Golden Ratio Oscillator (GRO) - Overview
The Golden Ratio Oscillator (GRO) is a powerful technical analysis tool that leverages the Golden Ratio (1.618) to smooth price action and generate a normalized momentum-based oscillator. By applying a Golden Ratio-based Exponential Moving Average (EMA), the indicator offers a unique way to analyze price trends, overbought/oversold conditions, and potential reversals.
How It Works
Golden Ratio Smoothing:
The indicator applies a smoothing function based on the Golden Ratio (Φ = 1.618) to the closing price.
This creates a dynamically smoothed price curve, reducing noise while maintaining responsiveness to price changes.
Normalization for Oscillation:
The smoothed price is normalized between -1 and 1, making it a bounded oscillator that fluctuates within a fixed range.
This allows traders to easily interpret overbought and oversold conditions.
Overbought & Oversold Levels:
The oscillator includes two key horizontal reference lines:
Overbought Level (+1.0) – Indicates potential reversal zones from bullish momentum.
Oversold Level (-1.0) – Suggests possible price bottoms and reversal opportunities.
The area between these levels is visually highlighted for better clarity.
How to Use the Indicator
Trend & Momentum Analysis:
When GRO is rising, it signals increasing bullish momentum.
When GRO is falling, it indicates weakening price action or bearish momentum.
Overbought & Oversold Zones:
A reading near +1.0 suggests the market is overbought and could face selling pressure.
A reading near -1.0 indicates an oversold condition, hinting at a potential buying opportunity.
Divergence Detection:
If price makes a new high, but GRO fails to confirm, it signals a potential bearish divergence (weakening trend).
If price makes a new low while GRO holds higher, it suggests bullish divergence (potential reversal).
Customizable Parameters:
Smoothing Length: Defines the responsiveness of the indicator (default: 14).
Overbought/Oversold Levels: Can be adjusted to fine-tune entry and exit points.
Why Use the Golden Ratio Oscillator?
✅ Golden Ratio-Based Smoothing: Reduces noise while maintaining trend sensitivity.
✅ Dynamic Normalization: Adapts to market conditions, making it more intuitive.
✅ Clear Overbought/Oversold Signals: Helps in spotting potential reversals with confidence.
✅ Versatile Trading Applications: Useful for trend confirmation, reversals, and divergence analysis.

Golden Time ErfanThe "Golden Time" Indicator is a custom-built TradingView tool designed to assist traders by highlighting two critical trading time windows: the New York session open and a specific strategy-based time known as Golden Time.

Auto Fib GOLDEN TARGET Golden Target Auto Fib Indicator
Unlock the power of automatic Fibonacci analysis with the Golden Target Auto Fib Indicator. Designed for traders who want to effortlessly incorporate Fibonacci retracement levels into their strategy, this indicator dynamically calculates and plots key Fibonacci levels based on recent price action.
Key Features:
Automatic Fibonacci Levels: Automatically determines the critical Fibonacci retracement levels using the most recent high and low over a user-defined period.
Customizable Length: Adjust the period over which the Fibonacci levels are calculated to match your trading style and market conditions.
Dynamic Plotting: Fibonacci levels are plotted in real-time, reflecting current market conditions and potential support and resistance areas.
Color-Coded Levels: Distinguishes between different Fibonacci levels with distinct colors, making it easy to identify significant price points at a glance.
Target Labels (Optional): Optionally display labels next to the Fibonacci levels to help identify potential target zones and better visualize the key levels.
How It Works:
The Golden Target Auto Fib Indicator calculates Fibonacci retracement levels based on the highest high and lowest low over a specified length. The levels plotted include key Fibonacci ratios: 23.6%, 38.2%, 61.8%, and the 100% extension, providing valuable insights into potential support and resistance areas as well as price targets.
Usage:
Adjust Settings: Set the Length parameter to define the period over which Fibonacci levels are calculated.
Analyze Levels: Observe the plotted Fibonacci levels and their color-coded lines to identify potential price retracement zones and target areas.
Incorporate Into Strategy: Use these levels in conjunction with your trading strategy to make more informed decisions on entry and exit points.
Whether you're a day trader or a swing trader, the Golden Target Auto Fib Indicator simplifies Fibonacci analysis and integrates seamlessly into your TradingView charts, helping you make more precise trading decisions.
Get started today and enhance your technical analysis with the Golden Target Auto Fib Indicator!
Feel free to adjust the description according to the specific features or customization options of your indicator.

Golden Swap (Zeiierman)█ Overview
The Golden Swap indicator, as designed by Zeiierman, focuses on identifying reversal points around the key levels indicated by the indicator. This pattern works by analyzing the relationship between current and past price movements, considering factors like price symmetry, baseline boundaries, and precision pin bar formations. It can offer insights into potential market reversals, allowing for more precise entries and exits.
█ How It Works
Golden Swap Long
In a market with bullish momentum, we expect the price to dip a bit before it continues to rise again. This dip is like a small retreat in an overall march upwards. So, the pattern aims to assess whether the current period's dip is relatively shallow, indicating that the overall bullish momentum remains robust despite temporary price fluctuations.
Golden Swap Short
In a market with bearish momentum (indicating selling pressure or bearish sentiment), we may still see the price rise a bit before continuing its drop. This temporary rise is like a slight bounce in an overall downward movement. In simpler terms, even when the price bounces up a bit, it's not strong enough to overcome the recent pressure of selling. The sellers are still dominating, and the price will likely continue to drop.
█ The signal is reinforced by symmetry, BaselineBound criteria, and a bearish Precision PinBar.
⚪ Symmetry in Price Movements: The pattern uses the Symmetry Precision filter to analyze the symmetry of recent price movements. This helps in determining the likelihood of a reversal. A high degree of symmetry suggests a more reliable reversal signal.
⚪ BaselineBound Criteria: This component involves the BaselineBound Threshold, which acts as a filter to validate the strength of the potential reversal. Bullish and bearish conditions are assessed based on how the current close price compares to a calculated range around the high and low of the previous period.
⚪ Precision PinBar Analysis: The pattern also incorporates the Precision PinBar filter, which evaluates the characteristics of the recent price bars. A Precision PinBar is a candlestick with a small body and a long tail, indicating a potential reversal.
⚪ Display of Key Levels: The indicator can show Open, High, and Low levels for selected timeframes, helping traders identify key price points.
█ How to Use
The Golden Swap pattern is a valuable confirmation tool, particularly around key levels or session highs and lows. It highlights instances where a previous high or low has been respected, followed by a price reversal—flipping back up in an upward trend (Golden Swap Long) or flipping back down in a downward trend (Golden Swap Short). When this pattern emerges near a key level, it strongly suggests that the price will continue moving in the direction indicated by the current trend.
Consider it akin to a minor liquidity hunt above the previous high or below the previous low. The presence of the Golden Swap pattern, especially when aligned with other indicators and filters, enhances its reliability as a signal for the continuation of the prevailing market trend.
█ Settings
Timeframe Selection: Choose from various timeframes for signal calculation.
Filter Adjustments: Fine-tune the Symmetry Precision, BaselineBound Threshold, and Precision PinBar settings to filter signals according to specific criteria.
Display Options for Key Levels: Enable or disable the display of key price levels and select timeframes for these levels.
█ Related script using the same pattern filtering techniques
-----------------
Disclaimer
The information contained in my Scripts/Indicators/Ideas/Algos/Systems does not constitute financial advice or a solicitation to buy or sell any securities of any type. I will not accept liability for any loss or damage, including without limitation any loss of profit, which may arise directly or indirectly from the use of or reliance on such information.
All investments involve risk, and the past performance of a security, industry, sector, market, financial product, trading strategy, backtest, or individual's trading does not guarantee future results or returns. Investors are fully responsible for any investment decisions they make. Such decisions should be based solely on an evaluation of their financial circumstances, investment objectives, risk tolerance, and liquidity needs.
My Scripts/Indicators/Ideas/Algos/Systems are only for educational purposes!

Golden trend alertHI there,
This is indcator support to manage trend of market better.
I would summarize this function as below :
1/ Define golden trend of market by ichimoku.
2/ Able to manage 19 assets at the same time.
3/ Alert to you whenever signal come in. Alert by Email, notifications ..etc.. based on your setting.
Guidance to use :
1/To change the asset you monitor, you can double click on indicator --> Change the assets from "Sy01" --> "Sy19" into your target.
2/ To change to period you monitor, you can double click on indicator --> Change the Surveyed timeframe as below :
1 --> 1 minute timeframe
240 --> 4H timeframe
1D --> Daily timeframe
1W --> Weekly timeframe
1M --> Monthly timeframe
How signals were describeb on the chart
1/ Up-green arrow : Golden trend for up trend
2/ Down-red arrow : Golden trend for down trend
Hope my indicator help you manage porfolio better.
Regards,
Jayce pHAM

'Golden ratio' Cubes - 'GoRaC'The difference between 2 points is plotted here using 'Golden ratio' cubes
(working differently than my 'Golden ratio spiral - 'GoRaS')
The 2 points can be 'high/low' or 'max(open/close)/min(open/close)',
with the possibility of higher resolution, the following examples are with 1 week resolution
By extending the lines you can spot support/resistance area's
You can reverse:
or 'mirror':
The 'bars back' can be set to get a previous period
Important:
In the example of a week resolution on a daily chart:
if you set '0', and it is Friday, the week isn't finished yet!
Everything still can change (= repaint)
1 bar back (in this case 7 daily bars back since the res = week!):
2 bars back:
3 bars back:
Here using 'high/low' and lines extended to the left:
or 'max(open/close)/min(open/close)' and lines extended to the left:
Cheers!

Golden Ratio Fibonacci Multipliers Top Detector [UO]Fibonacci levels that show the critical top and bottom levels. There is no way to miss the top and bottom. And a top detector.
Also the most important SMA lines (SMA 50, 200), EMA21. Those are the most frequently used lines by traders.
This indicator is based on the work of www.tradingview.com
His work set me thinking. Could I also see the bottom using Fibonacci numbers? Yes, of course.
My favorite timeframes with this indicator are 6H, 1D, 3D.
Intensively used for BTC and BNB. And useful for any other coin.

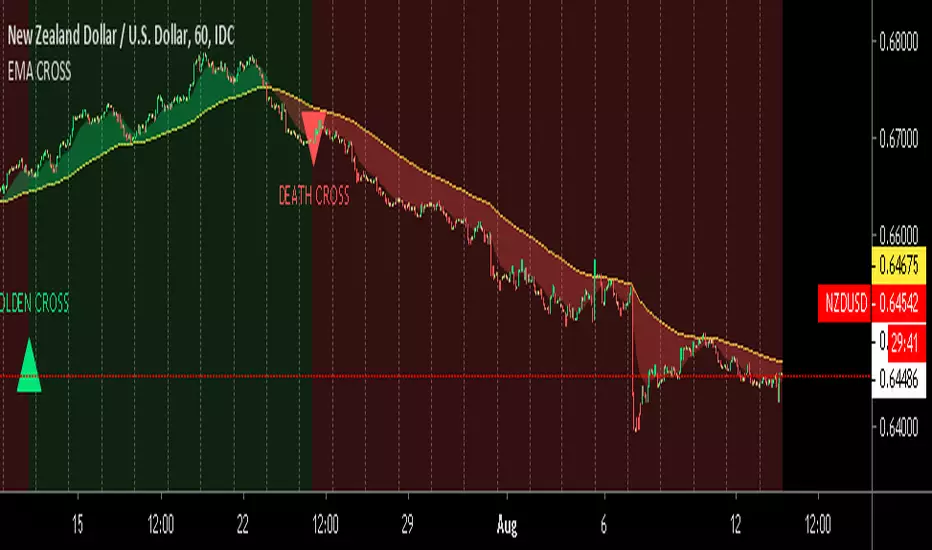
EMA GOLDEN & DEATH CROSSGolden Cross And Death Cross
A golden cross and a death cross are exact opposites. A golden cross indicates a long-term bull market going forward, while death cross signals a long-term bear market. Both refer to the solid confirmation of a long-term trend by the occurrence of a short-term moving average crossing over a major long-term moving average. (source: investopedia)
----
In this indicator we are using Exponential Moving Averages. Use this indicator with TradingView black template chart for a better view
Gold trading strategy with trend follow and TDOW conceptMy strategy uses a combination of three indicators MACD Stochastic RSI.
The Idea is to buy when ( MACD > Signal and RSI > 50 and Stochastic > 50) occures at the same time
This strategy works well on stocks and cryptos especially during market breaking up after consolidation
The best results are on Daily charts , so its NOT a scalping strategy. But it can work also on 1H charts.
The strategy does not have any stops and profit targets, so we can take all the market can give us at the moment.
The exit point only when MACD goes under Signal
In addition I've decided to add a stop loss and "Trading day of week" concept
So the results are much more stable and we get more profit !
So, use it, trade it.
If it will help you to imprive your trading results, please donate me
BTC: 12kd1F8buWisUBdq27BBwRkUvzW7Ey3og5

Golden Fib WavesDynamic Fibonacci levels in pleasing gold shades. Smoothing (SMA) of swing lows and highs enabled by default. Boldly, this just looks good. I am not sure whether it is of any help for trading purposes. If you do in fact find it useful, feel free to drop me a line and to share your insights.

Gold Asia Session Highlighter [IST]Here is a polished description and guide for your Gold Asia Session Highlighter. You can use this text for a YouTube description, a Telegram post, or a PDF guide to explain the tool to others.
Gold Asia Session Highlighter (IST) | Visual Indicator
This is a custom TradingView indicator designed to simplify the Gold Asia Strategy. Instead of automating trades, this tool purely handles the visuals. It automatically highlights the correct Asia Session time window (adjusting for Winter/Summer hours) and marks the exact points where you should draw your Fixed Range Volume Profile (FRVP) tool.
Perfect for: Traders who prefer to draw their own FRVP levels manually but want to ensure they are using the exact, error-free time range every single day.
Features
✅ Automatic Time Zone: Strictly calculated using IST (Indian Standard Time), so you don't need to convert time zones manually.
✅ Smart Season Detection: Automatically switches between Winter Session (04:30 – 06:25) and Summer Session (03:30 – 05:25) based on the current month.
✅ Visual Guidance: Highlights the session background and places "START" and "END" labels on the exact candles.
✅ Zero Clutter: Clean visuals with no moving averages or strategy lines—just the session box.
How to Use It
Add to Chart: Apply the script to your Gold (XAUUSD) 5-minute chart. You will see a blue highlighted box appear during the Asia session.
Locate the Labels:
Look for the blue START label (bottom of the candle).
Look for the red END label (top of the candle).
Draw Your FRVP:
Select the Fixed Range Volume Profile tool from your TradingView toolbar.
Click exactly on the START candle.
Drag and release exactly on the END candle.
Trade: You now have the exact Value Area High (VAH), Value Area Low (VAL), and Point of Control (POC) for the day. Use your breakout strategy as usual!

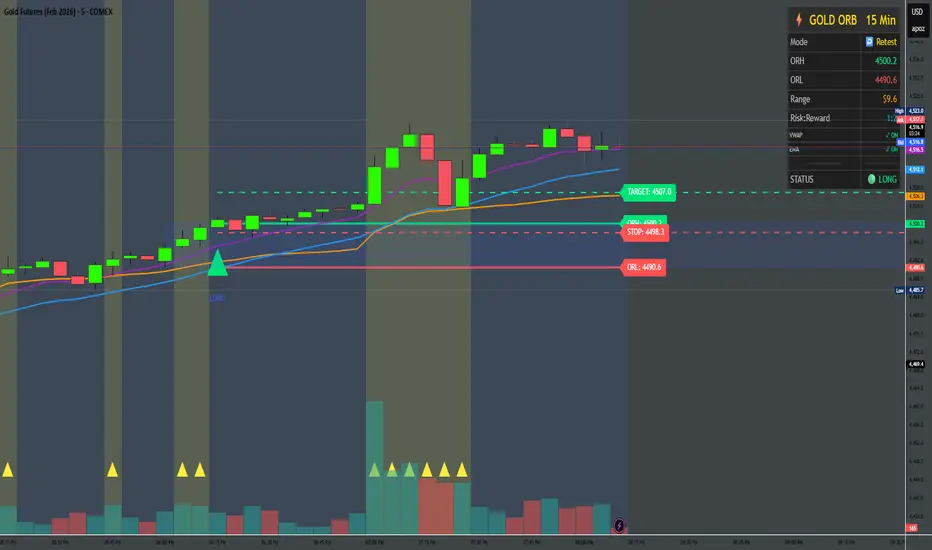
Gold ORB Strategy (3/5/15/30 Min)It's a multi-mode Opening Range Breakout system for Gold futures that automates the detection of the 7:20-7:23 AM CT opening range and provides clear visual signals for four different trading styles.
In Plain English:
"It draws a box around gold's first 3 minutes of trading, then alerts you when price breaks out with confirmation from volume, VWAP, and moving averages. It automatically calculates your entry, stop, and target prices based on your chosen strategy style."
What Makes It Unique:
4 Trading Personalities in One Tool:
Aggressive = "I want every breakout, I'll manage the fakeouts"
Confirmed = "Show me only moves that close beyond the range"
Retest = "I want the pullback entry for better R:R"
Fibonacci = "Let me buy the dip after the initial move"
Smart Confluence Filtering:
Doesn't just show every breakout
Checks if VWAP agrees (trend filter)
Verifies EMA alignment (momentum filter)
Flags volume spikes (conviction filter)
Complete Trade Management:
Automatically calculates stops (3 different methods)
Shows profit targets based on your R:R preference
Labels stick to price levels as you scroll
Visual dashboard shows all key info at a glance
What It's NOT:
Not a "buy here, sell there" robot - you still need to read the market
Not foolproof - no strategy works every day
Not optimized yet - you'll need to backtest and adjust settings for your style
The Real Value:
It takes a proven strategy from your research and makes it systematic and repeatable. Instead of manually drawing boxes and calculating stops every morning, it does the math and shows you exactly where the setup is.