[BT] - ScalpMaster [ALERTS] v1Go easy on this script as it's my first, hopefully more to come!
ScalpMaster - V1
It's main feature is catch a bull run for volatile markets. Two main selling triggers (CCI and TSSL) with an option to only sell after fees are met (for profit).
Built in Statistics and Back-testing
I've introduced my own version of backtesting built into the main script. You can disable it if it's too much, just makes it easier to dial the settings in and compare with alert triggering. I've included this on all of my scripts.
***You will get a warning that this script repaints, however you can easily compare alerts against the labels. I'm not entirely sure, but I believe the repainting is due to the Global Stats Label at the end gets repainted to keep in the front. ***
Directions
Buy: When dialing in the script, watch the purple line above the source, when the current price crosses above this purple line then the buying trigger sets.
Sell: TSSL - Trailing Stop / Stop Limit, use available settings to manipulate behavior. It's meant to trail the bull run and sell once the price crosses the bottom tssl bar
Sell: CCI - Modify the FastMA and SlowMA settings
Sell: P+ - Above won't trigger until you are in the positive after the fees x2 are met. Great to keep your losses minimal. Combine this with a high Stop Loss for great results but might be waiting awhile for a profit.
Buscar en scripts para "CCI"

Fish0naCCIVersion 1.0
This indicator was built experimentally, but ended up being a useful tool in my collection, kind of by accident.
I wanted a way to incorporate three different indicators into one view, to get a more complete picture:
- Fisher Transform With SMA Bollinger Bands (Inspired by @Moe_Mentum 's script Can you tell? :D)
- Commodity Channel Index (Normalized to fit as overlay to FT/BB)
- Convergence / Divergence between On Balance Volume, and its 21 SMA. (Represented by the red and green histogram.)
Fisher Transform helps indicate momentum change as the lines flip and change color, Commodity Channel Index to represent over-bought and over-sold states and reversals, and the OBV Histogram indicates how far above or below the moving average it is currently, with a tendency to draw back to the moving average.
In the above illustration is an interesting pattern I found for identifying good leading buy and sell signals:
Buy Setup:
1. CCI crosses over the Fisher Transform lines, while substantially below 0 on the scale.
2. On-Balance-Volume is at a low point, and ideally prints shorter red bars, which correlates with a rise in price.
Sell Setup:
1. CCI crosses under Fisher Transform, the higher above 0 the better.
2. OBV MACD is topped, or declining.
Notes:
- Will try to work on fixing this in future updates, but if you notice that the MACD Histogram is hugely off the charts, tone down the Amplification Factor in the settings from the default 1000 to a lower number, like 700, 500, etc.
- This was built and tested on BTC, but does work elsewhere. Bug Fixes, features and updates still to come.

Ultimate Gemstone‘’Ultimate Gemstone = best indicator to accurately predict price movement based on momentum’’
This indicator is combination of multiple indicators (RSI, Stoch, GM, Moving averages & CCI) works on all the trading assets and time frames. Accurately predicts top and bottoms ( tested on all major crypto's, stocks and forex).
Comes with 6 different presets with different calculations giving additional flexibility to the user.
"Instructions How To Use"
This indicator is based on four different moving lines depicting momentum; first line (Aqua) is a fast trend line, which reacts rapidly to existing price action, second line (Purple) is slower and takes more price action into account, while third line (Yellow) is the slowest and depicts overall trend. Additionally, CCI/EMA moving line with changing color's (red/green) acts as a another trend confirmation tool.
The three moving lines acts as support and resistance depending on there location to each other. Non-moving parts include fibonacci support and resistance (68.2 & 38.2) areas of the oscillator. Different caution (Red, Green dots & background flashes) settings based on GM indicator to help identify perfect buying and selling opportunities. Additionally, the oscillator has oversold, overbought, bullish and bearish control zones similar to RSI/Stoch oscillators. Similar to RSI/Stoch divergences and trendlines do also work on this oscillator. Other ways to use is Aqua line crossovers with the Purple line, giving hard buy/sell signals and Aqua(fast) line turning (angle change) indicating momentum is reversing.
Example 1: When faster moving line gets pulled into the medium and slower line (especially in the overbought territory of the oscillator) gives you indication to be prepared as most likely the price will go down. Perfectly called Bitcoin top in 2017.
Example 2: BTC bottom in dec2018 and start of new trend in feb2019
Example 3 BTC Top in june2019
Example 4 works across all time frames, Recent BTC price action from 6500 to 7700.
Example 5 LINKBTC daily

Divergence DetectorThis indicator is meant to trigger your attention to possible regular divergences.
As soon as the indicator prints a red or green background, a bearish or bullish regular divergence could have formed.
The divergence is determined between the close values of price and the corresponding values of the underlying plotted baseline indicator.
As baseline, you can use RSI, CCI, MACD, RVI, and OBV.
For each of them, you can tune their classical parameters.
They are initially set to the default periods:
RSI(14), CCI(14), MACD(12,26), RVI(10). OBV has no params.
The detection algorithm uses a tunable window length at a default optimal value of 21.
I would classify this indicator as advanced, and I suggest its use by experienced traders only.
Divergences can be extremely profitable but can destroy your account if you are not cautious. When the indicator detects a possible divergence be sure to check with your eyes. In fact, sometimes a spurious divergence is signalled because of the finite window size.
The algorithm I use in this indicator is brand new and based on a simple but tricky concept. I'm still working to refine it such to detect hidden divergences as well.
This indicator can be used on any TF, *BUT* be sure to use a volume filter for TF under H1, such to avoid low volume periods (e.g., during the Asian range).
You could find my "Volume Volatility Spectrum" or "ATR volatility spectrum" well suited for that purpose.
I've seen a multitude of paid indicators for detecting divergences, some of them not cheap at all. This one is free and it works fairly well! Enjoy it, and use it at your own risk.

Multi momentum indicatorScript contains couple momentum oscillators all in one pane
List of indicators:
RSI
Stochastic RSI
MACD
CCI
WaveTrend by LazyBear
MFI
Default active indicators are RSI and Stochastic RSI
Other indicators are disabled by default
RSI, StochRSI and MFI are modified to be bounded to range from 100 to -100. That's why overbought is 40 and 60 instead 70 and 80 while oversold -40 and -60 instead 30 and 20.
MACD and CCI as they are not bounded to 100 or 200 range, they are limited to 100 - -100 by default when activated (extras are simply hidden) but there is an option to show full indicator.
In settings there are couple more options like show crosses or show only histogram.
Default source for all indicators is close (except WaveTrend and MFI which use hlc3) and it could be changed but for all indicators.
There is an option for 2nd RSI which can be set for any timeframe and background calculated by Fibonacci levels.

Directional Momentum Flux StrategyDirectional Momentum Flux (DMF) is a compound indicator designed to surface signals of projected change in directional momentum. The primary goal is to identify possible momentum inflection points and signal them before they happen, which is reached by applying a set of well-known high-level indicators (e.g. DEMA, RSIs, CCIs and VWAP), lower-level indicators (e.g. BOP, PPO and RMOMO), and some special sauce brewed in-house by yours truly.
This strategy is invite-only. Invitations are offered for a one-time fee of $250 payable in several cryptocurrencies (ETH, BTC, DASH, XMR or ZEC). Once you've got an invitation, you will automatically receive updates forever*.
DMF was designed to work across multiple asset classes. Extensive backtesting has been performed over multiple sample series (not just during the bull runs, for example) and against a randomized pool of assets. But don't take my word for it, I've included some time-based backtesting support tools to make it easy-peasy for you to validate the results yourself!
Under the hood, DMF is powered by numerous indicators, including:
✓ Double EMA & Composite SMA;
✓ Double RSI (fast & slow, variable);
✓ Composite StochRSI & VWAP (StochRSI+, two series);
✓ Composite Commodity Channel Index (CCI+, two series);
✓ Volume-Weighted Balance of Power (BOP itself was adapted from BOP_LB, kudos to LazyBear);
✓ Percentage Price Oscillator (PPO, split, two series);
✓ Range-adjusted Momentum Oscillator (RMOMO, my fancy MOM variant);
It crunches all that data and generates signals which are issued in two ways:
✓ Vertical Bands (or VBs) - Entry/Exit windows as vertical bands that remain "lit" (e.g. the background of a series of candles is semi-opaque white) while the top-level signals are showing sufficiently strong BUY signals. These windows are the primary entry/exit targets and can be relied upon with sufficient risk mitigation (e.g. a reasonable stop-loss or other scale-out exit mechanism). A VB followed immediately by an egg is as good as gold.
✓ Eggs - Entry/Exit validation signals that confirm the condition indicated by VBs. A lit VB without an egg in the same or next candle session is considered to be valid , but not safe (see above warning). Waiting for an egg can improve performance at the risk of missing the best possible entry point. Consider your risk tolerance and act accordingly.
Basic Instructions:
✓ Configure The Settings! The defaults are pretty good, but don't be scared to try variations. For example, by default SHORT positions are disabled. You might want to enable them if your risk tolerance allows them. (IMO there's gold on both ends of the rainbow. 🌈)
✓ Pay attention to the VBs. If you see a lit band being placed in an otherwise dark area, it's a projected inflection point. This is expected to be validated and confirmed in the same or immediately following period with an egg. You can enter a LONG position at this time.
✓ Pay attention to the eggs. If you see an egg, it's a confirmation that the VB changes in the same or immediately preceding candle period is valid. If you did not enter or exit your position at the point of the VB shift, now is the time to do so.
✓ Watch for the end of a VB period and be prepared to exit your position quickly as the next egg may be accompanied by a large directional momentum inflection.
Things to Note:
📉 - DMF is designed for day trading with aggressive position TTLs (15m was the upper bound during development and strategy testing). It appears to issue valid signals for other intervals, but it was not designed for >15m and YMMV. Don't go manually opening a LONG with no exit strategy and go to sleep... it probably won't work out to your benefit. You should be prepared to exit positions at any time. (Pro tip: automation is your friend!)
💸 - DMF indicator is not free from risk. As with all investment strategies, it is crucial to exercise caution and only trade with funds you are comfortable losing. DMF does not offer any form of guarantee or warranty, implied or otherwise. If you lose money, your house, your 401K... that's on you. (Pro tip: don't risk anything you're not ready to lose, because losses are part of the game and you WILL have them.)
🤔 - By using this indicator, you understand that any and all risks are the sole and complete responsibility of the end user (yeah, that's you). Don't use it if you're not 100% clear that you know exactly what you're doing. (Pro tip: always ask questions if you're feeling confused.)
⏱ - * Forever in this context means that, where room for improvement exists, I will improve it over time and you'll get all updates until I stop making them. (Pro tip: nobody lives forever.)

Additional Bollinger Bands & Moving AveragesConsidering the most recent strategy updates to volatility theory trading by DadShark, I have put together (mostly for myself but I am happy to share it if you can find it useful) this even simpler indicator that allows you to activate 4 Bollinger Bands and up to 4 different Moving Averages at the same time.
In this version, there are no multi-frame indicators because this is supposed to be used mostly for short term trading and very limited values that you can edit.
Just plug in the Longest Over Expanded Period (LOXP) in the 1st BB value and all the rest will be calculated accordingly:
- main BB for the LOXP;
- 3rd standard deviation of the LOXP;
- 1/10th of the LOXP for "virtual CCI" entries/exits (so you don't have to adjust CCI values either);
- 3rd standard deviation of the 1/10th of the LOXP to manage your position risk.

cii strategy파인스크립트 공부한다고 만들어봤는데 혼자하니깐 피드백이 안되서 올려봅니다.
원리는 짧은 기간의 cci(14)가 긴 기간의 cci(56)을 뚫으면 매수, 뚫리면 매도하게 해놨습니다.
단기 분봉에는 거의 안 맞고 3시간봉 12시간봉에 맞춰서 쓰시면 됩니다. 횡보장때 승률이 많이 낮습니다..

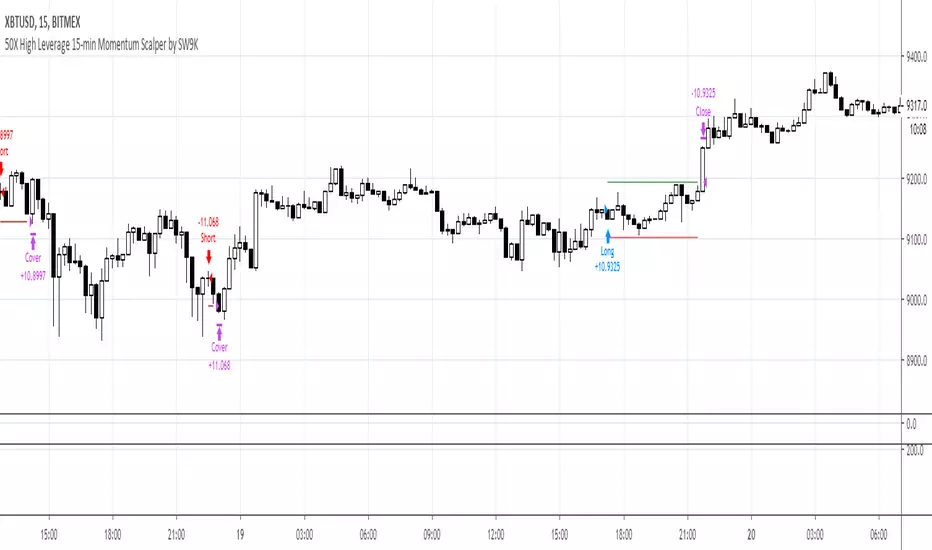
15MEX Momentum ScalperAlpha product project in development. Uses a combination of MACD and T3-CCI with tweaked settings to catch directional momentum and scalp a small move. Strategy is quantity of trades over quality of trades to build profits.
Use this strategy for 15-min Bitmex scalping on XBT contracts only. Recommend 100k contract size or less; backtested with 100k contracts.
Market enter, then use post-only limit exits and stop losses.
Setting is pre-optimized for 0.5% tp target and 0.5% sl of entry price. Recommend default 3 bars as basis for confirming recent MACD crossover as well as default 0.618 Fibonacci ratio as the T3-CCI basis.
Default risk level setting is approximately 2-3 trades a day. You can double the amount to 4-5 trades a day by enabling Aggressive mode. This may lead to larger profits and more entries, but with more frequent stop losses.
Future version will include trailing TPs/stops. Still undergoing optimization and refinement.
variousGoogle Translation------------------------------------------------------------------------------------------------------------------------------------------
Even if it does not display various indicators, it is possible to display seven indicators with this one.
From configuration script
You can select “Awesome Oscillator, CCI, MACD, Price Oscillator, RSI, Stochastics, WaveTrend, Moving Average Deviation Rate”.
And the point attached to the line becomes the high price and the bottom price.
If you check "upper & under" from the setting, the line will be pulled high.
I will increase if there is a demand.
日本語---------------------------------------------------------------------------------------------------------------------------------------------------------
様々なインジケータを表示させなくてもこれ一つで7つのインジケータを表示させることが出来ます。
設定のスクリプトから
「オーサムオシレータ、CCI、MACD、プライスオシレータ、RSI、ストキャスティクス、ウェーブトレンド、移動平均線乖離率」が選択できます。
そして、ラインについている点は高値、底値になります。
設定から「upper & under」をにチェックを入れると高値にラインをひきます。
要望があれば増やします。

Bollinger Band and moving averageThis script help you to show :
- Bollinger Bands
- 3 moving average to choose + 1 hma 120 + vegas wave (lenght and type : sma , ema , vwma , etc.)
- Color candle when RSI is oversold/overbought
- Regular divergence (only base on CCI oscillator)
- Identify resistance/support with Ichimoku cloud or personnal "Duf" cloud
- For cryptos (btc/eth/ltc/eos), MACD cross filtered (red/green arrow)
- Japanese pattern recognition : morning star, evening star
Ce script permet d'afficher les éléments suivants :
- Bandes de Bollinger
- 3 Moyennes Mobiles à choisir + 1 hma 120 + vegas wave (longueur et type : sma , ema , vwma , etc.)
- Coloration de bougies quand surachat/survente RSI
- Affichage de divergence (basé sur l'oscillateur CCI )
- Possibilité d'afficher nuage Ichimoku ou nuage perso "Duf" pour zone de résistance/support
- Pour les cryptos (btc/eth/ltc/eos), possibilité d'afficher le croisement MACD filtré (flèche rouge/verte)
- Détection des chandeliers japonais suivants : Étoile filante, Étoile du soir, Étoile du matin, Avalement baissier, Avalement haussier, Pendu, Ligne Perçante et Couverture en nuage noir)

Kringold2[WOZDUX] gold equivalentThe indicator is a tool for global analysis. The default is the price of gold. The price of the instrument from the main window is divided by the price of gold. The result is the price of the instrument in units of gold. The screen uses the Dow Jones index as an example. In the indicator window, the price of the index in units of gold or the so-called gold Dow Jones. The use of the gold equivalent makes it possible to see more truthful trends. The Indicator has the ability to change gold to any other equivalent. It is enough to change the name of the exchange and the name of the instrument in the options tool and exchange. In addition, in the settings, the second box on top allows you to view the graph in a linear or logarithmic scale. The first box at the top switches the line chart or the CCI =WT indicator to this chart.
-------------------------------------------
Индикатор это инструмент для глобального анализа. По умолчанию используется цена золота. Цена инструмента из основного окна делится на цену золота. В результате получается цена инструмента в единицах золота. На экране для примера используется индекс Доу джонса. В окне индикатора цена индекса в единицах золота или так называемый золотой Доу Джонс. Использование золотого эквивалента дает возможность видеть более правдивые тенденции движения. В Индикаторе есть возможность поменять золото на любой другой эквивалент. Достаточно в опциях инструмент и биржа изменить название биржи и название инструмента. Кроме того, в настройках, второй бокс сверху дает возможность смотреть график в линейном или логарифмическом масштабе. Первый бокс сверу переключает линейный график или индикатор CCI =WT к данному графику.

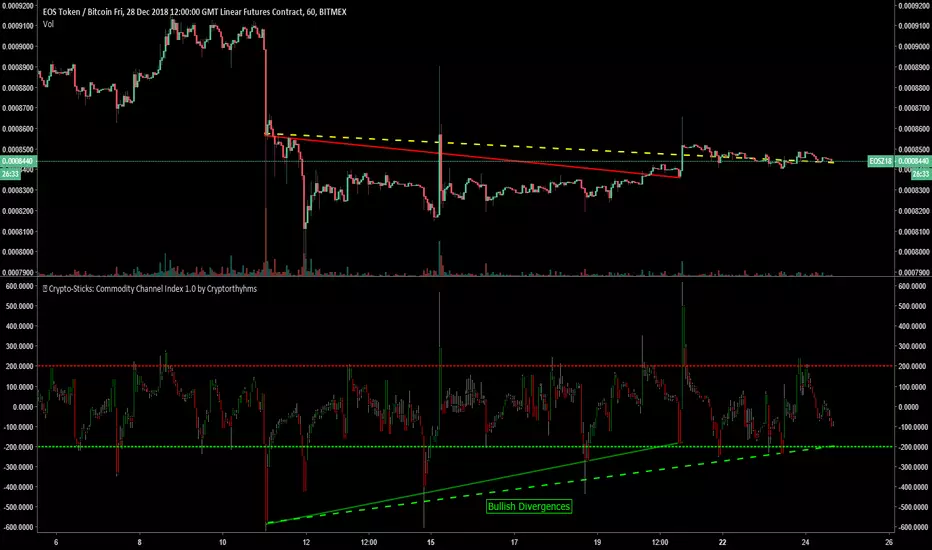
🥢 Crypto-Sticks: Commodity Channel Index 1.0 by Cryptorthyhms🥢 Crypto-Sticks™ CCI
A new series of indicators brought to you by Cryptorthyhms...giving you an alternate look at your trusted favorites!
🚀 Indicator Specific Info
I have found this indicator to show divergences as shown on the main chart. It also iuncludes the standard signaling system from CCI allowing you to define overbought and oversold zones. This indicator is freely available for anyone from the public library.
🚀 Crypto-Sticks General Info
💭This series isnt polished 100%, and I have some more options I will add in the future. But for now, I want to just release them, as I am not sure when I will have the time to put more work into them (many other big projects I am working on).
📊Its basically reinterpretations of all your favorite indicators. I calculate the values a little bit differently than normal, but the end result is creating a candlestick chart (for the indicator!). Then I added the option to plot them as Heiken Ashi candles to smooth out noise and make signaling easier. Here's how it looks as Heiken Ashi:
🔊Lastly I implemented a Volume Weighting system for them all which simply integrates volume into the formulas for these indicators. For the most part this feature is experimental and doesn't provide huge utility (yet - I have other ways I want to try it as well - just no time). Though on some of the indicators it already shows great promise. Here is Volume Weighted + Heiken Ashi:
👍Enjoying this indicator or find it useful? Please give me a like and follow! There are many more indicators to be released in this series, not to mention I post crypto analysis and other free indicators regularly.
💬Questions? Comments? Want to get access to an entire suite of proven trading indicators? Come visit us on telegram and chat, or just soak up some knowledge. We make timely posts about the market, news, and strategy everyday. Our community isnt open only to subscribers - everyone is welcome to join.
APEX - Tester - Buy/Sell Strategies - BasicThis is a simple study for backtesting your strategy for the APEX trading bot. It encorporates the following strategies and script created individually :
- Moving averages -
- Bollinger Bands -
- MACD -
- RSI -
- SRSI -
- Stochastic -
- CCI -
- Percentage Change -
- VWAP -
Be aware that the buy points will in no way be exactly the same as APEX. Some buys will be missed by apex (Spikes).
It also encorporates basic riskmangement:
TP - Take profit
SL - Stop Loss
TSL - Trailing Stop Loss
please select at minimum TP and SL combination or TSL (only TP alone wont be enough)
Additional information:
green buy triangle is the basic buy strategy
green sell is casue by TP TSL
orange sell is casue by sell strategy
orange sell is casue by sell strategy
SL red line
TP green line
TSL purple
- Riskmanagement thanks to JustUncleL
- Added S/R lines thanks to buydipsonly ( blue and yellow line )

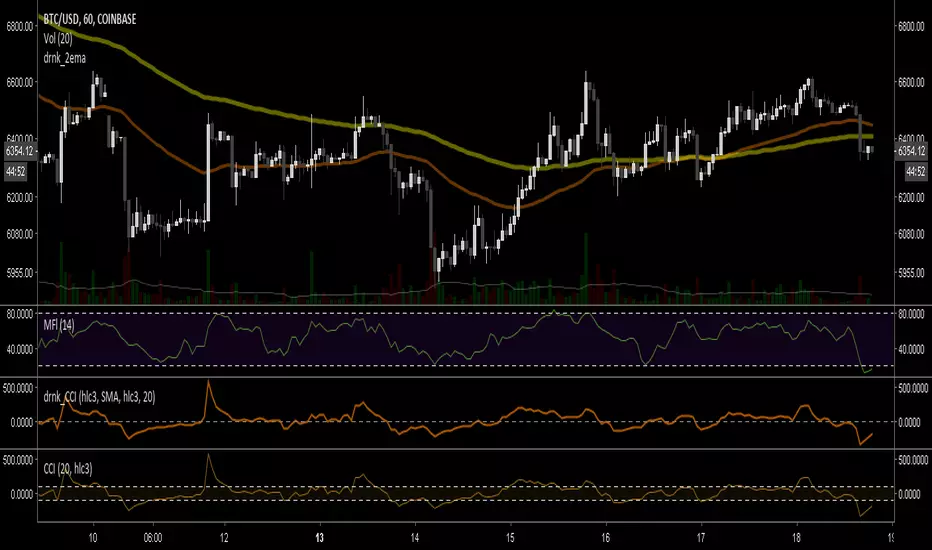
drnk_CCIClassical CCI gives the mean deviation of typical price ((high+low+close)/3) value to the simple moving average of typical price
drnk_CCI is using the same mathematical formula but configuration let you choose average type to calculate the mean deviation.
Default values gives the classic CCI
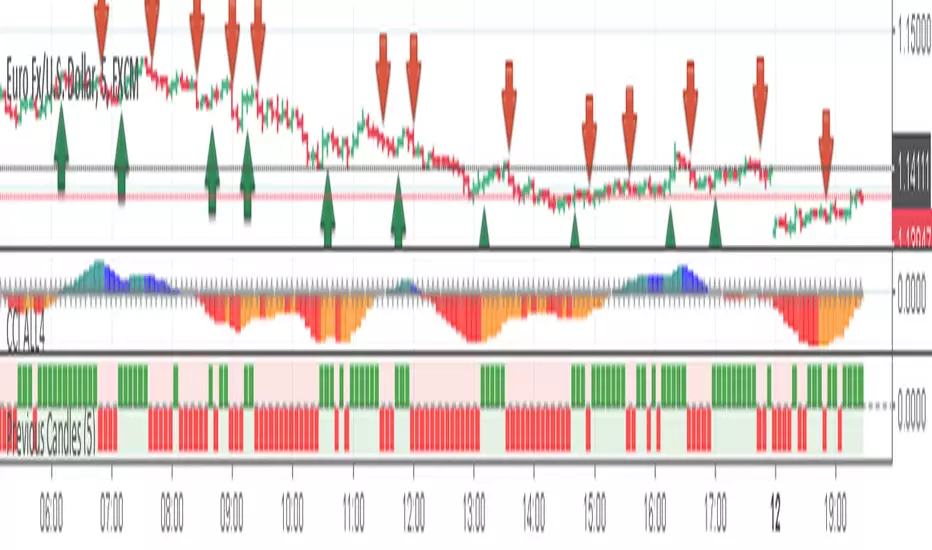
Previous CandlesThis is an indicator based on the average of the maximum and minimum of the past candle, and there is another strategy that makes the filter, it is very good for binary options, if you combine our indicator CCI and All4 it gets even better!
Currency: Any pair.
TimeFrame: 5m
Execute order: You can enter 1 minute or 5 minutes.
In the graph below the ICC, you can see the green and red squares, it works as follows.
Before giving any input you have to enter the change of a color.
Example: It was red and now it's green, so you could give the entry, but you must have at least 3 squares of red before, if only 1 squared has appeared, the hit percentage will be low!
The CCI indicator is for confirmation.
Any doubt I am available!
Note: This indicator does not make magic nor is it a holy grall, it is only an indicator to aid in binary operations!
yutas_CCI+StochRSIver.1.5
It can be used as a material to judge the flow with CCI and StochRSI cross.
CCIとStochRSIのクロスで流れを判断する材料に使えます。

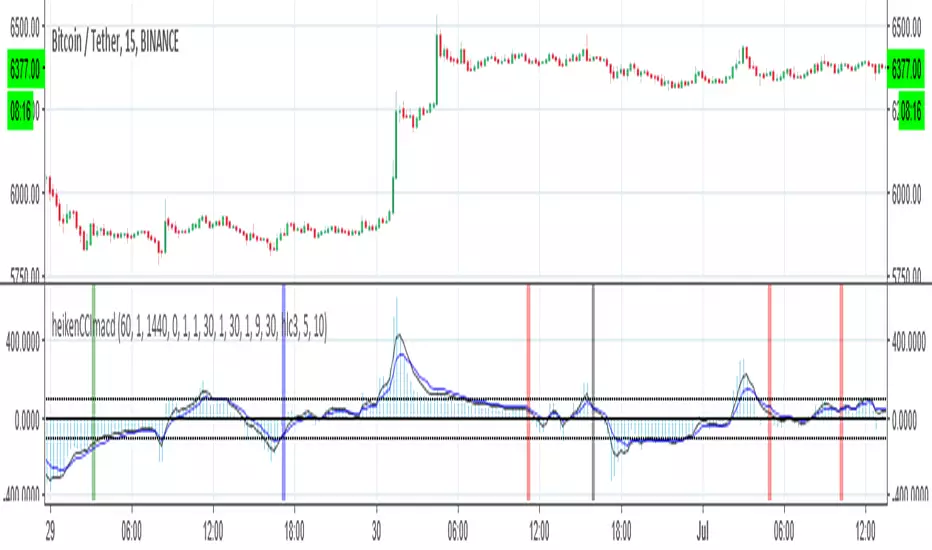
heikenCCImacdI just made new exit point and buy point to older version with some tweek
two buy system 1. based on heiken strategy with filtering by CCI (green red =long short) i little change the old exit point
the other 2. based on cross of CCI in constriction of macd (blue black =long1 shor1)
alerts included
so one can decide on what he like also it possible to combine between them :)
Physics MACD double// Physics MACD double 12, 26 and 5, 15
// with rsi and cci rise green on bottom
// with macd 15 rising above 0 with macd 26 below 0 green on top
// with macd 15 below 0 and macd 26 above 0 red on top
// CCI low and increasing lime bottom
// low and high volume change red green bottom circle
// use with Physics Bollinger Bands

CryptoVN - All-in-One-Trend: Multiple IndicatorAs previous post, I have integrated some indicator in chart into a single package.
Now I'll share you another version : All-in-One-Trend: Multiple Indicator in a separate window.
These are the types of indicators in a separate window., so I called it "All-in-One-Trend".
Indicators included are listed below:
01. Commodity Channel Index (CCI)
02. HawkEye Volume by @LazyBear
03. Stochastic RSI
04. Double Sinewave
05. Woodies CCI
If you like and use this, tips and donations are always welcome. :)
Bitcoin: 3BMEXfdqNNmVmtHYvZ1HqMyXchAGLUrbqF

CCI_three_timeframesThis script shows three CCIs in one frame, three different frames (20,140,3360) on the same chart.
Purely for for visual purposes values multiplied with e.
CCI is using simple moving average and mean deviation, a basic versatile momentum oscillator-indicator.
Useful for 2h charts.

A Multi 10 indicatorREAD NOTE BEFORE APPLYING or you may think indicator doesnt work.
This indicator is a revise of another i made and contains 10 Optional Indicators allowing you to load more then 3 indicators at once if you so choose and dont pay for the platform!
Hopefully someone will find use for this script besides me :) I dont suggest turning all on at once because it
will not look right. Alot will overlap if you wish but i only use the Session and trend bar at once in
conjuction with a Oscillator setting like MacD , RSI , Stoch , Aroon or CCI .
In the chart you see i only have a few indicators active ENJOY!!
---------- NOTE ----------- ( Everything is OFF by default and indicator SHOULD show up BLANK when loaded) ------------ NOTE -------------
(Can turn EVERYTHING on AND change any values in the format tab once indicator loads)
Indicators included are listed below
Sessions, including, NY session, Aussie session, Asian session, and Europe market sessions.
MacD Split Colored , aroon oscillator
CCI Oscillator , classic aroon
RSI Oscillator , Elliot wave
Stoch RSI Oscillator , ATR%
My own Trend bar
---------- NOTE ----------- ( Everything is OFF by default and indicator SHOULD show up BLANK when loaded) ------------ NOTE -------------
(Can turn EVERYTHING on AND change any values in the format tab once indicator loads) CODE probably looks messey but this is something i made for me so i didnt really care lol
A Multi 10 indicatorREAD NOTE BEFORE APPLYING or you may think indicator doesnt work.
This indicator is a revise of another i made and contains 10 Optional Indicators allowing you to load more then 3 indicators at once if you so choose and dont pay for the platform!
Hopefully someone will find use for this script besides me :) I dont suggest turning all on at once because it
will not look right. Alot will overlap if you wish but i only use the Session and trend bar at once in
conjuction with a Oscillator setting like MacD , RSI , Stoch , Aroon or CCI .
In the chart you see i only have a few indicators active ENJOY!!
---------- NOTE ----------- ( Everything is OFF by default and indicator SHOULD show up BLANK when loaded) ------------ NOTE -------------
(Can turn EVERYTHING on AND change any values in the format tab once indicator loads)
NY session, Aussie session, Asian session, and Europe market sessions.
MacD Split Colored , aroon oscillator
CCI Oscillator , classic aroon
RSI Oscillator , Elliot wave
Stoch RSI Oscillator
Aroon Oscillator
My own Trend bar
---------- NOTE ----------- ( Everything is OFF by default and indicator SHOULD show up BLANK when loaded) ------------ NOTE -------------
(Can turn EVERYTHING on AND change any values in the format tab once indicator loads) CODE probably looks messey but this is something i made for me so i didnt really care lol
