Liquidity Hunter + ShortLiquidity Hunter + Short
Version with Short Trade Signals by Cihan Culha
This indicator is based on the original Liquidity Hunter by ChartPrime (MPL 2.0 license).
It detects potential Long and Short liquidity hunts by analyzing candle body, wick percentages, ATR bands, and slope direction.
Features:
Long signals (original) based on lower wick, body %, slope, and ATR bands
Short signals (added) based on upper wick, body %, negative slope, and ATR bands
Target (TP), Stop Loss (SL), CHOCH, and BOS levels plotted dynamically
Visual boxes highlight potential liquidity zones
Risk/Reward (RR) configurable via input
Usage Notes:
This modified version adds Short trade signals while preserving the original Long logic
Original author ChartPrime is credited; modifications by Cihan Culha
Adjust Body %, Wick %, and RR multiplier to suit your trading timeframe and style
For educational purposes; always use proper risk management
Buscar en scripts para "BOS"

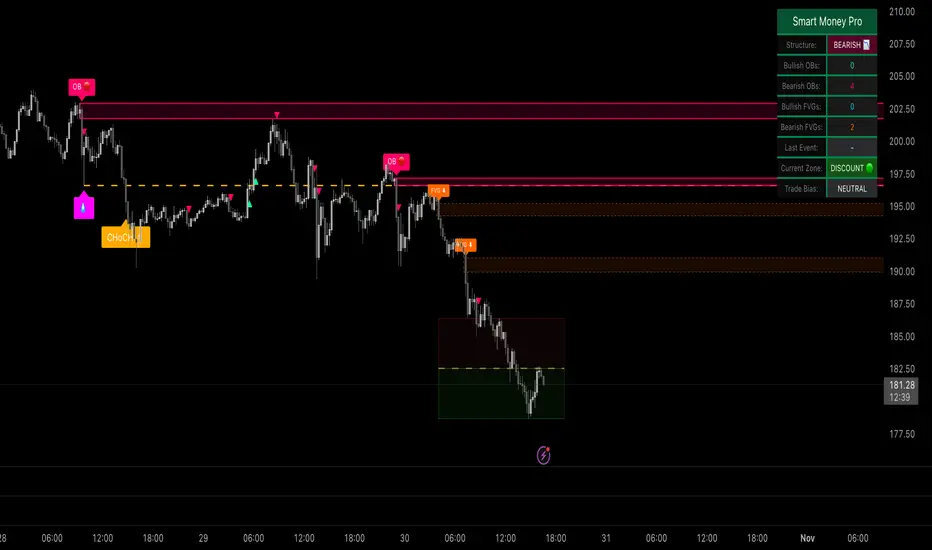
ICT Trading SuiteThe ICT Trading Suite is a complete price-action toolkit designed for traders who follow ICT concepts such as Fair Value Gaps (FVGs), Order Blocks (OBs), Supply & Demand Zones, Market Structure pivots, Liquidity Zones, and Moving Averages.
This indicator combines multiple institutional concepts into a single clean, optimized, high-performance script — allowing you to see the market the same way smart money does.
Each module can be toggled on/off to match your personal strategy.
🔥 FEATURE SET
1️⃣ Moving Averages (Fully Customisable)
5 MA slots
Multiple MA types: EMA, SMA, RMA, WMA, HMA, VWMA
Custom colours & visibility toggles
Supports all timeframes
Ideal for bias recognition and trend filtering.
2️⃣ Fair Value Gaps (FVG) – ICT 3-Candle Model
The script detects bullish and bearish FVGs using the classic ICT logic:
Bullish FVG → high < low
Bearish FVG → low > high
Features:
Automatic gap detection
Custom colours for up/down FVGs
CE (consequent encroachment) line
Optional deletion when filled
Extend FVGs dynamically
Lookback days filter
FVG blocks automatically update until price fills the imbalance.
3️⃣ Supply & Demand Zones (Swing-Based)
Built from confirmed swing highs/lows using ta.pivothigh and ta.pivotlow.
Features:
ATR-based zone thickness
Zone overlap filtering
Auto-cleaning oldest zones
POI (Point of Interest) marker
3 types of arrays:
Supply zone boxes
Demand zone boxes
POI midline boxes
Zones extend 100 bars by default and update dynamically.
Zones are deleted instantly when price breaks them (converted into BOS behavior).
4️⃣ Smart Money Order Blocks (Simple Engulfing Pattern)
OBs are detected using the classic engulfing model:
Bullish OB
Bearish candle → Engulfed by bullish candle where
close > high
Bearish OB
Bullish candle → Engulfed by bearish candle where
close < low
Each OB stores:
Original top/bottom
Current top/bottom
POI line (optional)
Engulfing candle structure
Mitigation state
Features:
Dynamic boundaries (OB shrinks as price mitigates)
POI line update
Automatic deletion (or recolour) when completely mitigated
Limit how many OBs stay on chart
Support for adding HTF OBs later
This creates very clean and very accurate ICT order blocks.
5️⃣ Liquidity / Vector Zones (Volume-Spread Analysis)
A built-in PVSRA-style logic marks areas of institutional activity.
Vector candles detected using:
Volume ≥ 200% of average
Or candle spread × volume ≥ highest in last 10 bars
Medium-volume vectors (150%) also included
Colour-coded zones extend to the right
Auto-cleanup once price clears the zone
Useful for detecting areas where algorithms (MMXs) aggressively buy/sell.
6️⃣ Pivot Levels
Multiple pivot methods supported:
Traditional
Fibonacci
Woodie
Classic
DM
Camarilla
Features:
Auto / Daily / Weekly / Monthly / Quarterly / Yearly pivots
Dynamic line extension
Labels with prices
Custom colours
Only draws selected pivot levels
Efficient matrix-based pivot system
💎 TECHNICAL EXCELLENCE
✔ Pine Script v6
✔ Efficient arrays & memory handling
✔ Clean dynamic updates
✔ Max-performance structure
✔ Modular design (each component can be toggled)
✔ Integrates all ICT concepts in one tool
🎯 Who Is This Indicator For?
Perfect for:
ICT Traders
Smart Money / Institutional Traders
Day Traders & Scalpers
Swing Traders using OB/FVG
Liquidity hunters
Market structure based traders
Volume-spread or PVSRA focused traders
This combines multiple institutional concepts without cluttering the chart.
🏆 Final Notes
This is a true all-in-one institutional suite, replacing up to 8 separate indicators.
Designed for precision, clarity, and professional price-action workflow.

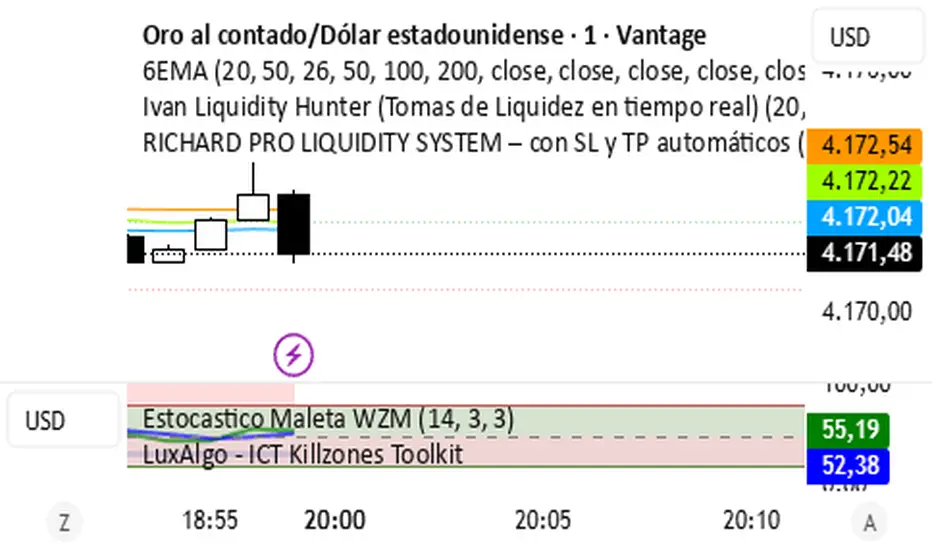
RICHARD PRO LIQUIDITY SYSTEM – con SL y TP automáticos (FIX)INDICADOR EN TIEMPO REAL DE OPERACIONES
Detects Liquidity in High Timeframes (HTF)
Liquidity intake on H1/H4/D1
Marked on M1 with lines.
Seeks entries only on M1
When the price returns to that zone → activates the system.
Institutional filters included
EMA200 (buys only above, sells only below)
Stochastic
BOS (structure change)
FVG (liquidity gaps)
Order blocks
Checklist (D1 / H4 / M15/30 BoS / VP / Fibo / S/R) This is a simple, visual checklist indicator that allows you to quickly assess how many of your strategy conditions are met, without affecting the chart itself. It is ideal for multi-timeframe strategies and point-by-point setup monitoring.

Order Block Pro (Manoj Kumar Mathey)This is an indicator which gives you the Order Block with BOS + FVG + Liquidity Sweep.

Order Block Pro (Manoj Kumar Mathey)This indicator gives you the Order Block professionally which includes BOS + FVG + Sweep analysis too.

Mickey's Breaker Engine⚡ Breaker Engine | Auto Retest + Smart R:R Targets
A precision-grade breaker-block detection system built for traders who live and breathe clean structure.
This indicator automatically detects Breaker Candles, confirms them, marks their zones, and executes intelligent retest-based entry logic — complete with Stop-Loss and Risk-to-Reward (R:R) tracking up to 3R (or any custom ratio).
🧠 Core Concept
A Breaker Block is a structural shift where price violates liquidity from a failed order block and flips the zone’s polarity — turning a former supply into demand (or vice-versa).
This script identifies those setups automatically, confirms them only after a valid structure break, and waits for a clean retest to trigger a trade signal.
🚀 Key Features
⚙️ Smart Zone Detection
Detects both Bullish Breakers and Bearish Breakers.
Zones are drawn precisely using the breaker’s middle candle body (or full wick range if enabled).
Fully configurable transparency, width, and extension for better visual context.
🎯 Auto Retest Entry Logic
Entry triggers only on a clean retest, not on immediate breakout.
Includes logical filters to ensure retests are structurally valid and not overlapping candles.
Works in any timeframe or market — crypto, forex, indices, or commodities.
💡 Dynamic Risk–Reward Tracking
Automatically plots 1R, 2R, 3R, ...R targets based on your defined stop range.
Risk is calculated from entry to zone boundary or ATR offset.
Each target label appears precisely when hit.
Targets automatically stop updating once Stop-Loss is triggered.
🧱 Visual Clarity
BUY 🟢 / SELL 🔴 bubbles at entries.
SL ❌ marker when stop is hit.
🎯 1R / 2R / 3R labels dynamically plotted when each reward level is reached.
Non-overlapping placement using ATR-based spacing.
⚡ Real-Time Alerts - Instant alerts for:
✅ “Breaker BUY” – Clean retest confirmed (Long setup)
✅ “Breaker SELL” – Clean retest confirmed (Short setup)
❌ “Breaker BUY SL” – Stop hit for Long
❌ “Breaker SELL SL” – Stop hit for Short
🧩 Customization Panel
| Setting | Description |
| :-------------------------- | :------------------------------------------------------------------------------ |
| **ATR Length** | Controls volatility-based offset sizing. |
| **Entry / SL Offset × ATR** | Adjusts label spacing and dynamic positioning. |
| **Risk-Reward Ratio** | Define default R:R (e.g. 1:3). |
| **Multiple Retests** | Enable if you want the same breaker zone to allow multiple retests/entries. |
| **Banner Design** | Control opacity, extension, and wick usage for the breaker block visualization. |
| **Color Controls** | Choose your BUY/SELL/SL bubble colors to match your chart theme. |
⚙️ Underlying Logic (At a Glance)
Pattern Detection:
Identifies a 5-bar sequence that forms a valid Breaker Candle (the middle bar flips structure).
Confirmation:
Requires a follow-through candle to validate a real liquidity break.
Zone Registration:
Stores the breaker zone’s body range in arrays for tracking.
Clean Retest Entry:
Waits for price to retest the zone from the opposite side and close cleanly inside.
Stop Loss / Target Projection:
Defines stop loss just beyond the zone and plots up to 3 × reward targets dynamically.
Monitoring & Alerts:
Tracks each setup independently until either an R-target or SL is reached.
💬 Recommended Usage
Works best with market-structure traders, smart-money concepts, or liquidity-based systems.
Combine it with an external displacement confirmation or BOS/CHOCH tool for best precision.
Ideal for backtesting breaker-based R:R consistency or forward-testing retest entries.
Compatible with any asset / timeframe.
🧭 Disclaimer
This script is for educational and analytical purposes only.
It is not financial advice and should not be used to make trading decisions without independent confirmation or risk management.
Always test on demo data before deploying live.

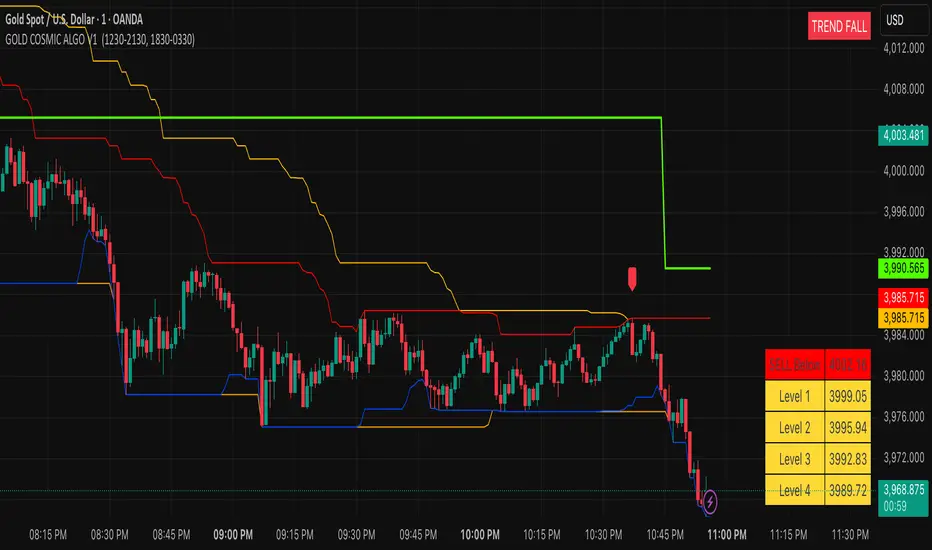
GOLD COSMIC ALGO V1### Cosmic Gold Trading Algorithm
- **Overview**: Cosmic Gold is an advanced, invite-only Pine Script indicator optimized for trading Gold (XAUUSD), blending trend analysis, market structure detection, and predictive modeling to generate reliable buy/sell signals across scalping, intraday, and swing strategies.
- **Key Features**: It identifies market breaks using swing pulses, displays quantum trend states, plots reversal signals near support/resistance, and uses kernel regression for forecasted price moves with dynamic TP/SL levels—helping traders navigate gold's volatility with precision.
- **Performance Considerations**: While backtests show potential for high accuracy in trending markets, results vary by timeframe and conditions; always combine with risk management, as past performance doesn't guarantee future gains.
#### Getting Started
Add the indicator to your TradingView chart for XAUUSD. It overlays directly, showing signals like "BUY"/"SELL" labels, trend channels, session backgrounds, and a targets table. Default settings suit most users, but adjust visuals (e.g., colors) via inputs for personalization.
#### Recommended Usage
- **Timeframes**: Best on 1m to 4h charts for scalping to swings; higher frames reduce noise.
- **Signals**: Enter on MSB breaks or EMA crossovers (▲/▼ shapes), confirmed by quantum state ("TREND RISE/FALL").
- **Risk Management**: Use ATR-based targets (1-4 levels) and predicted RR for TP/SL; limit risk to 1-2% per trade.
- **Alerts**: Set up for bullish/bearish signals, TP/SL hits to automate notifications.
#### Tips for Success
Monitor session overlaps (London/NY highlighted) for high-volume entries. Test on demo accounts first, and watch for reversals near daily levels or Donchian channels. For optimal results, pair with fundamental gold news.
---
Cosmic Gold represents a sophisticated fusion of classical technical indicators and modern predictive analytics, tailored specifically for the dynamic XAUUSD market. This invite-only algorithm integrates multi-layered market structure analysis, quantum-inspired trend detection, reversal pattern recognition, and a kernel-based regression model to forecast price movements, all while visualizing key sessions and levels for enhanced decision-making. Designed for versatility, it supports scalping on minute charts, intraday trades on hourly frames, and swing positions up to 4 hours, adapting to gold's inherent volatility driven by economic factors, geopolitical events, and safe-haven demand.
At the heart of Cosmic Gold lies a dual swing detection system. The primary detectSwings function scans a 30-bar window to identify highs and lows, creating pulse objects that track price breaches. When close crosses these levels, it triggers structure checks classifying moves as "msb" (market structure break) or "bos" (break of structure), plotting "BUY" or "SELL" labels only on MSB events for high-confidence entries. Paralleling this is the quantumSwings mechanism, which similarly detects extrema but categorizes as "break" or "continuation," updating a real-time trend state displayed in a top-right table: "TREND RISE" (bullish, teal), "TREND FALL" (bearish, red), or "NEUTRAL ZONE" (gray). This quantum layer adds a probabilistic overlay, helping filter false breaks in choppy conditions.
Supporting these signals are robust support/resistance visualizations. Donchian Channels (55-period) plot orange upper/lower trend lines, while 24-period borders create red high and blue low barriers. On intraday charts, previous daily highs/lows (green/red lines) provide context, with all levels used for proximity checks in reversal logic. Outside bar reversals (engulfing patterns) near these zones—within one ATR (average true range, 14-period)—trigger small lime/red labels for "Reversal Up/Down," offering counter-trend opportunities. Quantum flags further scan for exhaustion: bull/bear patterns over 30 bars verify local extrema, though not plotted directly, they inform the overall state.
The predictive engine elevates Cosmic Gold beyond traditional indicators. Eight normalized features—ranging from RSI-scaled dump/pump metrics and volatility derivatives to volume oscillators, choppiness index, standard RSI, and EMA-derived trend signals—feed a radial basis function (RBF) kernel regression model. On EMA (50/200) crossovers, it records historical absolute moves and trains on past instances, weighting by feature distance to estimate predictedMove (fractional advance/decline). Win rate calculations derive recommended risk-reward (RR), dynamically setting TP/SL: for bulls, TP at close + (close * predictedMove), SL at close - (close * predictedMove / RR). Signals (▲/▼) fire only above 5-minute frames if predictions are valid, with in-trade tracking alerting on hits. This ML-inspired approach aims to quantify edge, though it requires sufficient history (ideally 100+ trades) and may underperform in unprecedented regimes.
Visual and utility elements enhance usability. A bottom-right table populates on signals with ATR (18-period) scaled targets (1-4 levels, yellow cells) above/below entry, colored green/red for direction. Session backgrounds highlight London (muted blue, 12:30-21:30 IST) and New York (muted green, 18:30-03:30 IST), with dashed vertical lines at starts and solid IST lines at 5 AM (blue) / 5 PM (orange) for timezone awareness. Alerts cover signals, TP/SL, ensuring hands-off monitoring.
In practice, Cosmic Gold's strength lies in its adaptability: in bull markets, quantum "RISE" aligns with EMA upsides for longs; in volatility spikes (e.g., Fed announcements), reversals near channels provide quick scalps. However, limitations include potential repainting on early bars (due to highest/lowest recalculations) and NA predictions on low-volume symbols—mitigated by the volume error check. Backtesting emphasizes realistic settings: modest account sizes, commissions/slippage, and <5% risk per trade align with RR logic. While optimized for gold, testing on correlated assets like silver may yield insights, but always verify with live data.
| Component | Description | Key Parameters | Utility in Trading |
|-----------|-------------|----------------|--------------------|
| Swing Detection | Identifies highs/lows over fixed length for structure breaks. | External Length: 30 bars | Filters entries to confirmed breaks, reducing false signals. |
| Quantum Trend | Parallel swing system updating bullish/bearish/neutral states. | Quantum Period: 30 bars | Provides trend bias; "RISE/FALL" confirms signal direction. |
| Reversal Signals | Engulfing patterns near S/R within ATR. | ATR Length: 14 | Spots counter-trends; ideal for scalps near daily levels. |
| Kernel Regression | RBF model predicts moves from 8 features. | Bandwidth: 5; Features: RSI, volatility, etc. | Forecasts TP/SL; enhances RR for sustainable trading. |
| Visual Aids | Channels, sessions, targets table. | Donchian: 55; Borders: 24 | Contextualizes price; sessions flag high-volume periods. |
| Alerts & Risk | Dynamic TP/SL, win rate tracking. | Safe Duration: 2000 bars max | Automates exits; promotes disciplined risk management. |
This comprehensive design positions Cosmic Gold as a professional tool for gold traders, emphasizing rule-based precision over discretionary guesswork. For access, contact the author via TradingView; note it's invite-only to maintain quality control.
**Key Citations:**
- (tropicalglitz.net)
- (www.cnn.com)
- (www.forbes.com)
- (auronum.co.uk)
- (www.prismaticpowders.com)
- (cosmicgoldmusic.com)
TD signalsThe iFVG Smart Inversion System is a precision-based price action tool designed for traders who understand the power of liquidity and displacement. This indicator identifies Inverted Fair Value Gaps (iFVGs) — moments when price fully disrespects an existing imbalance — signaling a potential shift in market intent.
Unlike typical FVG indicators that flood the chart with zones, this system focuses on the signal behind the imbalance, not the imbalance itself.
✅ Core Logic
A signal is generated only when:
1️⃣ Price taps the 50 EMA
2️⃣ Within the next 10 bars, a previously-formed FVG is completely closed through
3️⃣ Trend is confirmed:
Buy only if price is above the 50 EMA
Sell only if price is below the 50 EMA
4️⃣ The most recent FVG is the only valid one
5️⃣ One signal per EMA tap — no clutter
6️⃣ System fully resets only after a new, clean EMA touch
7️⃣ Signal filter: Blocked when 50 EMA & 100 EMA are crossing to avoid indecision zones
This creates a highly selective, institutional-style confirmation tool with strong directional bias.
🎯 What It’s Built For
Intraday trading (5m optimal, but works on other TFs)
Liquidity grabs & displacement recognition
Trend-aligned continuation entries
Clean and minimal charting
Perfect for traders who want clarity over chaos — less noise, more conviction.
🔔 Alerts Included
TD Buy Signal
TD Sell Signal
Optional FVG disrespect notifications
Use with your preferred execution model (Breaker, iFVG continuation, BOS confirmation, etc.)
⚠️ Risk Disclosure
No indicator is 100% accurate. Always complement signals with:
Structure analysis
Liquidity context
Risk management

Strategy Builder v1.0.0 [BigBeluga]🔵 OVERVIEW
The Strategy Builder combines advanced price-action logic, smart-money concepts, and volatility-adaptive momentum signals to automate high-quality entries and exits across any market. It blends trend recognition, market structure shifts, order block reactions, imbalance (FVG) signals, liquidity sweeps, candlestick confirmations, and oscillator-powered divergences into one cohesive engine.
Whether used as a full automation workflow or as a structured confirmation framework, this strategy provides a disciplined, rules-driven method to trade with logic — not emotion.
🔵 BACKTEST WINDOW CONTROL
This module allows you to restrict strategy execution to a specific historical period.
Ideal for performance isolation, regime testing, and forward-walk validation.
Limit Backtest Window
Enabling this option activates custom date filters for the backtest engine.
Start — Define the starting date & time for backtesting
End — Define the ending date & time for backtesting
Only trades and signals inside this window are executed
Reduces computation load on large datasets
Useful for testing specific market environments (e.g., bull cycles, crash periods, sideways regimes)
🔵 SIGNAL GLOSSARY (Advanced Technical Explanation)
Traders can build long and short setups using up to 6 configurable entry conditions for each direction.
Every condition can be set as Bullish or Bearish and mapped to any signal source — allowing deep customization
Below is the full internal logic overview of every signal available in the Strategy Builder.
Signals are based on trend models, volatility structures, liquidity logic, oscillator behavior, and market structure mapping.
Trend Signals (Low-Lag Trend Engine)
Uses a proprietary low-lag baseline + momentum gradient model to detect directional bias.
Trend Signal — Momentum breaks above/below adaptive trend baseline.
Trend Signal+ — Stronger trend confirmation using volatility-weighted momentum.
Trend Signal Any — Triggers when any bullish/bearish trend signal appears.
SmartBand & Retests (Adaptive Volatility Bands)
Dynamic envelope that contracts/expands with volatility & trend strength.
SmartBand Retest — Price retests dynamic band and rejects, confirming continuation.
ActionWave Signals (Impulse-Pullback Engine)
Tracks wave behavior, acceleration and deceleration in price.
ActionWave — Detects directional impulse strength vs pullback weakness.
ActionWave Cross — Momentum acceleration threshold crossed → trend ignition.
Magnet Signals (Liquidity Gravity + Mean Reversion Bias)
Detects zones where price is being drawn due to liquidity voids or imbalance.
Magnet — Trend and liquidity pressure align, creating directional “pull.”
MagnetBar Low Momentum — Low-volatility compression → pre-breakout condition.
Flow Trend (Directional Flow State + ATR Envelope)
Higher-timeframe bias confirmation + dynamic volatility filter.
FlowTrend — Confirms major directional bias (uptrend or downtrend).
FlowTrend Retest — Price tests HTF flow band and rejects → trend resume.
Voltix (Volatility Expansion Pulse)
Detects regime shift from quiet accumulation → trending expansion.
Voltix — Breakout volatility signature, trend acceleration trigger.
Candlestick Pattern (Algorithmic Price Action Recognition)
Auto-recognizes meaningful reversal or continuation candle formations.
Candlestick Pattern — Confirms momentum reversal/continuation via candle logic.
OrderBlock Logic (Institutional Footprint System)
Institutional demand/supply zone tracking with mitigation logic.
Order Block Touch — Price taps institutional zone → reaction filter.
Order Block Break — OB invalidation → institutional flow shift.
Market Structure Engine (Swing Logic + Volume Confirmation)
Tracks major swing breaks and structural reversals.
BoS — Break of Structure in trend direction (continuation bias).
ChoCh — Change of Character — early reversal marker.
Fair Value Gaps (Imbalance & Volume Displacement)
Identifies inefficiencies caused by rapid displacement moves.
FVG Created — Price leaves inefficiency behind.
FVG Retest — Price returns to rebalance inefficiency → reaction zone.
Liquidity Events (Stop-Run & Reversal Logic)
Detects stop-hunt events and liquidity sweeps.
SFP — Swing failure & wick sweep → reversal confirmation.
Liquidity Created — New equal highs/lows form liquidity pool.
Liquidity Grab — Sweep through liquidity line followed by rejection.
Support / Resistance Break Logic
Adaptive zone recognition + momentum confirmation.
Support/Resistance Cross — Zone decisively broken → structural shift.
Pattern Breakouts (Market Geometry Engine)
Tracks breakout from compression & expansion formations.
Channel Break — Channel breakout → trend acceleration.
Wedge Break — Break from contraction wedge → burst of momentum.
Session Logic (Opening Range Behavior)
Session-based volatility trigger.
Session Break — Break above/below session opening range.
Momentum / Reversal Oscillator Suite
Oscillator-driven exhaustion & reversal signals.
Nautilus Signals — Momentum reversal signature (oscillator shift).
Nautilus Peak — Momentum peak → exhaustion risk.
OverSold/Overbought ❖ — Extreme exhaustion zones → reversal setup.
DipX Signals ✦ — Dip buy / Dip sell timing, micro-reversal engine.
Advanced Divergence Engine
Momentum/price disagreement layer with multi-trigger confirmation.
Normal Divergence — Classic divergence reversal.
Hidden Divergence — Trend continuation divergence.
Multiple Divergence — Multiple divergence confirmations stacked → high confidence.
🔧 Adjustable Signal Logic
Some signals in this system can be additionally refined through the strategy settings panel.
This allows traders to tune internal behavior for different market regimes, assets, and volatility conditions.
🔵 LONG / SHORT EXIT CONDITIONS
This section allows you to automate exits using the same advanced market conditions available for entries.
Each exit rule consists of:
Toggle — Enable/disable individual exit rule.
Direction Filter — Trigger exit only if selected market bias appears (Bullish/Bearish).
Signal Type — Choose which market event triggers the exit (same list as entry conditions).
When the active conditions are met, the strategy automatically closes the current position — ensuring emotion-free risk management and systematic trade control.
🔵 TAKE PROFIT & STOP LOSS SYSTEM
This strategy builder provides a fully dynamic risk-management engine designed for both systematic traders and discretionary confirmation users.
Take Profit Logic
Scale out of trades progressively or exit fully using algorithmic TP levels.
Up to 3 Take-Profit targets available
Choose TP calculation method:
• ATR-based distance (volatility-adaptive targets)
• %-based distance (fixed percentage from entry)
Define Size — ATR multiplier or % value
Custom Exit Size per TP (e.g., 25% / 25% / 50%)
Visual TP plotting on chart for clarity
Stop Loss Logic
Automated protection logic for every trade.
Two SL Modes:
• Fixed Stop Loss — static SL from entry
• Trailing Stop Loss — SL follows price as trade progresses
Distance options:
• ATR multiplier (adapts to volatility)
• %-based from entry (fixed distance)
SL dynamically draws on chart for transparency
Trailing SL behavior:
Follows price only in profitable direction
Never moves against the trade
Locks profits as trend develops
🔵 Strategy Dashboard
A compact on-chart performance dashboard is included to help monitor live trade status and backtest results in real time.
It displays key metrics:
Start Capital — Initial account balance used in simulation.
Position Size — % of capital allocated per trade based on user settings (It changes if the trade hits take profits, when more than one take profit is selected).
Current Trade — Shows active trade direction (Long / Short) and real-time % return from entry.
Closed Trades — Counter of completed positions, useful for reading sample size during testing.
🔵 CONCLUSION
The Strategy Builder brings together a powerful suite of smart-money and momentum-driven signals, allowing traders to automate robust trade logic built on modern market structure concepts. With access to trend filters, order blocks, liquidity events, divergence signals, volatility cues, and session-based triggers, it provides a deeply adaptive trade engine capable of fitting many market environments.

Ornstein-Uhlenbeck Trend Channel [BOSWaves]Ornstein-Uhlenbeck Trend Channel - Adaptive Mean Reversion with Dynamic Equilibrium Geometry
Overview
The Ornstein-Uhlenbeck Trend Channel introduces an advanced equilibrium-mapping framework that blends statistical mean reversion with adaptive trend geometry. Traditional channels and regression bands react linearly to volatility, often failing to capture the natural rhythm of price equilibrium. This model evolves that concept through a dynamic reversion engine, where equilibrium adapts continuously to volatility, trend slope, and structural bias - forming a living channel that bends, expands, and contracts in real time.
The result is a smooth, equilibrium-driven representation of market balance - not just trend direction. Instead of static bands or abrupt slope shifts, traders see fluid, volatility-aware motion that mirrors the natural pull-and-release dynamic of market behavior. Each channel visualizes the probabilistic boundaries of fair value, showing where price tends to revert and where it accelerates away from its statistical mean.
Unlike conventional envelopes or Bollinger-type constructs, the Ornstein-Uhlenbeck framework is volatility-reactive and equilibrium-sensitive, providing traders with a contextual map of where price is likely to stabilize, extend, or exhaust.
Theoretical Foundation
The Ornstein-Uhlenbeck Trend Channel is inspired by stochastic mean-reversion processes - mathematical models used to describe systems that oscillate around a drifting equilibrium. While linear regression channels assume constant variance, financial markets operate under variable volatility and shifting equilibrium points. The OU process accounts for this by treating price as a mean-seeking motion governed by volatility and trend persistence.
At its core are three interacting components:
Equilibrium Mean (μ) : Represents the evolving balance point of price, adjusting to directional bias and volatility.
Reversion Rate (θ) : Defines how strongly price is pulled back toward equilibrium after deviation, capturing the self-correcting nature of market structure.
Volatility Coefficient (σ) : Controls how far and how quickly price can diverge from equilibrium before mean reversion pressure increases.
By embedding this stochastic model inside a volatility-adjusted framework, the system accurately scales across different markets and conditions - maintaining meaningful equilibrium geometry across crypto, forex, indices, or commodities. This design gives traders a mathematically grounded yet visually intuitive interpretation of dynamic balance in live market motion.
How It Works
The Ornstein-Uhlenbeck Trend Channel is constructed through a structured multi-stage process that merges stochastic logic with volatility mechanics:
Equilibrium Estimation Core : The indicator begins by identifying the evolving mean using adaptive smoothing influenced by trend direction and volatility. This becomes the live centerline - the statistical anchor around which price naturally oscillates.
Volatility Normalization Layer : ATR or rolling deviation is used to calculate volatility intensity. The output scales the channel width dynamically, ensuring that boundaries reflect current variance rather than static thresholds.
Directional Bias Engine : EMA slope and trend confirmation logic determine whether equilibrium should tilt upward or downward. This creates asymmetrical channel motion that bends with the prevailing trend rather than staying horizontal.
Channel Boundary Construction : Upper and lower bands are plotted at volatility-proportional distances from the mean. These envelopes form the “statistical pressure zones” that indicate where mean reversion or acceleration may occur.
Signal and Lifecycle Control : Channel breaches, mean crossovers, and slope flips mark statistically significant events - exhaustion, continuation, or rebalancing. Older equilibrium zones gradually fade, ensuring a clear, context-aware visual field.
Through these layers, the channel forms a continuously updating equilibrium corridor that adapts in real time - breathing with the market’s volatility and rhythm.
Interpretation
The Ornstein-Uhlenbeck Trend Channel reframes how traders interpret balance and momentum. Instead of viewing price as directional movement alone, it visualizes the constant tension between trending force and equilibrium pull.
Uptrend Phases : The equilibrium mean tilts upward, with price oscillating around or slightly above the midline. Upper band touches signal momentum extension; lower touches reflect healthy reversion.
Downtrend Phases : The mean slopes downward, with upper-band interactions marking resistance zones and lower bands acting as reversion boundaries.
Equilibrium Transitions : Flat mean sections indicate balance or distribution phases. Breaks from these neutral zones often precede directional expansion.
Overextension Events : When price closes beyond an outer boundary, it marks statistically significant disequilibrium - an early warning of exhaustion or volatility reset.
Visually, the OU channel translates volatility and equilibrium into structured geometry, giving traders a statistical lens on trend quality, reversion probability, and volatility stress points.
Strategy Integration
The Ornstein-Uhlenbeck Trend Channel integrates seamlessly into both mean-reversion and trend-continuation systems:
Trend Alignment : Use mean slope direction to confirm higher-timeframe bias before entering continuation setups.
Reversion Entries : Target rejections from outer bands when supported by volume or divergence, capturing snapbacks toward equilibrium.
Volatility Breakout Mapping : Monitor boundary expansions to identify transition from compression to expansion phases.
Liquidity Zone Confirmation : Combine with BOS or order-block indicators to validate structural zones against equilibrium positioning.
Momentum Filtering : Align with oscillators or volume profiles to isolate equilibrium-based pullbacks with statistical context.
Technical Implementation Details
Core Engine : Stochastic Ornstein-Uhlenbeck process for continuous mean recalibration.
Volatility Framework : ATR- and deviation-based scaling for dynamic channel expansion.
Directional Logic : EMA-slope driven bias for adaptive mean tilt.
Channel Composition : Independent upper and lower envelopes with smoothing and transparency control.
Signal Structure : Alerts for mean crossovers and boundary breaches.
Performance Profile : Lightweight, multi-timeframe compatible implementation optimized for real-time responsiveness.
Optimal Application Parameters
Timeframe Guidance:
1 - 5 min : Reactive equilibrium tracking for short-term scalping and microstructure analysis.
15 - 60 min : Medium-range setups for volatility-phase transitions and intraday structure.
4H - Daily : Macro equilibrium mapping for identifying exhaustion, distribution, or reaccumulation zones.
Suggested Configuration:
Mean Length : 20 - 50
Volatility Multiplier : 1.5× - 2.5×
Reversion Sensitivity : 0.4 - 0.8
Smoothing : 2 - 5
Parameter tuning should reflect asset liquidity, volatility, and desired reversion frequency.
Performance Characteristics
High Effectiveness:
Trending environments with cyclical pullbacks and volatility oscillation.
Markets exhibiting consistent equilibrium-return behavior (indices, majors, high-cap crypto).
Reduced Effectiveness:
Low-volatility consolidations with minimal variance.
Random walk markets lacking definable equilibrium anchors.
Integration Guidelines
Confluence Framework : Pair with BOSWaves structural tools or momentum oscillators for context validation.
Directional Control : Follow mean slope alignment for directional conviction before acting on channel extremes.
Risk Calibration : Use outer band violations for controlled contrarian entries or trailing stop management.
Multi-Timeframe Synergy : Derive macro equilibrium zones on higher timeframes and refine entries on lower levels.
Disclaimer
The Ornstein-Uhlenbeck Trend Channel is a professional-grade equilibrium and volatility framework. It is not predictive or profit-assured; performance depends on parameter calibration, volatility regime, and disciplined execution. BOSWaves recommends using it as part of a comprehensive analytical stack combining structure, liquidity, and momentum context.

FVGC — MTF ScreenerFVGC — MTF Screener (by Capital Complex)
Part of the FVGC Suite.
A compact, real-time dashboard that scans the 30s, 1m, 2m, and 3m timeframes for FVGC-compliant conditions—showing a green/red dot when a bullish/bearish setup is arming, and a green/red square when the setup confirms. Built to sit beside FVGC — Signals and FVGC — Visual Overlay so you can monitor multiple timeframes at once without clutter.
---
## What it does
Multi-TF heads-up display : Tracks 30s, 1m, 2m, 3m for valid FVGC criteria.
Clear state encoding:
* Dot = conditions are aligning (setup arming).
* Square = entry model confirmed (go/no-go).
Rule-true logic: Mirrors your FVGC rule set (tap/engulf/inversion and guardrails) so the screener matches what your Signals indicator would accept on each timeframe.
Noise control: Honors your Trading Windows to keep the screen focused on the session you actually trade.
---
## Why traders use it
Time compression: See four lower timeframes progress from “almost” to “confirmed” at a glance.
Discipline aid: Use the dot phase as a heads-up, and the square as the only moment you consider action—no more chart hopping.
Suite cohesion: Screener tells you when, Visual Overlay shows where, Signals defines how.
---
## Key features & options
Timeframes: 30s, 1m, 2m, 3m (fixed for clarity and speed).
FVGC-aligned filters: Honors your suite’s guardrails (e.g., IFVG/BOS logic, midpoint FTC checks, opposing-FVG 50% behavior, opening-range distance caps by TF).
Trading Windows aware: Optional pre-window arming visibility for early heads-up.
Readable UI: On-chart table/HUD with per-state colors (dot/square), custom text color control, and minimal footprint.
Timezone aware: Defaults to America/New_York to align with RTH and your other FVGC tools.
---
## Notes
Designed for index futures, indices, and liquid FX.
This is a visual scanner; it does not place orders. Pair with FVGC — Signals for your actual entry/management logic.
---
## Credits & suite
Capital Complex — FVGC Suite
© TheHiddenMarkets (code components)
---
## Disclaimer
This tool is for educational purposes only and does not constitute financial advice. Trading involves risk; do your own research and manage risk appropriately.

Dynamic Liquidity HeatMap Profile [BigBeluga]🔵 OVERVIEW
The Dynamic Liquidity HeatMap Profile is a smart-flow liquidity tracker that maps where stop-loss clusters and resting limit orders are likely positioned.
Instead of traditional volume profiles based only on executed transactions, this tool projects probable liquidity pools — areas where traders are trapped or positioned and where smart money may hunt stops or fill orders.
It dynamically scans recent price swings, builds liquidity zones above and below price, and visualizes them as a heat map + histogram — highlighting areas with the greatest liquidity attraction.
Orange highlights the highest-concentration liquidity (POC), making potential sweep targets obvious.
🔵 CONCEPTS
Liquidity pools form above swing highs (buy stops) and below swing lows (sell stops).
Market makers & large players often push price into these zones to trigger stops and capture liquidity.
The indicator uses recent volatility + volume expansion to estimate where these pools exist.
Horizontal heat bars show depth and intensity of probable liquidity.
Profile side histogram displays buy-side vs sell-side liquidity distribution.
🔵 FEATURES
Dynamic Liquidity Detection — finds potential stop-loss clusters from recent swing behavior.
Dual-Side Heatmap — split liquidity view above (short stops) and below (long stops) current price.
Volume-Weighted Levels — higher volatility & volume = deeper liquidity expectation.
Real-Time Heat Coloring
• Lime = liquidity below price (potential buy-side fuel)
• Blue = liquidity above price (potential sell-side fuel)
• Orange = peak liquidity (POC)
Liquidity Profile Histogram — plotted at right side, layered by strength.
Auto-Cleaning Engine — removes invalidated liquidity after breaks.
Adjustable lookback window and bin resolution .
🔵 HOW TO USE
Look for price moving toward dense liquidity zones — high probability of wick raids or sweeps.
Orange POC often acts as magnet — strong target zone for smart money.
Combine with SFP / BOS logic to time reversals after liquidity hunts.
In trend, price repeatedly sweeps opposite-side liquidity before continuation.
Use liquidity walls as bias filters — heavy liquidity above often precedes downward move, and vice-versa.
Great for scalping sessions, indices, FX, BTC, ETH.
🔵 CONCLUSION
The Dynamic Liquidity HeatMap Profile gives traders a tactical edge by revealing where the market’s hidden liquidity resides.
It highlights where shorts and longs are positioned, identifies likely sweep zones, and marks the most attractive liquidity magnet (POC).
Use it to anticipate stop hunts, avoid getting trapped, and align with smart-money flow instead of fighting it.

Lord Mathew ATSThe Smart Money Structure & Pattern Analyzer is a complete, all-in-one visual trading system that brings together every essential element of Smart Money Concepts (SMC), ICT methodology, and candlestick psychology into one powerful indicator.
It is designed to help traders instantly understand the market’s structure, liquidity flow, and potential turning points without switching tools or manually marking charts. Whether you trade forex, indices, crypto, or commodities, this indicator automatically identifies where institutional activity, imbalances, and price inefficiencies occur in real time.
With its advanced algorithm, it plots market structure shifts, equal highs and lows, liquidity zones, order blocks, fair value gaps (FVGs), and previous week and day levels (PWO, PWH, PWL, PWC, PDO, PDH, PDL, PDO). It also integrates a deep candlestick recognition engine that detects over ten classic and advanced candle formations including engulfing patterns, dojis, hammers, shooting stars, morning/evening stars, and spinning tops to provide precise confirmation at critical points of interest.
This indicator isn’t just a tool it’s a complete market map that helps traders visualize how institutional order flow and candlestick sentiment interact.
Core Features
📊 Market Structure Detection:
Automatically marks swing highs/lows, Break of Structure (BOS), and Change of Character (CHOCH) in real time.
💧 Liquidity Mapping:
Highlights equal highs/lows and liquidity grabs, showing where price is likely to target before a reversal or continuation.
🧱 Order Block Visualization:
Displays the last bullish or bearish candle before an impulsive displacement, acting as a potential institutional entry zone.
⚡ Fair Value Gap (FVG) Scanner:
Detects and highlights imbalances where price moved too fast, helping you identify high-probability retracement areas.
🕯️ Candlestick Pattern Recognition:
Recognizes key reversal and continuation patterns (engulfing, hammer, shooting star, doji, morning/evening star, etc.) in real time.
📅 Institutional Reference Points:
Plots previous week & day open (PWO, PDO), previous week & day high (PWH, PWH), previous week & day low (PWL, PDL), previous week & day close (PWC, PDC) and optionally previous day levels to help frame bias.
🎨 Customizable Design:
Toggle any feature, change colors, and set alerts when multiple Smart Money signals align for cleaner, faster decision-making.
How It Works
Add the indicator to your chart on any timeframe or market.
The algorithm automatically detects structure, liquidity, and imbalance zones.
Candlestick patterns are highlighted when they form near high-probability areas (like OBs or FVGs).
When confluence occurs such as a liquidity grab, FVG fill, and bullish engulfing candle—the indicator provides a visual signal zone for your confirmation-based entries.
You can refine your trades using higher-timeframe bias (HTF order flow) and lower-timeframe execution (LTF confirmation).
Best For
Traders using ICT, Smart Money Concepts, or price-action systems.
Intraday and swing traders looking for clear, data-driven chart structure.
Traders who want to simplify confluence analysis and focus on precision execution.
Why It Stands Out
Unlike standard candlestick or pattern scanners, this indicator merges institutional market logic with technical candle behavior, allowing traders to see where smart money might be entering or exiting positions.
It’s not about random signals it’s about context, structure, and confirmation.
Every feature in this indicator is built around the principle of liquidity engineering:
price creates liquidity, grabs it, and moves toward imbalance or order flow efficiency.
By merging that institutional logic with candlestick patterns, this tool gives traders an edge in recognizing not only where to trade but why price is reacting in that exact area.
Disclaimer
This indicator is intended for educational and analytical use. It does not provide financial advice or guaranteed trading results. Always backtest and manage your risk responsibly.

✝️📈📉☢️BANG is a comprehensive multi-timeframe indicator for TradingView, designed for intraday trading of futures and stocks.
To use: Add to a low timeframe chart (e.g., 1-5 minutes), configure anchor mode (daily/weekly/monthly/manual) for session resets, and select timeframe for signals (e.g., 5m). Monitor the mini-charts for HTF overview (candles, VWEMA/VWAP, FVG), RSI/MACD trends, market data table (VIX/VXN/etc.), and ICT structure (pivots, BOS/CHoCH).
For trading: Enter LONG/SHORT on signal bars with strength ☢️ (1-6, higher = stronger confluence), confirmed by multi-timeframe alignment (e.g., anchor daily while trading minutes). Use ATR-based risk management; backtest in demo mode.
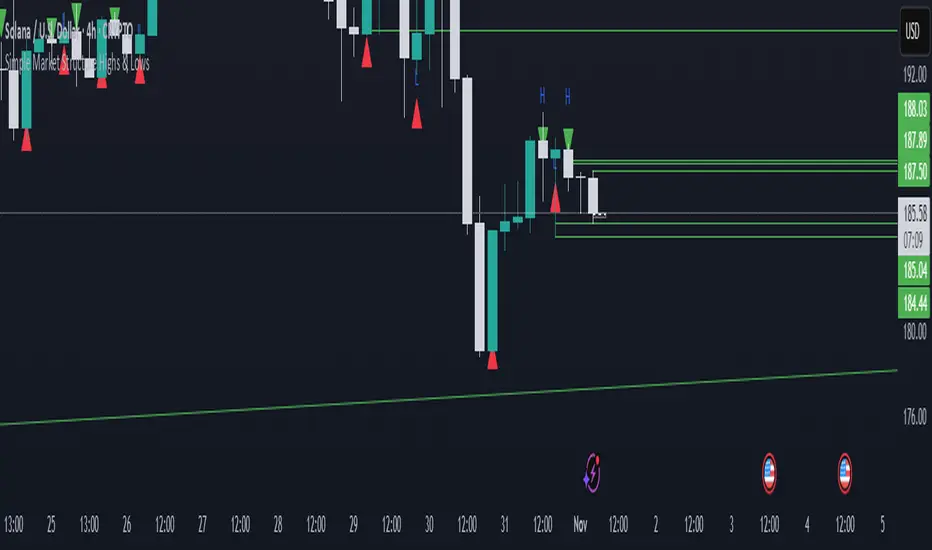
Simple Market Structure Highs & Lows🟩 Simple Market Structure Highs & Lows
This indicator identifies basic swing highs and lows based on simple two-candle patterns, giving traders a clean visual view of short-term market structure shifts.
🔹 Logic
A Swing High (H) is marked when an up candle is followed by a down candle.
→ The high of the up candle (the first one) is plotted as a green triangle above the bar.
A Swing Low (L) is marked when a down candle is followed by an up candle.
→ The low of the down candle (the first one) is plotted as a red triangle below the bar.
🔹 Purpose
This tool helps visualize basic market turning points — useful for:
Spotting local tops and bottoms
Analyzing market structure changes
Identifying potential entry/exit zones
Building the foundation for BOS/CHoCH strategies
🔹 Notes
Works on any timeframe or asset.
No repainting — signals appear after the confirming candle closes.
Simple and lightweight — ideal for traders who prefer clean structure visualization.
Probability H1/H4/D/W (Confirmations + Heatmap + Trend)Probability H1/H4/D/W (Confirmations + Heatmap + Trend) is a multi-timeframe market scanner that combines key confirmation signals and a robust trend heatmap to boost your trading decision-making.
What it does:
- Calculates bullish and bearish probabilities for every candle using five weighted factors: market structure shifts (BOS/CHOCH), RSI, MACD, volume changes, and price vs EMA position.
- Displays a real-time table with bullish/bearish probability scores, current trend (H1/H4/D/W), and a color-coded heatmap to instantly gauge market momentum.
- Confirms long/short entries with divergence detection and probability filters, showing clear signals on the chart.
- Customizable weighting lets you prioritize the signals that matter most to your strategy.
Core features:
• Multi-timeframe scan (H1, H4, Daily, Weekly)
• Visual probability table and heatmap
• Confirmation labels and builtin alerts for long/short signals
• Trend detection across four timeframes
• Flexible weighting of structural, momentum, and volume factors
Ideal for traders seeking a complete, rule-based confirmation toolkit that aligns trend, probability, and actionable alerts—all in a single glance. This indicator works for breakout, momentum, and swing traders needing clarity across multiple timeframes.

Multi Pivot Trend [BigBeluga]🔵 OVERVIEW
The Multi Pivot Trend is an advanced market-structure-driven trend engine that evaluates trend strength by scanning multiple pivot breakouts simultaneously.
Instead of relying on a single swing length, it tracks breakouts across ten increasing pivot lengths — then averages their behavior to produce a smooth, reliable trend reading.
Mitigation logic (close, wick, or HL2 touches) controls how breakouts are confirmed, giving traders institutional-style flexibility similar to BOS/CHoCH validation rules.
This indicator not only colors candles based on trend strength, but also extends trend strength and volatility-scaled projection candles to show where trend pressure may expand next.
Pivot breakout lines and labels mark key changes, making the trend transitions extremely clear.
🔵 CONCEPTS
Market trend strength is reflected by multiple pivot breakouts, not just one.
The indicator analyzes ten pivot structures from smaller to larger swings.
Each bullish or bearish pivot breakout contributes to trend score.
Mitigation options (close / wick / HL2) imitate smart-money breakout confirmation logic.
Trend score is averaged and translated into colors and extension bars.
Neutral regime ≈ weak trend or transition zone (trend compression).
🔵 FEATURES
Multi-Pivot Engine — tracks 10 pivot-based trend signals simultaneously.
Mitigation Modes :
• Close — breakout requires candle close beyond pivot
• Wicks — breakout requires wick violation
• HL2 — breakout confirmed when average (H+L)/2 crosses level
Dynamic Color System :
• Blue → confirmed bullish rotation
• Red → confirmed bearish rotation
• Orange → neutral / transition state
Breakout Visualization — draws pivot breakout lines in real-time.
Trend Labels — prints trend %.
Trend Volatility-Scaled Extension Candles — ATR/trend strength based candle projections show momentum continuation strength.
Gradient Pivot Encoding — higher pivot lengths = deeper structure considered.
🔵 HOW TO USE
Use strong blue/red periods to follow dominant structural trend.
Watch for color transition into orange — possible trend change or consolidation.
Pivot breakout lines help validate structure shifts without clutter.
Wick mitigation catches aggressive liquidity-sweep based breaks.
Close/HL2 mitigation catches cleaner market structure rotations.
Extension bars visualize trend pressure — large extensions = strong push.
Best paired with volume or volatility confirmation tools.
🔵 CONCLUSION
The Multi Pivot Trend is a structural trend recognition system that blends multiple pivot breakouts into one clean trend score — with institutional-style mitigation logic and volatility-projected trend extensions.
It gives traders a powerful, visually intuitive way to track momentum, spot trend rotations early, and understand true structural flow beyond simple MA-based approaches.
Use it to stay aligned with the dominant swing direction while avoiding noise and false flips.

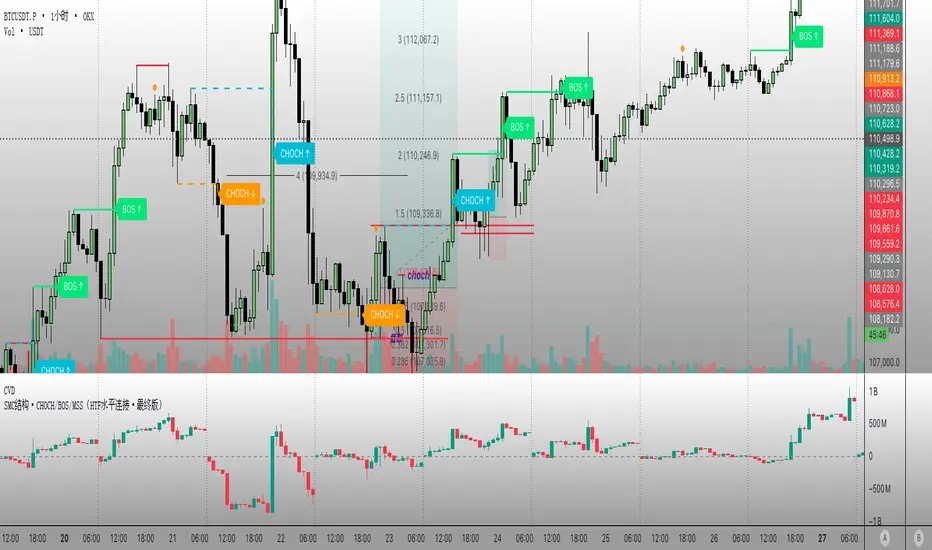
Smart Money Concepts ProSmart Money Concepts Pro
A professional-grade framework for visualizing institutional price behavior through key Smart Money Concepts. It automatically maps structure shifts, imbalances, and liquidity events so traders can study how price develops around supply and demand.
Core Components
Market Structure (BOS / CHoCH) — Detects continuation and reversal breaks using pivot-based logic with a close-beyond threshold and configurable cooldown.
Order Blocks — Highlights institutional footprints validated by volume and distance filters; zones extend until mitigation.
Fair Value Gaps — Marks three-bar inefficiencies that meet a minimum gap size and optionally auto-remove once filled by a user-defined percentage.
Liquidity Sweeps — Identifies stop-hunt wicks exceeding a configurable extension beyond recent highs or lows.
Premium / Discount Zones — Defines equilibrium and price positioning within recent swing ranges.
Confluence Entries (optional) — Generates neutral BUY / SELL markers only when structure, zone, and directional context align.
Dashboard — Summarizes current structure bias, recent events, zone counts, and directional alignment in real time.
Why it’s distinct
All detections are governed by explicit thresholds—volume multipliers, minimum distances, and fill-percent logic—so each signal results from quantifiable structure rather than heuristic pattern matching. Automatic cleanup ensures charts remain clear as zones are mitigated or gaps filled.
Best use
Applicable across Forex, indices, crypto, and equities. Designed for study on 15 m – 1 D timeframes.
For optimal alignment, pin plots to the Right Scale after adding the script.
Access
This indicator is public invite-only. Click Request Access on this page to apply. Access requests are manually reviewed.
Disclaimer: This script is provided for educational and analytical purposes only. It does not constitute financial or investment advice.