M.H Pee indicatorsHere is a collection of Trend Indicators as defined by M.H Pee and presented
in various articles of the "STOCKS & COMMODITIES Magazine"
The actual implementation of the indicators here are made by: everget
I thought they were rather cool, so I have gather them here so that they easily can be tested.
My own test was made using 15 companies from the OMXS30 list
during the time period of 2016-2018, and I only went LONG.
The result was as follows (Average Net Profit , StdDev):
TDI 3.04% 5.97
TTF 1.22%. 5.73
TII 1.07% 6.2
TCF 0.32% 2.68
Would be interesting to hear what other people get as test result from these indicators.
To do that just run this strategy, and chose the indicator from the setup menu.
Buscar en scripts para "2016年黄金价格"

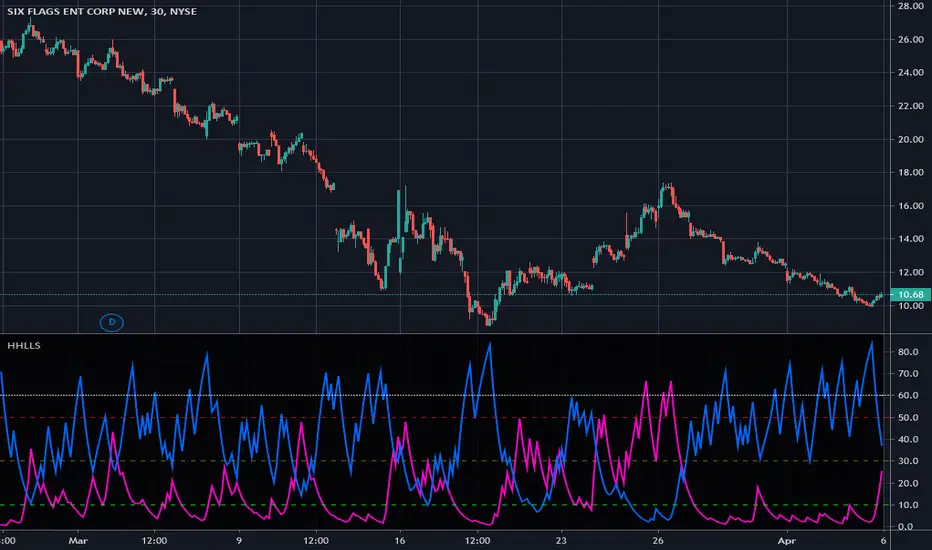
Higher Highs & Lower Lows Stochastics - Vitali ApirineThis is my modified "Higher Highs & Lower Lows Stochastics" employing PSv4.0, originally formulated by Vitali Apirine for TASC - February 2016 Traders Tips. Reading through a TASC magazine of mine, behold, I found a little known indicator that I can't find anywhere on all of Tradingview. That was a tragedy I felt I had to resolve... This indicator is best described as a dual momentum indicator, being helpful with anticipating reversals, spotting emerging trends, and defining correction periods. I felt it worthy of justice to unveil this for all TV members to utilize and also learn from. It's uniqueness is beyond past due for the honor it deserves on Tradingview.
As always, I have included advanced Pine programming techniques that conform to proper "Pine Etiquette". For those of you who are newcomers to Pine Script, this code release may also help you comprehend the "Power of Pine" by employing advanced programming techniques while exhibiting code utilization in a most effective manner. This script's uniqueness displays that we can now override built-in Pine functions. Firstly, you may have noticed that I replaced ema(), sma(), highest(), and lowest(). If you weren't aware of this Pine capability, well, here is a prime example... Now you know! Just heed caution when doing so to ensure your replacement algorithms are 100% sound. Lastly, I also added an additional "Median" line where the companion stochastics seemingly appear to gravitate within a central zone.
NOTICE: You may have observed, there is highest(), lowest(), ema(), and sma() custom functions overwriting Pine built-ins, some of which are audaciously used in ternary. "IF" you are planning to use Pine Script v4.0 functions in ternary, be forewarned, they WILL NOT operate as expected in most scenarios. The reason why I legitimately used them here in ternary is because they are ONLY manually controlled by an input(). If these were dynamically controlled with bar-to-bar dynamic conditional logic, you would most certainly run into serious unexpected programming issues, potentially resulting in hours of frustrations and guaranteed loss of hair. That's my lesson for this release, so never ever forget this when utilizing the full potential of the "Power of Pine". For more information concerning these potential dilemmas, please consult "Execution of Pine functions and historical context inside function blocks" in the "Pine Script v4 User Manual".
Features List Includes:
Dark Background - Easily disabled in indicator Settings->Style for "Light" charts or with Pine commenting
AND much, much more... You have the source!
The comments section below is solely just for commenting and other remarks, ideas, compliments, etc... regarding only this indicator, not others. When available time provides itself, I will consider your inquiries, thoughts, and concepts presented below in the comments section, should you have any questions or comments regarding this indicator. When my indicators achieve more prevalent use by TV members, I may implement more ideas when they present themselves as worthy additions. As always, "Like" it if you simply just like it with a proper thumbs up, and also return to my scripts list occasionally for additional postings. Have a profitable future everyone!
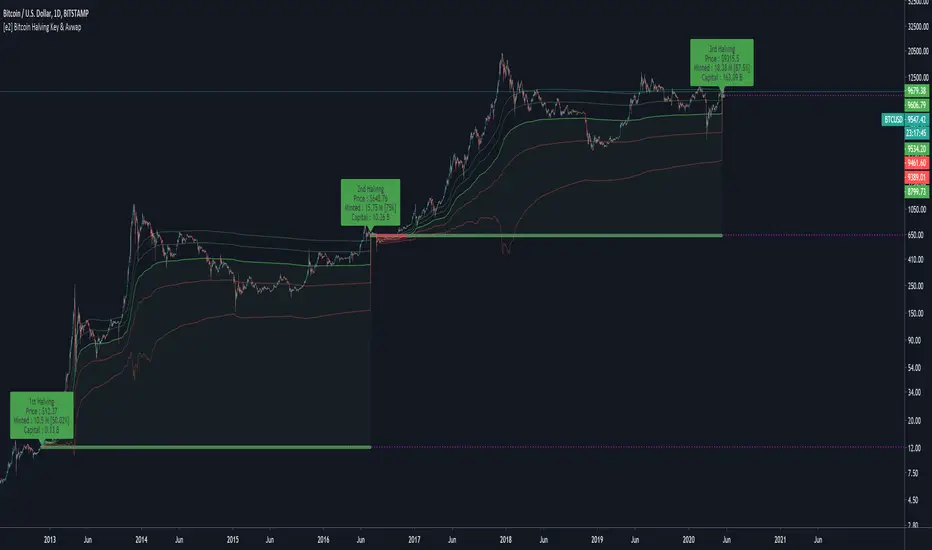
[e2] Bitcoin Halving Key & AvwapThis indicator shows a Key Level Support & Resistance level and VWAP that reset on your choice of the Bitcoin's halving date.
Optional Key Calculation Mode:
- Start with first (2012) or second (2016) halving date.
- Start with first and reset on the second (Halving to halving mode)
- Start with every next halving simultaneously (Halving + halving mode)
Labels show the Market Capitalization, total minted Bitcoins and Bitcoin's close price on the halving's date.
A maximum of 5 bands calculated using a factor of the anchored VWAP's standard deviation can be displayed.
Note
- The script is designed for Bitcoin markets only.
- Estimated 3rd halving, script will be updated when next halving occurs.
Stochastic Pop and Drop by Jake Bernstein v1 [Bitduke]I found a simple strategy by Jake Bernstein, modified it a little and created a strategy with Risk Management System (SL+TP); After that I test it on the different cryptocurrency pairs.
About the Indicator
Basically it's the strategy of 2 indicators: Stochastic Oscillator to define the bias and Average Directional Index to confirm it.
One again, It uses Stochastic Oscillator to define the trading bias. In particular, the trading bias was deemed bullish when the weekly 14-period Stochastic Oscillator was above some default value (in him paper - 50) and rising and vice versa.
Once the trading bias is established, Steckler used the Average Directional Index (ADX) to define a slowdown in the trend. ADX measures the strength of the trend and a move below 20 signals a weak trend.
Modifications
I didn't implement Average Directional Index (ADX) and test just different sources for data, oscillator periods and different levels in relation to the crypto market.
So, it shows good results with two tight thresholds at 55 and 45 level.
The bar chart below the defining the bullish and bearish periods (green and red) and gives a signal to enter the trade (purple bars).
Backtesting
Backtested on XBTUSD , BTCPERP (FTX) pairs. You may notice it shows good results on 3h timeframe.
Relatively low drawdown
~ 10% (from 2019 to date) FTX
~ 22% (4 years from 2016) Bitmex
I backtested on the different altcoin pairs as well, but the results were just not good.
Relatively good results were shown by some index pairs from the FTX exchange ( FTX:SHITPERP ), but I think there is a few data for backtesting to be asure in them.
Bitmex 3h (2017 - 2020) :
i.imgur.com
FTX 3h (2019 - 2020):
i.imgur.com
Possible Improvements
- Regarding trading algorithm it would be good to check with strategy with ADX somehow. Maybe for the better entries
- As for Risk Management system, it can be improved by adding trailing stop to the strategy.
Link: school.stockcharts.com

Voss Strategy (Filter + Trend Indicator) [Bitduke]Created strategy based on Voss Predictive Filter, implemented by TradingView user e2e4mfck.
Voss Predictive Filter
This is a relatively new filter from John F. Ehlers’ article, “A Peek Into The Future .” Ehlers describes the calculation of a new filter that could help signal cyclical turning points in markets.
But filter has a negative group delay and while an indicator based on it cannot actually see into the future, it may provide the trader with signals in advance of other indicators.
In mentioned article he tested filter on SPY and at one point in time "it went into a trend mode in January 2019, and the cycle signal failed miserably, signaling a short position during the runup. <...> The only way to minimize the impact of this condition is to employ an additional trend detector."
Thus I've added another Ehlers' based trend based indicator Instantaneous Trendline (thanks to LazyBear for implementation) to minimize the impact of the trend mode and got a good results on XBTUSD pair 4h.
Backtest :
> Range: 2016 - 2020
> XBTUSD
> 4h
> ~20% drawdown
> Sharpe (0.361, not too impressive)
I think it can be improved with Risk Management system and experimenting with various trend following indicators.

SAG Buy and Sell IndicatorThis script indicates a BUY or SELL signal based on the presence of events from 4 other indicators. The four other indicators are:
1) My Stochastic Triple Confirm from September 2016
2) Lazy Bear's Squeeze Momentum Indicator
3) A simple Relative Strength Index set to 9
4) A modified stochastic that I created
A buy signal must occur at the same time on all four indicators in order for this one to signal BUY. Conversely, a sell signal must occur at the same time on all four indicators for a SELL signal to appear here. Because it is rare for all four to perfectly signal BUY or SELL at the same bar point, this indicator will not signal frequently. However, when it signals it can benefit the user.
NO SIGNAL/INDICATOR IS PERFECT. This should be used as a helpful tool and not be a sole factor in making trading decisions. This signal has been very accurate (reliable greater than 97%) in back-testing. A winning position greater than 9 out of 10 times will work for most traders. Please provide feedback, thoughts, and critiques.

Peterbolic SARThe Peterbolic SAR indicator is based on Peter Brandt's 3 Day Trailing Stop Rule. The yellow triangles indicate setup candles, and the green and red triangles represent trigger candles to buy and sell, respectively.
Sawcruhteez asked me to create the code for this SAR. Gabriel Harber came up with the name for the SAR. Peter Brandt gave his permission to use his name.
For more information, see Sawcruhteez Streamz: Live Coaching Sessionz with Gabriel Harber - Trading Peterbolic SAR
and Peter Brandt's original description of the 3DTSR

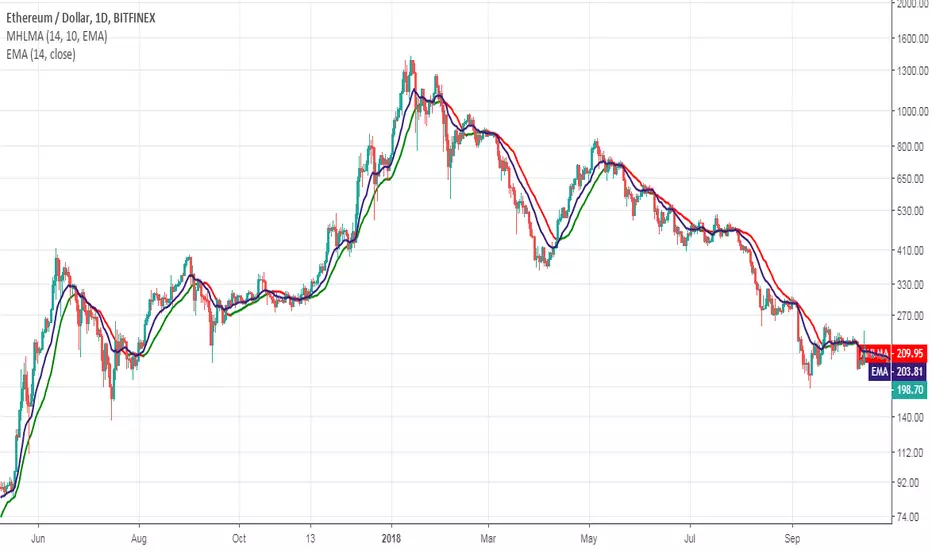
Optimal 4H Moving Average Ribbon for ETH
Stolen from Madrid Moving Average Ribbon : 2.0 : MMAR
madridjourneyonws.blogspot.com
Adapted for 4H optimal EMAs
This plots a moving average ribbon, please use the exponential not the standard.
It is based on a constant calculation of the most profitable EMAs to trade on the 4H time frame for Ethereum!
Thus the values will be updated with time as they change.
As an example trading the EMA 167 will return ~17742% (15.8.2019)on initial investment starting March 2016, compared to holding giving ~1225%.
It is a simple price breaks above EMAs to go long and break below to go short strategy but I recomened waiting for the full twist.
Lime : Uptrend. Long trading
Green : Reentry (buy the dip) or downtrend reversal warning
Red : Downtrend. Short trading
Maroon : Short Reentry (sell the peak) or uptrend reversal warning

Optimal 4H Moving Average Ribbon//
// Stolen from Madrid Moving Average Ribbon : 2.0 : MMAR
// madridjourneyonws.blogspot.com
// Adapted for 4H optimal EMAs
//
// This plots a moving average ribbon, please use the exponential not the standard.
// It is based on a constant calculation of the most profitable EMAs to trade on the 4H time frame for Ethereum!
// Thus the values will be updated with time as they change.
// As an example trading the EMA 167 will return ~17742% (15.8.2019)on initial investment starting March 2016, compared to holding giving ~1225%.
// It is a simple price breaks above EMAs to go long and break below to go short strategy but I recomened waiting for the full twist.
//
//
// Lime : Uptrend. Long trading
// Green : Reentry (buy the dip) or downtrend reversal warning
// Red : Downtrend. Short trading
// Maroon : Short Reentry (sell the peak) or uptrend reversal warning
//

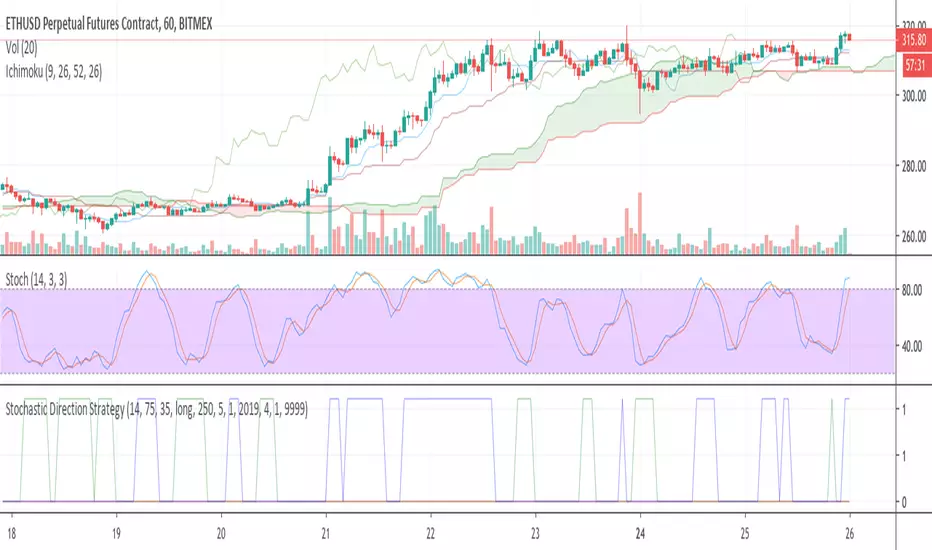
Stochastic Direction StrategyThis is a simple strategy based on the Stochastic Oscillator: stockcharts com/school/doku.php?id=chart_school:technical_indicators:stochastic_oscillator_fast_slow_and_full
Its purpose is to gradually build a position in a trending market (as of June 26th 2016 in most cryptocurrencies).
Inputs:
- direction (long/short)
- overbought/oversold
- close positions (yes/no to only increase positions)
Outputs:
- buy/sell/close signals plotted on a chart below
This script can easily be used as a TradingView study (for alerts) and a strategy (for backtesting). See the comments in the code.
I have added additional alert conditions to be used easily together with a trading bot reading the signals
Yet obviously you can also do manual trading on each alert.
Major Mayer MultipleAdjusted version of the BTC Mayer Multiple developed by Trace Mayer www.theinvestorspodcast.com
This version includes two novelties. The first one replaces BTC with Total Market Cap from 2016/2017 (depending on your moving averages) to present and the second is that we consider two Moving Averages to produce more detailed lows.

Middle-High-Low Moving AverageThis indicator was originally developed by Vitali Apirine (Stocks & Commodities , V.34:9 (August, 2016): "The Middle-High-Low Moving Average").
You can use it to create a crossover trading system in conjuction with EMA/SMA.
Good luck!
Mean-Reversion Swing Trading Strategy v1A port of the TradeStation EasyLanguage code for a mean-revision strategy described at
traders.com
"In “Mean-Reversion Swing Trading,” which appeared in the December 2016 issue of STOCKS & COMMODITIES, author Ken Calhoun
describes a trading methodology where the trader attempts to enter an existing trend after there has been a pullback.
He suggests looking for 50% pullbacks in strong trends and waiting for price to move back in the direction of the trend
before entering the trade."
See Also:
- 9 Mistakes Quants Make that Cause Backtests to Lie (blog.quantopian.com)
- When Backtests Meet Reality (financial-hacker.com)
- Why MT4 backtesting does not work (www.stevehopwoodforex.com)

Fractal Quad Components8 Fractal Resonance Component indicators on a chart eats up LOTS of vertical space, so we're providing this Fractal Quad Components script to group 4 components a bit more compactly (eliminating the margin whitespace between indicator rows).
To view 8 components you'll need to add a second instance of this script to your chart and set its Base Timescale Multiplier to 16. Then grab the dividers to stretch both instances to a good viewing height.
One disadvantage of this grouping method is that to read off the x2, x4, and x8 lead and lag line values, you'll need to mentally add 200, 400 or 600 respectively.
We also replaced the "Extreme" > +-100% black crosses (+) with more subtle purple circle outlines. These extreme crosses are often (but not always) too early to be a major reversal so it's best not to overemphasize them.
Significant crosses (> +-75%) are still highlighted with black circle outlines, and are the most likely to be major reversals for buy/sell.
Note how the 30-minute oscillator (2nd row) showed the cleanest (black-outlined) reversals on the S&P for the last week of 2016, with just a bit more profit-eating lag than the 15-minute oscillator above.

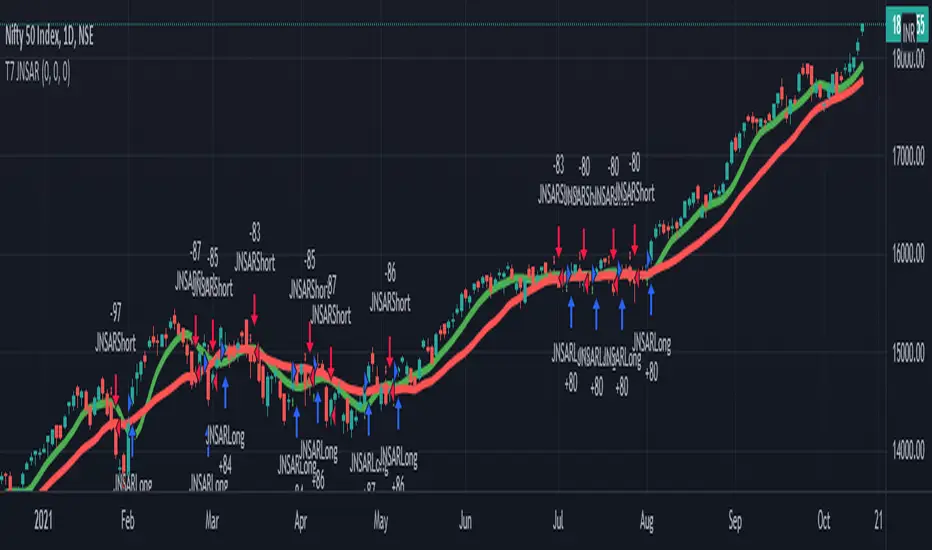
T7 JNSARUpdated code for the T7 JNSAR system earlier published here -
Following updates made to the code
1. Buy / Sell arrows now appear when the corresponding conditions are met.
2. Support for Heikin-Ashi Candles added
3. Different Backtesting Position Sizing Algorithms added for evaluation
Also am republishing the trading rules here again with some modification
1. Go Long when the daily close is above the JNSAR line. Go Short when the daily close is below the JNSAR line. JNSAR line is the varying green line overlayed over the price chart. Once a signal comes at market close enter in the direction of the signal @ market price @ next day market open.
2. Trade only Nifty Index. This system was developed and backtested only for NIFTY Index. So trade in its Futures or Options, as you may deem fit. My recommendation is to choose futures for simplicity. If you want to reduce the trading cost and go with options, trade with deep in the money options, preferably 2 strikes far from the spot price.
3. Trade all signals. Markets trend only 30-35% of the time and hence the system is only accurate to that extend. But system tends to make enough money, in this small trending window, to keep the overall profitability in good health. But one never knows when a big trend may come and when it comes its absolutely imperative that you take it. To ensure that, trade all signals and don't be choosy about what signals you are going to trade. Also I wouldn't recommend using your own analysis to trade this system. Too many drivers will crash the car.
4. Like all trend following systems, this system will have many whipsaws during flat markets along with large trade and account drawdowns. Also some months and even years may not be profitable. But to trade this system profitably, it is necessary to take these in one's stride and keep trading. As the backtester results from 1990 to 2016 proves, this system is profitable overall thus far. Take confidence from that objective fact.
5. Trade with only that amount of money you can afford to loose. Initial capital that you need to have to trade one lot of NIFTY should be atleast - (Margin Money required to take and hold 1 lot position + maximum drawdown amount per lot)*1.2. Be prepared to add more if need be, but the above formula will give a rough idea of what you need to have to start trading and be in the game always.
6. Place an After Market Order @ Market Price with your broker after market close so that you get to execute the trade next trading day @ Market open to capture near similar price as the daily open price seen on the chart. This execution mode will give you the best chance to minimise the slippage and mimic the backtester results as closely as practically possible.
7. Follow all the 6 rules above religiously, as if your life depends on it. If you cant, then don't trade this system; You will certainly loose money.
Happy Trading !!! As always am looking out for your valuable feedback.
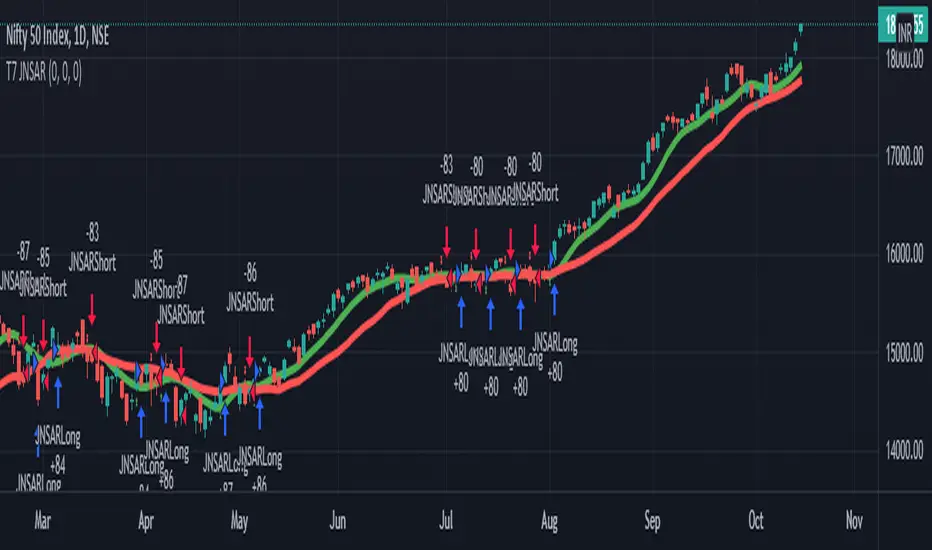
T7 JNSARJNSAR stands for Just Nifty Stop & Reverse. This is a trend following daily bar trading system for NIFTY. Original idea belongs to ILLANGO @ I coded the pine version of this system based on a request from @stocksonfire. Use it at your own risk after validation at your end. Neither me or my company is responsible for any losses you may incur using this system. Hope you like this system and enjoy trading it !!!
While trading this system you must follow these simple rules.
1. Go Long when the daily close is above the JNSAR line. Go Short when the daily close is below the JNSAR line. JNSAR line is the varying green line overlayed over the price chart. Once a signal comes at market close enter in the direction of the signal @ market price @ next day market open.
2. Trade only Nifty Index. This system was developed and backtested only for NIFTY Index. So trade in its Futures or Options, as you may deem fit. My recommendation is to choose futures for simplicity. If you want to reduce the trading cost and go with options, trade with deep in the money options, preferably 2 strikes far from the spot price.
3. Trade all signals. Markets trend only 30-35% of the time and hence the system is only accurate to that extend. But system tends to make enough money, in this small trending window, to keep the overall profitability in good health. But one never knows when a big trend may come and when it comes its absolutely imperative that you take it. To ensure that, trade all signals and don't be choosy about what signals you are going to trade. Also I wouldn't recommend using your own analysis to trade this system. Too many drivers will crash the car.
4. Like all trend following systems, this system will have many whipsaws during flat markets along with large trade and account drawdowns. Also some months and even years may not be profitable. But to trade this system profitably, it is necessary to take these in one's stride and keep trading. As the backtester results from 1990 to 2016 proves, this system is profitable overall thus far. Take confidence from that objective fact.
5. Initial capital that you need to have to trade one lot of NIFTY should be atleast - (Margin Money required to take and hold 1 lot position + maximum drawdown amount per lot)*1.2. Be prepared to add more if need be, but the above formula will give a rough idea of what you need to have to start trading and be in the game always.
6. Follow all the 5 rules above religiously as if your life depends on it. If you cant, then don't trade this system; You will certainly loose money.
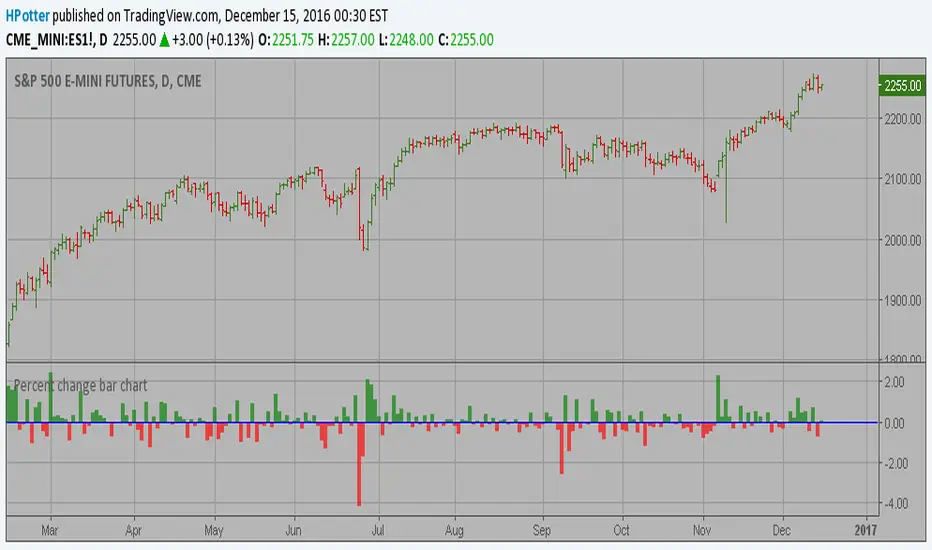
Percent change bar chart v 2.0 This histogram displays price or % change from previous bar.
Can be applied to any time frame.
15/12/2016 Update:
Number of digits after the floating point for study values on the axis now two.
JC_MacD_RSI_Candle_Strat_public//
// Author : Jacques CRETINON
// Last Version : V1.0 11-22-2016
//
// Risk disclaimer : Do not use this script in production environment. We assume no liability or responsibility for any damage to you, your computer, or your other property, due to the use of this script.
//
// Purpose of this script :
// 1- use same pine code for strategy or study script (with simple modifications)
// 2- be able to send alerts : enterlong, entershort, exitlong, exitshort, stoplosslong, stoplossshort, takeprofitlong, takeprofitshort in a study script like a strategy script should do
// 3- do not repaint (I HOPE)
//
// RoadMap :
// 1- manage : Trailing Stop Loss and Trailing Stop Loss offset
//
// I use this script :
// 1- with default value for XAUUSD, current chart resolution : 1mn, large timeframe : 15mn.
// 2- That's why I hard code MACD5 (5mn average), MACD15 (15mn average), MACD60 (1h average) ...
// 3- MACD, RSI (1mn and 15mn) and Candles info are my inputs to take any decisions
//
// I do not publish my enterLong, enterShort, exitLong and exitShort conditions (lines 204 to 207 are sample !) as they are not as perfect as I'd like. Fell free to use your own conditions :)
//
// Please, report me any bug, fell free to discuss and share. English is not my natural language, so be clement ;) Happy safe trading :)

Elhers Super Bandpass Filter by ShizaruThe original script was posted on ProRealCode by user Nicolas.
Source: traders.com
John Ehlers describe the trading rules of this new indicator as this:
Buy on the filter crossing above its -RMS line
Short on the filter crossing below its RMS line
Exit long when the filter either crosses below its RMS or crosses below -RMS (which signifies a false entry signal)
Cover short when the filter either crosses above its -RMS or crosses above RMS (which signifies a false entry signal)
Please leave a like or follow me if you use my indicators. Thanks!

CDC RSI Divergence 15-10-2016An updated version of CDC RSI Divergence
The last version have fixed reversal amount to weed out false signal.
The reversal amount, however, needs to be calibrated to different chart.
The new one uses ATR instead, user can customize the ATR multiplier.
THIS IS NOT A TRADING SIGNAL SYSTEM
though it can be used in such a way it is not designed to.
The system helps identify Bullish and Bearish Divergence to help trader change their bias accordingly and should be used in conjunction with a trend following signal.
BULLISH DIVERGENCE is displayed with a green fill over 50 line.
BEARISH DIVERGENCE is displayed with a red fill under 50 line.
The indicator start on the bar where divergence is detected and persists for another 25 bars for easy regcognition.

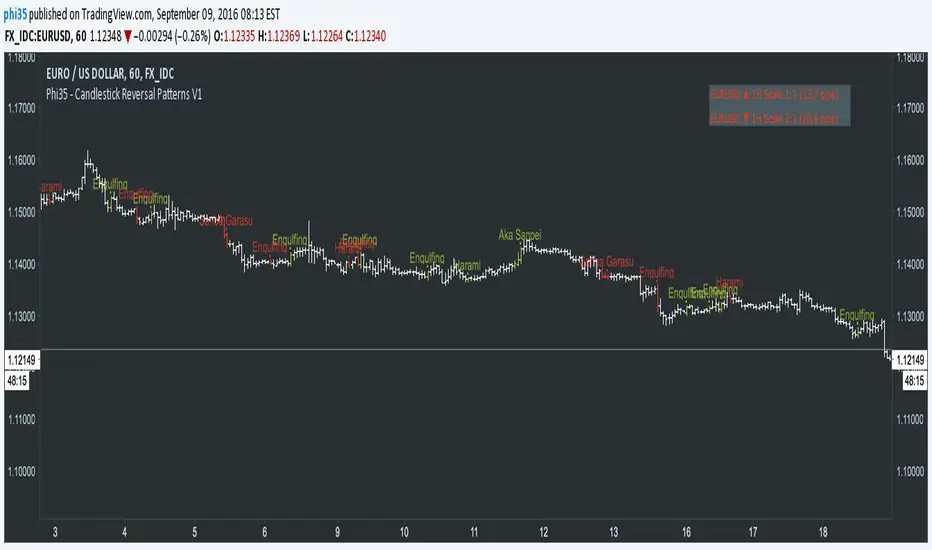
Phi35 - Candlestick Reversal Patterns V1 ©Candlestick Reversal Pattern V1 by Phi35 - 9rd September 2016 ©
Check also my " Candlestick Continuation Pattern " indicator which will follow soon!
Do not modify the code without my permission!
If there is an issue or any suggestions, feel free to contact me on the link below
www.tradingview.com
www.tradingview.com
It seems to work well but still no guarantee on completeness!
RISK WARNING! PAST PERFORMANCE IS NOT NECESSARILY INDICATIVE OF FUTURE RESULTS. IN MAKING AN INVESTMENT DECISION, TRADERS MUST RELY ON THEIR OWN EXAMINATION OF THE ENTITY MAKING THE TRADING DECISIONS!
Wait always for confirmation (next opening price or closing price)!!
RECOGNIZABLE REVERSAL PATTERNS
01.Engulfing
02.Harami
03.Piercing Line
04.Morning Star
05.Evening Star
06.Belt Hold
07.Three White Soldiers
08.Three Black Crows
09.Three Stars in the South
10.Stick Sandwich
11.Meeting Line
12.Kicking
13.Ladder Bottom
Although the Engulfing and Harami Patterns are important but can occur too often and give false signals, I give you the option to turn them completely off.
JPY GBP ROCsRate of change of most volatile JPY and GBP pairs. All pairs ending in JPY are red except GBPJPY (colored yellow --currently most volatile 7/2016). GBPNZD is blue, the other GBP pairs are green, lime and teal. GBPJPY and GBPNZD are my favorite day trading / swing trading pairs. This script allows me to see the action of the most volatile and liquid pairs on one screen. JPY pairs (ex-GBPJPY) are all red so that I see the flow of JPY not so much each pair and its name. Global movement of JPY is what I am after. Same for the coloring of GBP pairs as green expect GBPNZD as blue. ***** EURGBP is plotted as an opposite (with a negative in front of its sma. EURGBP is extremely correlated to GBPNZD, I decided to plot it also.

super bandpass filter by John EhlersNew indicator from John Ehlers, more info traders.com , strategy can find in the script
