AI AAdaptive Supertrend ChannelAI Supertrend Channel – The Adaptive Trend System
Beyond Basic Supertrend: An Intelligent Trading Framework
The AI Adaptive Supertrend Channel transcends traditional trend following indicators by delivering a self-optimizing trading system. Its core innovation is a triple-adaptive engine that automatically adjusts channel width based on real-time market conditions:
Market Efficiency Detection – Widens during clean trends, tightens in choppy ranges
Normalized Volatility – Scales appropriately to any asset's price level
Dynamic Momentum Response – Expands aggressively during powerful directional moves
The Result: A smarter tool that reduces false signals in consolidation while giving trends ample room to run—eliminating the constant parameter tweaking required by static indicators.
Visual Signal Framework & Strategic Applications
Channel Architecture:
Primary Trend Line (Thick Green/Red): Your dynamic trailing stop and core trend indicator. Green signals an uptrend (buying bias), Red signals a downtrend (selling bias).
Upper & Lower Bands: Form a dynamic support/resistance channel around the trend.
Mid-Line: A critical mean reversion level and the trigger for key early signals.
Trading Signals & Strategic Meaning:
Primary Signal: Momentum Diamonds (High Conviction)
💎 Green Diamond (Higher High): Price closes above the Upper Band after making a new high. Signals strong bullish momentum continuation. Ideal for adding to long positions or entering new longs in an established uptrend.
💎 Red Diamond (Lower Low): Price closes below the Lower Band after making a new low. Signals strong bearish momentum continuation. Ideal for adding to short positions or entering new shorts in a downtrend.
Secondary Signal: Mid-Line Crosses (Early Action)
🔼 Green Triangle (Bullish Mid-Line Cross - bullMidCross): Price crosses above the Mid-Line. This is an early bullish pullback signal within a larger uptrend or a potential early reversal sign in a downtrend. Use for early entries or to confirm the end of a bearish pullback.
🔽 Red Triangle (Bearish Mid-Line Cross - bearMidCross): Price crosses below the Mid-Line. This is an early bearish pullback signal within a larger downtrend or a potential early warning of weakness in an uptrend. Use for early short entries or to take profits on longs.
Practical Trading Strategies
Trend Following: Align trades with the Primary Trend Line color. Use the line itself as a dynamic stop-loss. The Momentum Diamonds confirm the trend's strength.
Pullback Trading: Use the Mid-Line Cross triangles (bullMidCross/bearMidCross) to identify high-probability entries during trend retracements. The channel bands provide natural profit targets.
Breakout Confirmation: A Momentum Diamond following a period of consolidation often confirms a genuine breakout, offering a signal to enter with the new momentum.
Optimal Settings Guide
Default (Universal)
For most markets, timeframes
ATR: 13 | ER: 144 | Channel Width: 0.7
Volatility Factor: 100 | Vol MA: HMA | Trend MA: EMA
Day Trading (Fast, Responsive)
*15M-1H charts, scalping*
ATR: 8 | ER: 89 | Channel Width: 0.6
Volatility Factor: 120 | Vol MA: EMA | Trend MA: WMA
*Swing Trading (Smooth, Conservative)*
*Daily-Weekly, position trading*
ATR: 21 | ER: 200 | Channel Width: 0.9
Volatility Factor: 80 | Vol MA: HMA | Trend MA: LINREG
Channel Width × Factor
0.5-0.7 → Tighter (more signals, less room)
0.8-1.2 → Wider (fewer signals, more room to run)
Volatility Regime Factor
50-80 → Less sensitive to volatility (stable markets)
100-150 → More sensitive (volatile markets like crypto)
Base ATR Length
8-13 → Faster signals (lower timeframes)
17-21 → Smoother signals (higher timeframes)
Quick Adjustments:
Whipsaws → Increase Channel Width × Factor
Lagging → Decrease ATR Length
Volatile markets → Increase Volatility Regime Factor
Start with Default, adjust one parameter at a time based on your market and trading style.
Pullback

ZynIQ Pullback Zones Lite - (Lite Pack)Overview
ZynIQ Pullback Zones Lite identifies dynamic EMA-based retracement areas inside trending markets. These zones highlight where price is most likely to pull back before continuing in the dominant direction. The tool is intentionally simple, visual, and designed to complement the rest of the ZynIQ Lite package without adding noise or complexity.
This is a contextual tool — ideal for timing continuation entries, filtering counter-trend trades, and improving overall trend structure awareness.
Key Features
• Dynamic pullback zones using profile-based EMA + ATR
• Smart trend detection with optional HTF confirmation
• Fresh-touch recognition for potential continuation setups
• Clean ZynIQ-themed visuals (teal/fuchsia zones)
• Lightweight chart footprint for intraday and swing traders
• ZynIQ Lite HUD with profile, trend and HTF status
• Moveable watermark for clear branding on streams and screenshots
• Alerts for long and short pullback opportunities
Use Cases
• Identifying pullback areas within established trends
• Avoiding early entries during retracements
• Timing continuation setups more cleanly
• Filtering false breakouts and counter-trend traps
• Combining with breakout or momentum tools for confluence
• Works on crypto, forex, indices and commodities
Notes
This tool provides structure and context for pullback-based trend trading.
It is not a standalone strategy and should be combined with your preferred confirmations and risk management rules.

ZynIQ Trend Master V2 - (Pro Pack)Overview
ZynIQ Trend Master v2 (Pro) provides a structured, multi-layered approach to trend analysis. It combines volatility-aware trend detection, adaptive cloud colouring, and pullback signalling to help traders see trend strength, continuation phases and potential shift points with clarity.
Key Features
• Multi-profile trend modes (Scalping / Intraday / Swing)
• Adaptive trend cloud with colour transitions based on strength
• Volatility-aware pullback detection
• Optional HTF trend alignment
• Clean labels marking key transitions
• Configurable filters for smoothing and responsiveness
• Lightweight visuals for fast intraday charting
Use Cases
• Identifying conditions where trend strength is increasing or weakening
• Timing entries during pullbacks within a trend
• Aligning intraday and HTF directional bias
• Combining with breakout, volume or market structure tools for confirmation
Notes
This tool provides structured trend context and momentum flow. It is not a trading system on its own. Use with your preferred confirmation and risk management.

Trend Pullback S-MSNRThis Indicator Identify two Major Time Frames for Trend Selection and Pullback.
NY time 10:00 AM to 10:15 AM zone will decide for trend.
NY time 10:30 AM to 11:30 AM zone will Pullback and Follow the Previous Trend.
Use S-MSNR Strategy for these two time Zone.

Momentum Market Structure ProThis first indicator in the Beyond Market Structure Suite gives you clear market structure at a glance, with adaptive support & resistance zones. It's the only SMC-style indicator built from momentum highs & lows, as far as I know. It creates dynamic support & resistance zones that change strength and resize intelligently, and gives you timely alerts when price bounces from support/rejects from resistance.
You’re free to use the provided entry and exit signals as a ready-to-use, self-contained strategy, or plug its structure into your existing system to sharpen your edge :
• Market structure bias may help improve a compatible system's win rate by taking longs only in bullish bias and shorts in bearish structure.
• Support/resistance can help trend traders identify inflection points, and help range traders define ranges.
🟩 HIGHLIGHTS
⭐ Unique market structure with different characteristics than purely price-based models.
⭐ Support and resistance created from only the extreme levels.
⭐ Support & resistance zones adapt to remain relevant. Zones are deactivated when they become too weak.
⭐ Long and short signals for a bounce from support/rejection from resistance.
🟩 WHY "MARKET STRUCTURE FIRST, ALWAYS"?
"There is only one side to the stock market; and it is not the bull side or the bear side, but the right side." — Jesse Livermore, Reminiscences of a Stock Operator (1923)
If the market is structurally against your trade, you're gonna have a bad time. So you must know what the market structure is before you plan your trade. The more precise and relevant your definition of market structure, the better.
🟩 HOW TO TRADE USING THIS INDICATOR (SIMPLE)
• Directional filter : The prevailing bias background can be used for any kind of trades you want to take. For example, you can long a bounce from support in a bullish market structure bias, or short a rejection from resistance in bearish bias.
• Entries : For more conservative entries, you could wait for a Candle Trend flip after a reaction from your chosen zone (see below for more about Candle Trend).
• Stops : The included running stop-loss level based on Average True Range (ATR) can be used for a stop-loss — set the desired multiplier, and use the level from the bar where you enter your trade.
• Take-profit : Similarly, you can set a Risk:Return-based take-profit target. Support and resistance zones can also be used as full or partial take-profit targets.
See the Advanced section below for more ideas.
🟩 SIGNALS
⭐ ENTRIES
You can enable signals and alerts for bounces from support and rejections from resistance (you'll get more signals using Adaptive mode). You can filter these by requiring corresponding market structure bias (it uses the bias you've already set for the background), and by requiring that Candle Trend confirm the move.
I've slipped in my all-time favourite creation to this indicator: Candle Trend. When price makes a Simple Low pivot, the trend flips bullish. When price then makes a Simple High pivot, the trend flips bearish (see my Market Structure library for a full explanation). This tool is so simple, yet I haven't noticed it anywhere else. It shows short-term trends beautifully. I use it mainly as confirmation of a move. You can use it to confirm ANY kind of move, but here we use it for bounces from support/rejections from resistance.
Note that the pivots and Zigzags are structure, not signals.
⭐ STOPS
You can use the supplied running ATR-based stop level to find a stop-loss level that suits your trading style. Set the desired multiplier, and use the level from the bar where you enter your trade.
⭐ TAKE-PROFIT
Similarly, you can set a take-profit target based on Risk:Return (R:R). If this setting is enabled, the indicator calculates the distance between the closing price and your configured stop, then multiplies that by the configured R:R factor to calculate an appropriate take-profit level. Note that while the stop line is reasonably smooth, the take-profit line varies much more, reflecting the fact that if price has moved away from your stop, the trade requires a greater move in order to hit a given R:R ratio.
Since the indicator doesn't know where you were actually able to enter a position, add a ray using the drawing tool and set an alert if you want to be notified when price reaches your stop or target.
🟩 WHAT'S UNIQUE ABOUT THIS INDICATOR
⭐ MOMENTUM PIVOTS
Almost all market structure indicators use simple Williams fractals. A very small number incorporate momentum, either as a filter or to actually derive the highs and lows. However, of those that derive pivots from momentum, I'm not aware of any that then create full market structure from it.
⭐ SUPPORT & RESISTANCE
Some other indicators also adjust S/R zones after creation, some use volume in zone creation, some increase strength for overlap, a few merge zones together, and many use price interactions to classify zones. But my implementation differs from others, as far as I can tell after looking at many many indicators, in seven specific ways:
+ Zones are *created* from purely high-momentum pivots, not derived or filtered from simple Williams pivots (e.g. `ta.pivothigh()`).
+ Zones are *weakened* dynamically as well as strengthened. Many people know that S/R gets stronger if price rejects from it, but this is only half the story. Different price patterns strengthen *or weaken* zones.
+ We use *conviction-weighted candle patterns* to adjust strength. Not simply +1 for price touching the zone, but a set of single-bar and multi-bar patterns which all have different effects.
+ The rolling strength adjustments are all *moderated by volume*. The *relative volume* forms a part of each adjustment pattern. Some of our patterns reward strong volume, some punish it.
+ We do our own candle modelling, and the adjustment patterns take this into account.
+ We *resize* zones as a result of certain candle patterns ("indecision erodes, conviction defends").
+ We shrink overlapping zones to their sum *and* add their strengths.
🟩 HOW TO TRADE USING THIS INDICATOR (ADVANCED)
In addition to the ideas in the How to Trade Using This indicator (Simple) section above, here are some more ideas.
You can use the market structure:
• As a bias for entries given by more reactive momentum resets, or indeed other indicators and systems.
• You could use a change in market structure to close a long-running trend-following position.
You can use the distance from a potential entry to the CHoCH line as a filter to choose higher-potential trades in ranging assets.
Confluence between market structure and your favourite trend indicator can be powerful.
Multi timeframe analysis
This is a bit of a rabbit hole, but you could use a split screen with this indicator on a higher timeframe (HTF) view of the same asset:
• If the 1D structure turns bullish, the next time that the 1H structure also flips bullish might be a good entry.
• Rejection from a HTF zone, confirmed by lower timeframe (LTF) structure, could be a good entry.
None of this is advice. You need to master your own system, and especially know your own strengths and weaknesses, in order to be a successful trader. An indicator, no matter how cool, is not going to one-shot that process for you.
In Adaptive mode, a skillful trader will be able to spot more opportunities to classify and use support and resistance than any algorithm, including mine, now that they've been automatically drawn for you.
If you are doing historical analysis, note that the "Calculated bars" setting is set to a reasonably small number by default, which helps performance. Either increase this number (setting to zero means "use all the bars"), or use Bar Replay to examine further back in the chart's history. If you encounter errors or slow loading, reduce this number.
🟩 SUPPORT & RESISTANCE
A support zone is an area where price is more likely to bounce, and a resistance zone is an area where price is more likely to reject. Marking these zones up on the chart is extremely helpful, but time-consuming. We create them automatically from only high-momentum areas, to cut noise and highlight the zones we consider most important.
In Simple mode, we simply mark S/R zones from momentum and Implied pivots. We don't update them, just deactivate them if price closes beyond them. Use this mode if you're interested in only recent levels.
In Adaptive mode, zones persist after they're traversed. Once the zones are created, we adjust them based on how price and volume interact with them. We display stronger zones with more opaque fills, and weaker zones with more transparent fills. To calculate strength, we first preprocess candles to take into account gaps between candles, because price movement after market is just as important in its own way. The preprocessing also redefines what constitutes upper and lower wicks, so as to better account for order flow and commitment. We use these modelled candle values, as well as their relative amplitude historically, rather than the raw OHLC for all calculations for interactions of price and zones. It's important to understand, when trying to figure out why the indicator strengthened or weakened a zone, that it sees fundamental price action in a different way to what is shown on standard chart candles (and in a way that can't easily be represented accurately on chart candles).
Then, we strengthen or weaken , and resize support and resistance zones dynamically using different formulas for different events, based on principles including these:
• The close is the market's "vote", the momentum shift anchor.
• Defended penetrations reveal validated liquidity clusters.
• Markets contract to defended levels.
• "The wick is the fakeout, but the close tells you if institutions held the level." — ICT (Inner Circle Trader)
Adaptive mode is more powerful, but you might need to tweak some of the Advanced Support & Resistance settings to get a comfortable number of zones on the chart.
🟩 MOMENTUM PIVOTS
The building blocks of market structure are Highs and Lows — places where price hits a temporary extreme and reverses. All the indicators I could find that create full market structure do so from basic price pivots — Williams fractals, being the highest/lowest candle wick for N candles backwards and forwards (there are some notable first attempts on TradingView to use momentum to define pivots, but no full structure). "Highest/lowest out of N bars" is the almost universal method, but it also picks up somewhat arbitrary price movements. Recognising this, programmers and traders often use longer lookbacks to focus on the more significant Highs and Lows. This removes some noise, but can also remove detail.
My indicator uses a completely different way of thinking about High and Low pivots. A High is where *momentum* peaks and falls back, and a low is where it dips and then recovers. While this is happening, we record the extremes in price, and use those prices as the High or Low pivot zones.
This deliberately picks out different, more meaningful pivots than any purely price-based approach, helping you focus on the swings that matter. By design, it also ignores some stray wicks and other price action that doesn't reflect significant momentum. Price action "purists" might not like this at first, but remember, ultimately we want to trade this. Check and see which levels the market later respects. It's very often not simply the numerically higher/lower local maxima and minima, but the levels that held meaning, interpreted here through momentum.
The first-release version uses the humble Stochastic as the structural momentum metric. Yes, I know — it's overlooked by most people, but that's because they're using it wrong. Stochastic is a full-range oscillator with medium excursions, unlike RSI, say, which is a creeping oscillator with reluctant resets. This makes Stoch (at the default period of 14) not quite reactive enough for on-the-ball momentum reset entry signals, but close to perfect (no metric is 100%) for structural pivots.
Stochastic is also a solid choice for structure because divergences are rare and not usually very far away in terms of price. More reactive momentum metrics such as Stochastic RSI produce very noisy structure that would take a whole extra layer of interpreting (see Further Research, below).
For these reasons, I may or may not add other options for momentum. In the initial release, I've added smoothed RSI as an alternative just to show it's possible, which takes even longer than Stochastic to migrate from one extreme to another, creating an interesting, longer-term structure.
🟩 IMPLIED PIVOTS
We want pivots to mark important price levels so that we can compute market direction and support & resistance zones from them.
In this context, we see that some momentum metrics, and Stochastic in particular, tend to give multiple consecutive resets in the same direction. In other words, we get High followed by High, or Low followed by Low, which does not give us the chance to create properly detailed structure. To remedy this, we simply take the most extreme price action between two same-direction pivots, and create an Implied pivot out of it, after the second same-direction pivot is created.
Obviously these pivots are created very late. Recalling why we wanted them, we realise that this is fine. By definition , price has not exceeded the Implied Pivot level when they're created. So they show us an interesting level that is yet untested.
Implied Pivots are thus created indirectly by momentum but defined directly by price. They are for structure only. We choose not to give them a Dow type (HH, HL, LH, LL) and not to include them in the Main Zigzag to emphasise their secondary nature. However, Implied Pivots are not "internal" or "minor" pivots. There is no such concept in the current Momentum Market Structure model.
If you want less responsive, more long-term structure, you can turn Implied Pivots off.
🟩 DOW STRUCTURE
Dow structure is the simplest form of market structure — Higher Highs (HHs) and Higher Lows (HLs) is an uptrend (showing buyer dominance), and vice-versa for a downtrend.
We label all Momentum (not Implied) Pivots with their Dow qualifier. You can also choose to display the background bias according to the Dow trend.
There is an input option to enable a "Ranging" Dow state, which happens when you get Lower Highs in an uptrend or Higher Lows in a downtrend.
🟩 SMC-STYLE STRUCTURE (BOS, CHOCH)
The ideas of trend continuation after taking out prior highs/lows and looking for early signs of possible reversal go back to Dow and Wyckoff, but have been popularised by SMC as Break Of Structure (BOS) and Change of Character (CHoCH).
BOS can be used as a trigger: for example:
• Wait for a bullish break of structure
• Then attempt to buy the pullback
• Cancel if structure breaks bearish (meaning, we get a bearish CHoCH break)
How to buy the pullback? This is the trillion-dollar question. First, you need solid structure. Without structure, you got nothin'. Then, you want some identified levels where price might bounce from.
If only we incorporated intelligent support and resistance into this very indicator 😍
Creating and maintaining correct BOS and CHoCH continuously , without resetting arbitrarily when conditions get difficult, is technically challenging. I believe I've created an implementation of this structure that is at least as solid as any other available.
In general, BOS is fully momentum‑pivot‑driven; CHoCH is anchored to momentum pivots but maintained mainly by raw price extremes relative to those anchors (breaks are obviously pure price). This means that the exact levels will sometimes differ from your previous favourite market structure indicator.
We have made some assumptions here which may or may not match any one person's understanding of the "correct" way to do things, including: BOS is not reset on wicks because, for us, if price cannot close beyond the BOS there is no BOS break, therefore the previous wick level is still important. The candidate for CHoCH on opposing CHoCH break *is* reset on a wick, because we want to be sure to overcome the leftover liquidity at that new extreme before calling a Change of Character. The CHoCH is moved on a BOS break. For a bullish BOS break, the new CHoCH is the lowest price *since the last momentum pivot was confirmed, creating the BOS that just broke*, and vice-versa for bearish. If there's a stray wick before that, which doesn't shift momentum, we don't care about it.
🟩 ZIGZAG
The Major Swing Zigzag dynamically connects momentum highs and lows (e.g., from a Higher Low to the latest Higher High), adjusting as new extremes form to reveal the overall trend leg.
The Implied Structure Zigzag joins momentum pivots and Implied pivots, if enabled.
🟩 REPAINTING
It's really important to understand two things before asking "Does it repaint?":
1. ALL structure indicators repaint, in the sense of drawing things into the past or notifying you of things that happened in past bars, because by definition, structure needs some kind of confirmation, which takes at least one bar, usually several. This is normal.
2. Almost all indicators of ANY kind repaint in that they display unconfirmed values until the current bar closes. This is also normal.
Most features of this indicator repaint in the ordinary, intended ways described above: the pivots (Implied doubly so), BOS and CHoCH lines, and formation of S/R zones.
The Zigzags, by design, adjust themselves to new pivots. The active lines often change and attach themselves to new anchors. This is a form of repainting. It's important to note that the Zigzags are not signals. They're there to help visualise market structure, and structure does change. Therefore, I prioritised clearly explaining what price did rather than preserving its history.
One of the "bad" kinds of repainting is if a signal is printed when the bar closes, but then on a later bar that "confirmed" signal changes. This is a fundamental issue with some high timeframe implementations. It's bad because you might already have entered a trade and now the indicator is pretending that it never signalled it for you. My indicators do not do this (in fact I wrote an entire library to help other authors avoid this).
If you are ever in any doubt, play with an indicator in Bar Replay mode to see exactly what it does.
To understand repainting, see the official docs: www.tradingview.com
🟩 FURTHER RESEARCH
I've attempted to answer two of the tricky problems in technical analysis in Pine: how to do robust and responsive market structure, and how to maintain support and resistance zones once created. However, this just opens up more possibilities. Which momentum metrics are suitable for structure? Can more reactive metrics be used, and how do we account for divergences in a structural model based on key horizontal levels? Which sets of rules give the best results for maintaining support and resistance? Does the market have a long or a short memory? Is bar decay a natural law or a coping mechanism?
🟩 CREDITS
❤️ I'd like to thank my humble trading mentor, whose brilliant ideas inspire me to garble out code. Thanks are also due to @Timeframe_Titans for guidance on the finer points of market structure (all mistakes and distortions are my own), and to @NJPorthos for feedback and encouragement during the months in the wilderness.
Script de pago

Best Entry Swing MASTER v3 PUBLIC (S.S)Strategy Description (English)
Best Entry Swing MASTER v3 – Quality Mode
The Best Entry Swing MASTER v3 is a structured swing trading and trend-following strategy designed to identify high-probability long and short entries during directional markets.
It combines three core setup types commonly used by momentum and breakout traders:
Breakout (BO)
Pullback Reversal (PB)
Volatility Contraction Pattern (VCP)
The strategy applies multiple layers of confirmation, including multi-EMA trend structure, volatility contraction, volume filters, and an optional market regime filter.
It is suitable for swing trading on higher timeframes (4H, Daily), as well as medium-term trend continuation setups.
Core Concepts
1. Trend Structure
A trend is considered valid when:
Uptrend: Price > EMA20 > EMA50 > EMA100
Downtrend: Price < EMA20 < EMA50 < EMA100
In addition, a simple but effective trend-strength metric is calculated using the percentage spread between EMA20 and EMA100.
This helps avoid signals during sideways or low-volatility environments.
2. Market Regime Filter
The market environment is determined using a higher timeframe benchmark (default: SPY on Daily).
Only long trades are allowed in bullish market conditions
Only short trades in bearish conditions
This significantly reduces false signals in counter-trend conditions.
Entry Logic
Breakout (BO)
A long breakout triggers when:
Price closes above the highest high of the lookback period
Volume exceeds its 20-period average
Trend and market regime confirm
(Optional A+ mode): true volatility contraction is required
Similar logic applies for short breakdowns.
Pullback (PB)
A pullback entry triggers after:
At least two corrective candles
A strong reversal candle (close above previous high for long)
Volume confirmation
Price interacts with EMA20
This structure models classical trend-reentry conditions.
Volatility Contraction Pattern (VCP)
A VCP entry triggers when:
True range contracts over multiple bars
Price holds near the breakout zone
Volume contracts
Trend and market regime are aligned
This setup aims to capture explosive continuation moves.
Quality Modes
The strategy offers two modes:
Balanced Mode
Moderate signal frequency
Broader trend-strength allowance
Suitable for more active traders
A+ Only Mode
Strict confirmation requirements
Only high-quality setups with multiple confluences
Designed to avoid low-probability trades entirely
Risk Management
Risk is managed using an ATR-based stop and target:
Long SL = Close − ATR × 1.5
Long TP = Close + ATR × 3
(Equivalent logic for short positions)
This provides a balanced reward-to-risk profile and avoids overly tight stops.
Early Entry Signals (Optional)
The script offers optional “Early Entry” markers that highlight when a setup is forming but not yet confirmed.
These are not entry signals and are disabled by default for public use.
Intended Use
This strategy is designed for:
Swing trading
Momentum continuation
Trend-following
Multi-day to multi-week trades
It performs best on:
4H
Daily
High-liquidity equities, indices, and futures
Disclaimer
This script is intended for educational and research purposes.
Past performance does not guarantee future results.
Always backtest thoroughly and use appropriate risk management.

Retracement Strategy [OmegaTools]Retracement Strategy is a systematic trend–retracement framework designed to identify directional opportunities after a confirmed momentum shift, and to manage exits using either trend reversals or overextension conditions. It is built around a smoothed RSI regime filter and a simple, price-based retracement trigger, making it applicable across a wide range of markets and timeframes while remaining transparent and easy to interpret.
The strategy begins by defining the underlying trend through a two-stage RSI signal. A standard RSI is computed over the user-defined Length input, then smoothed with a short moving average to reduce noise. Two symmetric thresholds are derived from the Threshold parameter: an upper band at 100 minus the threshold and a lower band at the threshold itself. When the smoothed RSI crosses above the upper band, the environment is classified as bullish and the internal trend state is set to uptrend. When the smoothed RSI crosses below the lower band, the environment is classified as bearish and the trend state becomes downtrend. When RSI moves back into the central zone between the two bands, the trend is considered neutral. In addition to the current trend, the strategy tracks the last non-neutral trend direction, which is used to detect genuine trend changes rather than transient oscillations.
Once a trend is established, the strategy looks for retracement entries in the direction of that trend. For long setups in an uptrend, it computes the lowest low over the previous Length minus one bars, excluding the current bar. A long signal is generated when price dips below this recent low while the trend state remains bullish. Symmetrically, for short setups in a downtrend, it computes the highest high over the previous Length minus one bars and enters short when price spikes above this recent high while the trend state remains bearish. This logic is designed to capture pullbacks against the prevailing RSI-defined trend, entering when the market tests or slightly violates recent extremes, rather than chasing breakouts. The candles are visually coloured to reflect the detected trend, highlighting bullish and bearish environments while keeping neutral phases distinguishable on the chart. An ATR-based measure is used solely to position the “UP” and “DN” labels on the chart for clearer visualisation of entry points; it does not directly influence position sizing or stop calculation in this implementation.
Take profit and stop loss behaviour are fully parameterized through the “Take Profit” and “Stop Loss” inputs, each offering three modes: None, Trend Change and Extension. When “Trend Change” is selected for the take profit, the strategy will only exit profitable positions when a confirmed trend reversal occurs. For a long position, this means that the strategy will close the trade when the trend state flips from uptrend to downtrend, and the last recorded trend direction validates that this is a genuine reversal rather than a neutral fluctuation; the same logic applies symmetrically for short positions. When “Extension” is selected as the take profit mode, the strategy closes profitable long trades when the smoothed RSI reaches or exceeds the upper threshold, interpreted as an overbought extension within the bullish regime, and closes profitable short trades when the smoothed RSI falls to or below the lower threshold, interpreted as an oversold extension within the bearish regime. When “None” is chosen, the strategy does not apply any explicit take profit logic, leaving trades to be managed by the stop loss settings or by user discretion in backtesting.
The stop loss parameter works in a parallel way. With “Trend Change” selected as stop loss, any open long position is closed when the trend flips from uptrend to downtrend, regardless of whether the trade is currently in profit or loss, and any open short is closed when the trend flips from downtrend to uptrend. This turns the RSI trend regime into a hard invalidation rule: once the underlying momentum structure reverses, the position is exited. With “Extension” selected for stop loss, long positions are closed when RSI falls back below the upper band and moves towards the opposite side of the range, while short positions are closed when RSI rises above the lower band and moves towards the upper side. In practice, this acts as a dynamic exit based on the oscillator moving out of a favourable context for the existing trade. Selecting “None” for stop loss disables these automatic exits, leaving only the take profit logic, if any, to manage the position. Because take profit and stop loss configuration are independent, the user can construct different profiles, such as pure trend-change exits on both sides, pure overextension exits, or a mix (for example, take profit on overextension and stop loss on trend reversal).
This strategy is designed as an analytical and backtesting framework rather than a finished plug-and-play trading system. It does not include position sizing, risk-per-trade controls, multi-timeframe confirmation, volatility filters or instrument-specific fine-tuning. Its primary purpose is to provide a clear, rule-based structure for testing retracement logic within RSI-defined trends, and to allow users to explore how different exit regimes (trend-change based versus extension based) affect performance on their instruments and timeframes of interest.
Nothing in this script or its description should be interpreted as financial advice, investment recommendation or solicitation to buy or sell any financial instrument. Past performance on backtests does not guarantee future results. The behaviour of this strategy can vary significantly across symbols, timeframes and market conditions, and correlations, volatility and liquidity can change without warning. Before considering any live application, users should thoroughly backtest and forward test the strategy on their own data, adjust parameters to their risk profile and instrument characteristics, and integrate proper money management and trade management rules. Use of this script is entirely at the user’s own risk.

QuantMotions - TPR Sentinel LineTPR Sentinel Line is an advanced adaptive Support/Resistance system that combines multi-layered trend analysis with a directional Time-Price Ratio (TPR) engine. The indicator dynamically builds a stabilized support or resistance line that adjusts to market volatility, trend strength, ATR expansion and contraction, and real-time slope changes.
This creates a high-precision, self-adjusting trend barrier that acts as support in uptrends, resistance in downtrends, and a neutral anchor during sideways phases.
Key Features
✔ Adaptive Trend Base
- A composite trend model blending:
- Kijun-style midpoint
- Donchian midline
- SMA & EMA smoothing
This creates a stable baseline that reacts smoothly but reliably to structural trend shifts.
✔ Directional TPR Calculation
The indicator measures slope across short, medium, and long trend windows, normalizes it with ATR, and determines:
- Trend direction
- Trend strength
- Momentum quality
✔ Dynamic Support/Resistance Line
Depending on trend direction:
- In uptrends → the line becomes adaptive support
- In downtrends → the line becomes adaptive resistance
- In neutral phases → the line centers around the smoothed trend base
A built-in lag factor prevents unrealistic jumps and keeps the level stable.
✔ Automatic Support/Resistance Zones
The indicator expands the main line into upper and lower zones based on ATR and trend strength, creating a dynamic volatility envelope around the trend structure.
✔ Signals & Alerts
- Support bounce
- Resistance rejection
- Breakouts above/below the dynamic line
These events help identify high-probability continuation or reversal moments.
✔ Information Panel
A real-time status table displays:
- Trend direction
- Trend strength
- Current S/R level
🎯 Ideal For
- Precision entries on pullbacks
- Detecting trend shifts earlier
- Identifying strong or weak trend phases
- Adaptive take-profit and stop-loss zones
- Filtering false breakouts
💡 Summary
TPR Sentinel Line gives you a living, breathing support/resistance structure that evolves with the market.
Instead of relying on static levels, you get a continuously adapting trend barrier that reflects real strength, real volatility, and real momentum.
A powerful tool for traders who want structure, clarity, and trend confidence.

9/15 EMA Scalper 9/15 EMA Scalper — by uzairbaloch
This script is a price-action based scalping system built around the 9 EMA and 15 EMA trend structure.
It identifies short-term reversal points where the market pulls back into the EMAs and confirms direction with a strong candle signal.
The strategy looks for:
• A clear EMA trend (9 above 15 for buys, 9 below 15 for sells)
• Pullback into EMA9/EMA15 with candle bodies touching the fast EMA
• Strong confirmation candle (engulfing / strong momentum / controlled wick)
• Optional slope filter to avoid flat, choppy sessions
• Automatic trade labels showing Entry, SL and TP (based on R:R)
The script is designed for scalping on gold, indices, and high-volatility FX pairs.
It resets trade logic immediately after SL or TP is hit, so it can catch the next valid signal without delay.
This tool is meant as an indicator — not a full strategy — and can be used to visually mark high-probability EMA pullback setups with precise levels.
Author: uzairbaloch

Breakouts & Pullbacks [Trendoscope®]🎲 Breakouts & Pullbacks - All-Time High Breakout Analyzer
Probability-Based Post-Breakout Behavior Statistics | Real-Time Pullback & Runup Tracker
A professional-grade Pine Script v6 indicator designed specifically for analyzing the historical and real-time behavior of price after strong All-Time High (ATH) breakouts. It automatically detects significant ATH breakouts (with configurable minimum gap), measures the depth and duration of pullbacks, the speed of recovery, and the subsequent run-up strength — then turns all this data into easy-to-read statistical probabilities and percentile ranks.
Perfect for swing traders, breakout traders, and anyone who wants objective, data-driven insight into questions like:
“How deep do pullbacks usually get after a strong ATH breakout?”
“How many bars does it typically take to recover the breakout level?”
“What is the median run-up after recovery?”
“Where is the current pullback or run-up relative to historical ones?”
🎲 Core Concept & Methodology
Indicator is more suitable for indices or index ETFs that generally trade in all-time highs however subjected to regular pullbacks, recovery and runups.
For every qualified ATH breakout, the script identifies 4 distinct phases:
Breakout Point – The exact bar where price closes above the previous ATH after at least Minimum Gap bars.
Pullback Phase – From breakout candle high → lowest low before price recovers back above the breakout level.
Recovery Phase – From the pullback low → the bar where price first trades back above the original breakout price.
Post-Recovery Run-up Phase – From the recovery point → current price (or highest high achieved so far).
Each completed cycle is stored permanently and used to build a growing statistical database unique to the loaded chart and timeframe.
🎲 Visual Elements
Yellow polyline triangle connecting Previous ATH / Pullback point(start), New ATH Breakout point (end), Recovery point (lowest pullback price), and extends to recent ATH price.
Small green label at the pullback low showing detailed tooltip on hover with all measured values
Clean, color-coded statistics table in the top-right corner (visible only on the last bar)
Powerful Statistics Table – The Heart of the Indicator
The table constantly compares the current situation against all past qualified breakouts and shows details about pullbacks, and runups that help us calculate the probability of next pullback, recovery or runup.
🎲 Settings & Inputs
Minimum Gap
The minimum number of bars that must pass between breaking a new ATH and the previous one.
Higher values = stricter filter → only the strongest, cleanest breakouts are counted.
Lower values = more data points (useful on lower timeframes or very trending instruments).
Recommendation:
Daily charts: 30–50
4H charts: 40–80
1H charts: 100–200
🎲 How to Use It in Practice
This indicator helps investors to understand when to be bullish, bearish or cautious and anticipate regular pullbacks, recovery of markets using quantitative methods.
The indicator does not generate buy/sell signals. However, helps traders set expectations and anticipate market movements based on past behavior.

ATR Trend + RSI Pullback Strategy [Profit-Focused]This strategy is designed to catch high-probability pullbacks during strong trends using a combination of ATR-based volatility filters, RSI exhaustion levels, and a trend-following entry model.
Strategy Logic
Rather than relying on lagging crossovers, this model waits for RSI to dip into oversold zones (below 40) while price remains above a long-term EMA (default: 200). This setup captures pullbacks in strong uptrends, allowing traders to enter early in a move while controlling risk dynamically.
To avoid entries during low-volatility conditions or sideways price action, it applies a minimum ATR filter. The ATR also defines both the stop-loss and take-profit levels, allowing the model to adapt to changing market conditions.
Exit logic includes:
A take-profit at 3× the ATR distance
A stop-loss at 1.5× the ATR distance
An optional early exit if RSI crosses above 70, signaling overbought conditions
Technical Details
Trend Filter: 200 EMA – must be rising and price must be above it
Entry Signal: RSI dips below 40 during an uptrend
Volatility Filter: ATR must be above a user-defined minimum threshold
Stop-Loss: 1.5× ATR below entry price
Take-Profit: 3.0× ATR above entry price
Exit on Overbought: RSI > 70 (optional early exit)
Backtest Settings
Initial Capital: $10,000
Position Sizing: 5% of equity per trade
Slippage: 1 tick
Commission: 0.075% per trade
Trade Direction: Long only
Timeframes Tested: 15m, 1H, and 30m on trending assets like BTCUSD, NAS100, ETHUSD
This model is tuned for positive P&L across trending environments and volatile markets.
Educational Use Only
This strategy is for educational purposes only and should not be considered financial advice. Past performance does not guarantee future results. Always validate performance on multiple markets and timeframes before using it in live trading.

HTF MACD Dual Zero Cross + First EMA PullbackThis script aims to get the trader on the right side of the momentum and get better entries by only alerting when price pulls back to the trader's specified EMA.
This script isnt meant to catch tops or bottoms but to trade with the momentum once it starts.
This script will alert whe nthe MACD and signal line both cross the zero line, after that the script waits for price to make a pullback and then alet either a sell or buy. Ive found this works best when you trade with the trend on a higher timeframe.
You can use whatever MACD settings you prefer and really customize this to the asset youre trading.
You can also change whether you get an alert based on a wick touch of the EMA or a candle close.

Reversals & Pullbacks PRO🚀 Reversals & Pullbacks Pro — Predict Market Turning Points with Precision
Stop chasing trends — start anticipating them.
The Reversals & Pullbacks Pro indicator identifies high-probability reversal and pullback zones before they happen, using advanced mean reversion logic and momentum change signals.
What it does:
✅ Detects major reversals and minor pullbacks in real time
✅ Uses dynamic mean reversion algorithms to spot over-extended price moves
✅ Highlights premium entry zones for counter-trend and trend-reversal setups
✅ Works across many markets — Designed for Forex and Indices but can be used on Crypto
✅ Clean visuals with smart alerts (no repainting after candle close)
💡 Perfect for:
Swing traders, scalpers, and day traders who want to catch price turning points before everyone else.
⏱️ Don’t react — predict.
Upgrade your trading with Reversals & Pullback Pro and trade market reversals like a PRO!

O5 EMA Cloud 20/50 + Pullback Touch Alerts (Bull/Bear Filter)This indicator shows an EMA cloud that is set to Fast=20 and Slow=50 by default, but can be changed.
It features suggested entry signals when price pulls back to either EMA level in both uptrends and downtrends.
Buy signals print only when price pulls back to one of the EMA levels and closes up.
Bearish signals only print when price pulls back to one of the EMA levels and closes down.
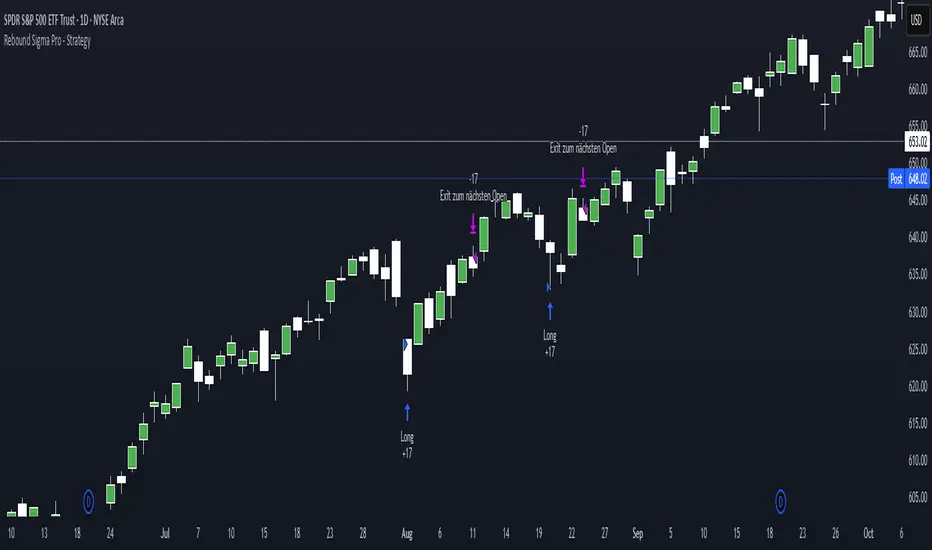
Rebound Sigma Pro - IndicatorOverview
Rebound Sigma Pro is a mean-reversion indicator that detects statistically oversold conditions in trending markets.
It helps traders identify potential short-term rebounds based on momentum exhaustion and volatility-adjusted entry zones.
Concept
The indicator combines two quantitative components:
Short-term momentum to detect short-term exhaustion
Trend filter to ensure setups align with the long-term direction
When a stock in an uptrend becomes temporarily oversold, a limit-entry signal is plotted.
The trade is then tracked until short-term conditions normalize or a time-based exit occurs.
Visual Signals
Green Triangle: Suggests placing a limit order for the next session
Green Circle: Confirms entry was filled
Red Triangle: Signals an exit for the next session’s open
Orange Background: Pending order
Green Background: Position active
Red Background: Exit phase
Yellow Line: Entry reference price
User Inputs
Limit Entry (% below previous close) – Default 1 %
Use Limit Entry – Switch between limit or market entries
Enable Time Exit – Optional holding-period constraint
Maximum Holding Days
All other internal parameters (momentum length, filters) are pre-configured.
Alerts
Limit Order Signal: New setup detected
Entry Confirmed: Order filled
Exit Signal: Exit expected next day
Usage
Designed for liquid equities and ETFs
Works best in confirmed uptrends
Backtesting encouraged to adapt parameters per symbol and timeframe
Notes
Not an automated strategy; manual order execution required
Past behavior does not imply future performance
Always apply sound position sizing and risk management
Disclaimer
This indicator is provided for educational and analytical purposes only.
It does not constitute financial advice or performance assurance.

Rebound Sigma Pro - StrategyOverview
Rebound Sigma Pro is a mean-reversion indicator that detects statistically oversold conditions in trending markets.
It helps traders identify potential short-term rebounds based on momentum exhaustion and volatility-adjusted entry zones.
Concept
The indicator combines two quantitative components:
Short-term momentum to detect short-term exhaustion
Trend filter to ensure setups align with the long-term direction
When a stock in an uptrend becomes temporarily oversold, a limit-entry signal is plotted.
The trade is then tracked until short-term conditions normalize or a time-based exit occurs.
Visual Signals
Green Triangle: Suggests placing a limit order for the next session
Green Circle: Confirms entry was filled
Red Triangle: Signals an exit for the next session’s open
Orange Background: Pending order
Green Background: Position active
Red Background: Exit phase
Yellow Line: Entry reference price
User Inputs
Limit Entry (% below previous close) – Default 1 %
Use Limit Entry – Switch between limit or market entries
Enable Time Exit – Optional holding-period constraint
Maximum Holding Days
All other internal parameters (momentum length, filters) are pre-configured.
Alerts
Limit Order Signal: New setup detected
Entry Confirmed: Order filled
Exit Signal: Exit expected next day
Usage
Designed for liquid equities and ETFs
Works best in confirmed uptrends
Backtesting encouraged to adapt parameters per symbol and timeframe
Notes
Not an automated strategy; manual order execution required
Past behavior does not imply future performance
Always apply sound position sizing and risk management
Disclaimer
This indicator is provided for educational and analytical purposes only.
It does not constitute financial advice or performance assurance.
Trade PullBack - EMA Pullback System with Auto Risk-Reward# Trade Pull Back - Professional Pullback Trading System
## 📊 Overview
**Trade Pull Back** is a comprehensive pullback trading system that combines trend-following principles with precise entry timing using candlestick pattern confirmation. This indicator is designed for traders who want to enter trending markets at optimal retracement levels with pre-calculated risk-reward ratios.
---
## 🎯 Core Methodology
### Why This System Works
Most traders struggle with two key challenges:
1. **Entering too early** - jumping into trades before the pullback completes
2. **Entering too late** - missing the momentum after the pullback reverses
This system solves both problems by using a **3-Phase Confirmation Process**:
**Phase 1: Trend Identification** → **Phase 2: Pullback Detection** → **Phase 3: Reversal Confirmation**
---
## 🔧 How It Works
### 1. Triple EMA Framework (The Foundation)
Unlike traditional single EMA systems, this indicator uses **3 separate EMAs** with different purposes:
- **EMA Trend (default: 50)** - Determines the overall market direction
- Source: HL/2 for balanced trend reading
- Acts as the primary filter - we only trade in its direction
- **EMA High (default: 20)** - Dynamic resistance in uptrends
- Source: High prices for accurate resistance mapping
- Entry trigger for bullish setups when price closes above it
- **EMA Low (default: 20)** - Dynamic support in downtrends
- Source: Low prices for accurate support mapping
- Entry trigger for bearish setups when price closes below it
**Why 3 EMAs?**
- Single EMA can't distinguish between trend and pullback zones
- Two EMAs (like MACD) don't provide clear entry/exit levels
- Three EMAs create a **channel system** that identifies both trend direction AND optimal entry zones
### 2. Pattern Recognition Engine
The system detects two high-probability reversal patterns:
#### Engulfing Patterns
- **Bullish Engulfing**: Previous bearish candle completely engulfed by bullish candle
- **Bearish Engulfing**: Previous bullish candle completely engulfed by bearish candle
- Validates: Strong momentum reversal with volume confirmation
#### Pin Bar Patterns
- **Bullish Pin Bar (Hammer)**: Long lower wick (60%+ of total range) rejecting lower prices
- **Bearish Pin Bar (Inverted Hammer)**: Long upper wick (60%+ of total range) rejecting higher prices
- Validates: Institutional rejection at support/resistance levels
**Pattern Quality Filter:**
- Body-to-wick ratio must meet minimum standards
- Checks previous candle momentum
- Requires trend alignment before signaling
### 3. Pullback Confirmation System
The system includes **5 mandatory conditions** before generating a signal:
#### For Bullish Signals (BUY):
1. ✅ Close > EMA Trend (uptrend confirmed)
2. ✅ EMA High > EMA Trend AND EMA Low > EMA Trend (healthy trend structure)
3. ✅ Bullish Engulfing OR Bullish Pin Bar (pattern detected)
4. ✅ Close > EMA High (breakout confirmation)
5. ✅ Optional: Low < EMA High (pullback occurred)
#### For Bearish Signals (SELL):
1. ✅ Close < EMA Trend (downtrend confirmed)
2. ✅ EMA High < EMA Trend AND EMA Low < EMA Trend (healthy trend structure)
3. ✅ Bearish Engulfing OR Bearish Pin Bar (pattern detected)
4. ✅ Close < EMA Low (breakdown confirmation)
5. ✅ Optional: High > EMA Low (pullback occurred)
**Additional Filters:**
- **Consecutive Bars Check**: Ensures pullback had momentum (1-5 bearish/bullish bars)
- **Signal Spacing**: Minimum 4 bars between signals to avoid noise
- **Confirmation Delay**: Signal appears only AFTER bar closes (no repainting)
---
## 💰 Automatic Risk-Reward Calculator
### Smart Position Sizing
When a signal triggers, the system automatically calculates:
**For Long Positions:**
- **Entry**: High of signal candle
- **Stop Loss**: Lower of last 2 candle lows (protects against false breakouts)
- **Target 1 (1R)**: Entry + 1x Risk
- **Target 2 (2R)**: Entry + 2x Risk
- **Target 3 (3R)**: Entry + 3x Risk
**For Short Positions:**
- **Entry**: Low of signal candle
- **Stop Loss**: Higher of last 2 candle highs
- **Targets**: Calculated based on risk multiple
### Auto-Remove Feature
Lines and labels automatically disappear when:
- Price hits Stop Loss (trade invalidated)
- Price reaches 3R target (trade complete)
This keeps your chart clean and focuses only on active trades.
---
## 📈 Multi-Timeframe Trend Analysis
### Confluence Trading
The built-in MTF trend box shows trend status across 7 timeframes simultaneously:
- M1, M5, M15, M30, H1, H4, D1
**Color Coding:**
- 🟢 **Green**: Uptrend (Price > EMA Trend AND EMAs aligned bullish)
- 🔴 **Red**: Downtrend (Price < EMA Trend AND EMAs aligned bearish)
- ⚪ **Gray**: No clear trend
**Why This Matters:**
- Trade with higher timeframe trends for better win rate
- Avoid counter-trend trades when all timeframes show same direction
- Identify divergences between timeframes for reversal opportunities
---
## 🎨 Customization Options
### EMA Settings
- Adjust periods for different trading styles (scalping vs swing trading)
- Choose price sources (HL/2, Close, HLC/3) for sensitivity tuning
### Pattern Selection
- Enable/disable Engulfing patterns
- Enable/disable Pin Bar patterns
- Trade only your preferred pattern type
### Signal Filters
- **Require Pullback**: Force pullback condition (stricter entries)
- **Consecutive Bars**: Set momentum requirement (1-5 bars)
### Display Options
- Show/hide EMA lines
- Show/hide signals
- Enable/disable alerts
- Customize Risk-Reward line styles and extensions
---
## 📋 How to Use This Indicator
### Step 1: Identify the Trend
- Wait for price to establish clear direction relative to EMA Trend (50)
- Check MTF box to confirm higher timeframe alignment
### Step 2: Wait for Pullback
- In uptrend: Watch for price to pull back toward EMA High
- In downtrend: Watch for price to pull back toward EMA Low
### Step 3: Pattern Confirmation
- Look for Engulfing or Pin Bar pattern (triangle/diamond markers)
- Ensure pattern forms at or near the EMA High/Low zone
### Step 4: Entry & Risk Management
- Enter when signal appears (after bar closes)
- Use displayed Stop Loss and Take Profit levels
- Consider partial profits at 1R and 2R, let remainder run to 3R
### Step 5: Trade Management
- If price hits SL, lines disappear automatically (trade invalidated)
- If price reaches 3R, lines disappear (trade complete)
- Consider trailing stop after 1R is reached
---
## ⚙️ Recommended Settings
### For Scalping (M1-M5)
- EMA Trend: 20-30
- EMA High/Low: 10-15
- Require Pullback: OFF
- Consecutive Bars: 1
### For Day Trading (M15-H1)
- EMA Trend: 50 (default)
- EMA High/Low: 20 (default)
- Require Pullback: ON
- Consecutive Bars: 2-3
### For Swing Trading (H4-D1)
- EMA Trend: 100-200
- EMA High/Low: 50
- Require Pullback: ON
- Consecutive Bars: 3-5
---
## ✅ What Makes This Script Original
### 1. Systematic Approach
This isn't just a collection of indicators. It's a **complete trading system** with:
- Defined entry rules (5-point confirmation checklist)
- Automatic risk management (SL/TP calculation)
- Trade validation (consecutive bars, signal spacing)
### 2. Smart EMA Framework
The 3-EMA system creates a **dynamic channel** that adapts to market conditions:
- Trend EMA = Direction filter
- High/Low EMAs = Entry/Exit zones
- Together they form a "trade zone" that standard EMAs can't provide
### 3. Pattern Quality Control
Not all Engulfing or Pin Bar patterns are equal. This system:
- Validates body-to-wick ratios
- Checks previous candle momentum
- Requires trend alignment before signaling
### 4. Auto Risk-Reward Management
Most indicators just show signals. This one:
- Calculates exact entry prices
- Places stop loss at optimal location (lower of 2 lows)
- Projects 3 profit targets based on risk
- Auto-removes when trade is complete/invalidated
### 5. No Repainting
- All signals appear AFTER bar closes
- No future data leaking
- What you see in backtest = what you get in real-time
---
## 🚨 Alerts
Built-in alerts notify you when:
- Bullish signal confirmed
- Bearish signal confirmed
Alerts fire once per bar (no spam) and only after bar closes (no false alerts).
---
## 📊 Best Practices
### ✅ DO:
- Trade in direction of higher timeframe trends
- Wait for full confirmation (all 5 conditions met)
- Use proper position sizing (1-2% risk per trade)
- Let winners run to at least 2R
### ❌ DON'T:
- Trade against major trend on MTF box
- Enter before signal bar closes
- Ignore the Stop Loss level
- Overtrade - respect the 4-bar minimum spacing
---
## 🔍 Limitations
This indicator is a **tool**, not a crystal ball:
- No indicator wins 100% of the time
- False signals occur in choppy/ranging markets
- Best results in trending conditions
- Requires proper risk management
- Should be combined with fundamental analysis and market context
---
## 📚 Educational Value
This script teaches:
- How to combine trend following with mean reversion
- Pattern recognition and validation
- Risk-reward ratio calculation
- Multi-timeframe analysis
- Proper trade entry timing
---
## 🎓 Credits & Disclaimer
**Original Work**: All code written from scratch
**Methodology**: Based on classical technical analysis principles (EMA crossovers, candlestick patterns, support/resistance)
**Disclaimer**: This indicator is for educational purposes. Past performance does not guarantee future results. Always practice proper risk management.
---
## 📞 Support
If you find this indicator helpful:
- Leave a review
- Share with fellow traders
- Provide feedback for improvements
**Note**: This is a closed-source script to protect the proprietary signal logic and filtering algorithms. The description above provides comprehensive understanding of the methodology without revealing exact implementation details.
---
**Version**: 1.0
**Pine Script Version**: 5
**Type**: Indicator (Overlay)
**Category**: Trend Following + Pattern Recognition
---
*Happy Trading! 🚀*
# 🇹🇭 คู่มือภาษาไทย / Thai Guide
# Trade Pull Back - คู่มือภาษาไทย
## 📊 ภาพรวม
**Trade Pull Back** เป็นระบบเทรด Pullback ที่ผสมผสานการเทรดตามเทรนด์กับการจับจังหวะเข้าออเดอร์ด้วย Candlestick Pattern พร้อมคำนวณ Risk-Reward อัตโนมัติ
---
## 🎯 หลักการทำงาน
### ทำไมระบบนี้ได้ผล?
แก้ปัญหา 2 ข้อหลักของเทรดเดอร์:
1. **เข้าเร็วเกินไป** - เข้าก่อน Pullback เสร็จ
2. **เข้าช้าเกินไป** - พลาดโมเมนตัมหลังกลับตัว
**วิธีแก้**: ใช้กระบวนการยืนยัน 3 ขั้นตอน
- **ขั้น 1**: ระบุเทรนด์ → **ขั้น 2**: ตรวจจับ Pullback → **ขั้น 3**: ยืนยันการกลับตัว
---
## 🔧 ส่วนประกอบหลัก
### 1. ระบบ EMA 3 เส้น
ต่างจาก EMA ทั่วไป ระบบนี้ใช้ 3 เส้นที่มีหน้าที่แยกกัน:
- **EMA Trend (50)** - กำหนดทิศทางเทรนด์หลัก
- **EMA High (20)** - แนวต้านไดนามิก (สำหรับ Buy)
- **EMA Low (20)** - แนวรับไดนามิก (สำหรับ Sell)
**ทำไมต้อง 3 เส้น?**
- 1 เส้น = แยกเทรนด์กับ Pullback ไม่ได้
- 2 เส้น = ไม่มีจุด Entry/Exit ชัดเจน
- 3 เส้น = สร้าง Channel ที่บอกทั้งเทรนด์และโซนเข้าออเดอร์
### 2. ตรวจจับ Pattern
ระบบตรวจจับ 2 Pattern หลัก:
**Engulfing (แท่งกลืน)**
- Bullish: แท่งเขียวกลืนแท่งแดงทั้งหมด
- Bearish: แท่งแดงกลืนแท่งเขียวทั้งหมด
**Pin Bar (แท่งหาง)**
- Bullish: หางล่างยาว 60%+ ของช่วงทั้งหมด
- Bearish: หางบนยาว 60%+ ของช่วงทั้งหมด
### 3. เงื่อนไขยืนยันสัญญาณ (5 ข้อ)
**สัญญาณ Buy:**
1. ✅ ราคาปิด > EMA Trend (เทรนด์ขาขึ้น)
2. ✅ EMA High และ Low เหนือ EMA Trend (โครงสร้างดี)
3. ✅ เกิด Bullish Engulfing หรือ Pin Bar
4. ✅ ราคาปิด > EMA High (ยืนยัน Breakout)
5. ✅ ตัวเลือก: มี Pullback มาแตะ EMA High
**สัญญาณ Sell:**
1. ✅ ราคาปิด < EMA Trend (เทรนด์ขาลง)
2. ✅ EMA High และ Low ใต้ EMA Trend (โครงสร้างดี)
3. ✅ เกิด Bearish Engulfing หรือ Pin Bar
4. ✅ ราคาปิด < EMA Low (ยืนยัน Breakdown)
5. ✅ ตัวเลือก: มี Pullback มาแตะ EMA Low
**ตัวกรองเพิ่มเติม:**
- ต้องมีแท่งติดกัน 1-5 แท่ง (กำหนดได้)
- ห่างสัญญาณก่อนหน้าอย่างน้อย 4 แท่ง
- สัญญาณปรากฏหลังแท่งปิดเท่านั้น (ไม่ Repaint)
---
## 💰 คำนวณ Risk-Reward อัตโนมัติ
เมื่อสัญญาณเกิด ระบบคำนวณให้อัตโนมัติ:
**Long Position:**
- Entry = High ของแท่งสัญญาณ
- Stop Loss = Low ที่ต่ำกว่าของ 2 แท่งล่าสุด
- Target = 1R, 2R, 3R
**Short Position:**
- Entry = Low ของแท่งสัญญาณ
- Stop Loss = High ที่สูงกว่าของ 2 แท่งล่าสุด
- Target = 1R, 2R, 3R
**ลบอัตโนมัติ:** เส้นหายเมื่อราคาชน SL หรือถึง 3R
---
## 📈 กล่องเทรนด์หลาย Timeframe
แสดงเทรนด์พร้อมกัน 7 Timeframe:
- M1, M5, M15, M30, H1, H4, D1
**สีแสดงผล:**
- 🟢 เขียว = Uptrend
- 🔴 แดง = Downtrend
- ⚪ เทา = ไม่มีเทรนด์
**ประโยชน์:** เทรดตาม Timeframe ใหญ่เพื่อเพิ่ม Win Rate
---
## 📋 วิธีใช้งาน (5 ขั้นตอน)
1. **ระบุเทรนด์** - เช็คราคาเทียบกับ EMA Trend และกล่อง MTF
2. **รอ Pullback** - เฝ้าราคา Pullback มาที่ EMA High/Low
3. **เช็ค Pattern** - มองหาลูกศรสามเหลี่ยม (Engulfing) หรือเพชร (Pin Bar)
4. **เข้าออเดอร์** - เข้าเมื่อสัญญาณปรากฏ ใช้ SL/TP ที่แสดง
5. **จัดการเทรด** - เส้นจะหายเองเมื่อชน SL หรือถึง 3R
---
## ⚙️ การตั้งค่าแนะนำ
**Scalping (M1-M5)**
- EMA Trend: 20-30
- EMA High/Low: 10-15
- Require Pullback: ปิด
**Day Trading (M15-H1)**
- EMA Trend: 50 (ค่าเริ่มต้น)
- EMA High/Low: 20 (ค่าเริ่มต้น)
- Require Pullback: เปิด
**Swing Trading (H4-D1)**
- EMA Trend: 100-200
- EMA High/Low: 50
- Require Pullback: เปิด
---
## ✅ จุดเด่นที่แตกต่าง
1. **เป็นระบบสมบูรณ์** - ไม่ใช่แค่รวม Indicator
2. **EMA 3 เส้นสร้าง Channel** - บอกทั้งเทรนด์และโซนเข้า
3. **ตรวจสอบคุณภาพ Pattern** - ไม่ใช่ทุก Pattern ที่ให้สัญญาณ
4. **คำนวณ RR อัตโนมัติ** - วาง SL/TP ให้เลย
5. **ไม่ Repaint** - สัญญาณปรากฏหลังแท่งปิดเท่านั้น
---
## 📊 ควรทำ / ไม่ควรทำ
### ✅ ควรทำ:
- เทรดตามเทรนด์ Timeframe ใหญ่
- รอยืนยันครบ 5 เงื่อนไข
- เสี่ยง 1-2% ต่อเทรด
- ปล่อยกำไรไปอย่างน้อย 2R
### ❌ ไม่ควรทำ:
- เทรดทวนเทรนด์ในกล่อง MTF
- เข้าก่อนแท่งปิด
- ละเลย Stop Loss
- เทรดบ่อยเกินไป
---
## 🔍 ข้อจำกัด
- ไม่มี Indicator ไหนชนะ 100%
- สัญญาณผิดพลาดเกิดในตลาด Sideways
- ผลดีสุดในตลาดที่มีเทรนด์ชัด
- ต้องใช้ Money Management
- ควรดูปัจจัยพื้นฐานประกอบ
---
## 🎓 คำเตือน
**Disclaimer**: อินดิเคเตอร์นี้สำหรับการศึกษา ผลในอดีตไม่รับประกันอนาคต ใช้ Risk Management ที่เหมาะสมเสมอ
---
**เวอร์ชั่น**: 1.0
**Pine Script**: v5
**ประเภท**: Indicator (Overlay)
*Happy Trading! 🚀*
## Screenshots
**Bearish Signals with Risk-Reward:**
! (drive.google.com)
**Bullish Signal with Risk-Reward:**
! (drive.google.com)
**Multi-Timeframe Trend Box:**
! (drive.google.com)
**Settings Panel:**
! (drive.google.com)

Advanced Trading System - [WOLONG X DBG]Advanced Multi-Timeframe Trading System
Overview
This technical analysis indicator combines multiple established methodologies to provide traders with market insights across various timeframes. The system integrates SuperTrend analysis, moving average clouds, MACD-based candle coloring, RSI analysis, and multi-timeframe trend detection to suggest potential entry and exit opportunities for both swing and day trading approaches.
Methodology
The indicator employs a multi-layered analytical approach based on established technical analysis principles:
Core Signal Generation
SuperTrend Engine: Utilizes adaptive SuperTrend calculations with customizable sensitivity (1-20) combined with SMA confirmation filters to identify potential trend changes and continuations
Braid Filter System: Implements moving average filtering using multiple MA types (McGinley Dynamic, EMA, DEMA, TEMA, Hull, Jurik, FRAMA) with percentage-based strength filtering to help reduce false signals
Multi-Timeframe Analysis: Analyzes trend conditions across 10 different timeframes (1-minute to Daily) using EMA-based trend detection for broader market context
Advanced Features
MACD Candle Coloring: Applies dynamic 4-level candle coloring system based on MACD histogram momentum and signal line relationships for visual trend strength assessment
RSI Analysis: Identifies potential reversal areas using RSI oversold/overbought conditions with SuperTrend confirmation
Take Profit Analysis: Features dual-mode TP detection using statistical slope analysis and Parabolic SAR integration for exit timing analysis
Key Components
Signal Types
Primary Signals: Green ▲ for potential long entries, Red ▼ for potential short entries with trend and SMA alignment
Reversal Signals: Small circular indicators for RSI-based counter-trend possibilities
Take Profit Markers: X-cross symbols indicating statistical TP analysis zones
Pullback Signals: Purple arrows for potential trend continuation entries using Parabolic SAR
Visual Elements
8-Layer MA Cloud: Customizable moving average cloud system with 3 color themes for trend visualization
Real-Time Dashboard: Multi-timeframe trend analysis table showing bullish/bearish status across all timeframes
Dynamic Candle Colors: 4-intensity MACD-based coloring system (ranging from light to strong trend colors)
Entry/SL/TP Labels: Automatic calculation and display of suggested entry points, stop losses, and multiple take profit levels
Usage Instructions
Basic Configuration
Sensitivity Setting: Start with default value 6
Increase (7-15) for more frequent signals in volatile markets
Decrease (3-5) for higher quality signals in trending markets
MA Filter Type: McGinley Dynamic recommended for smoother signals
Filter Strength: Set to 80% for balanced filtering, adjust based on market conditions
Signal Interpretation
Long Entry: Green ▲ suggests when price crosses above SuperTrend with bullish SMA alignment
Short Entry: Red ▼ suggests when price crosses below SuperTrend with bearish SMA alignment
Reversal Opportunities: Small circles indicate RSI-based counter-trend analysis
Take Profit Zones: X-crosses mark statistical TP areas based on slope analysis
Dashboard Analysis
Green Cells: Bullish trend detected on that timeframe
Red Cells: Bearish trend detected on that timeframe
Multi-Timeframe Confluence: Look for alignment across multiple timeframes for stronger signal confirmation
Risk Management Features
Automatic Calculations
ATR-Based Stop Loss: Dynamic stop loss calculation using ATR multiplier (default 1.9x)
Multiple Take Profit Levels: Three TP targets with 1:1, 1:2, and 1:3 risk-reward ratios
Position Sizing Guidance: Entry labels display suggested price levels for order placement
Confirmation Requirements
Trend Alignment: Requires SuperTrend and SMA confirmation before signal generation
Filter Validation: Braid filter must show sufficient strength before signals activate
Multi-Timeframe Context: Dashboard provides broader market context for decision making
Optimal Settings
Timeframe Recommendations
Scalping: 1M-5M charts with sensitivity 8-12
Day Trading: 15M-1H charts with sensitivity 6-8
Swing Trading: 4H-Daily charts with sensitivity 4-6
Market Conditions
Trending Markets: Reduce sensitivity, increase filter strength
Ranging Markets: Increase sensitivity, enable reversal signals
High Volatility: Adjust ATR risk factor to 2.0-2.5
Advanced Features
Customization Options
MA Cloud Periods: 8 customizable periods for cloud layers (default: 2,6,11,18,21,24,28,34)
Color Themes: Three professional color schemes plus transparent option
Dashboard Position: 9 positioning options with 4 size settings
Signal Filtering: Individual toggle controls for each signal type
Technical Specifications
Moving Average Types: 21 different MA calculations including advanced types (Jurik, FRAMA, VIDA, CMA)
Pullback Detection: Parabolic SAR with customizable start, increment, and maximum values
Statistical Analysis: Linear regression slope calculation for trend-based TP analysis
Important Limitations
Lagging Nature: Some signals may appear after potential entry points due to confirmation requirements
Ranging Markets: May produce false signals during extended sideways price action
High Volatility: Requires parameter adjustment during news events or unusual market conditions
Computational Load: Multiple timeframe analysis may impact performance on slower devices
No Guarantee: All signals are suggestions based on technical analysis and may be incorrect
Educational Disclaimers
This indicator is designed for educational and analytical purposes only. It represents a technical analysis tool based on mathematical calculations of historical price data and should not be considered as financial advice or trading recommendations.
Risk Warning: Trading involves substantial risk of loss and is not suitable for all investors. Past performance of any trading system or methodology is not necessarily indicative of future results. The high degree of leverage can work against you as well as for you.
Important Notes:
Always conduct your own analysis before making trading decisions
Use appropriate position sizing and risk management strategies
Never risk more than you can afford to lose
Consider your investment objectives, experience level, and risk tolerance
Seek advice from qualified financial professionals when needed
Performance Disclaimer: Backtesting results do not guarantee future performance. Market conditions change constantly, and what worked in the past may not work in the future. Always paper trade new strategies before risking real capital.

Anrazzi - EMAs/ATR - 1.0.2The Anrazzi – EMAs/ATR indicator is a multi-purpose overlay designed to help traders track trend direction and market volatility in a single clean tool.
It plots up to six customizable moving averages (MAs) and an Average True Range (ATR) value directly on your chart, allowing you to quickly identify market bias, dynamic support/resistance, and volatility levels without switching indicators.
This script is ideal for traders who want a simple, configurable, and efficient way to combine trend-following signals with volatility-based position sizing.
📌 Key Features
Six Moving Averages (MA1 → MA6)
Toggle each MA on/off individually
Choose between EMA or SMA for each
Customize length and color
Perfect for spotting trend direction and pullback zones
ATR Display
Uses Wilder’s ATR formula (ta.rma(ta.tr(true), 14))
Can be calculated on current or higher timeframe
Adjustable multiplier for position sizing (e.g., 1.5× ATR stops)
Displays cleanly in the bottom-right corner
Custom Watermark
Displays symbol + timeframe in top-right
Adjustable color and size for streamers, screenshots, or clear charting
Compact UI
Organized with group and inline inputs for quick configuration
Lightweight and optimized for real-time performance
⚙️ How It Works
MAs: The script uses either ta.ema() or ta.sma() to compute each moving average based on the user-selected type and length.
ATR: The ATR is calculated using ta.rma(ta.tr(true), 14) (Wilder’s smoothing), and optionally scaled by a multiplier for easier use in risk management.
Tables: ATR value and watermark are displayed using table.new() so they stay anchored to the screen regardless of zoom level.
📈 How to Use
Enable the MAs you want to track and adjust their lengths, type, and colors.
Enable ATR if you want to see volatility — optionally select a higher timeframe for broader context.
Use MAs to:
Identify overall trend direction (e.g. price above MA20 = bullish)
Spot pullback zones for entries
See when multiple MAs cluster together as support/resistance zones
Use ATR value to:
Size your stop-loss dynamically (e.g. stop = entry − 1.5×ATR)
Detect volatility breakouts (ATR spikes = market expansion)
🎯 Recommended For
Day traders & swing traders
Trend-following & momentum strategies
Volatility-based risk management
Traders who want a clean, all-in-one dashboard

Pullback Screener Pro [LevelUp]Pullbacks are often considered high-probability entry points within trending markets. This screener helps streamline the search for such opportunities using trend analysis through customizable moving averages, price action and volatility filters with ATR (Average True Range).
🔹 Why Trade Pullbacks
Pullbacks represent temporary counter-moves within a broader trend. Instead of chasing extended moves, traders can enter at more favorable price levels.
Pros
▪ Improved Entry Prices : Entering closer to support or resistance levels often provides a better risk/reward ratio.
▪ Trend Alignment : Pullbacks occur within established trends, allowing traders to participate in potential continuation moves.
▪ Defined Risk Levels : Key moving averages and recent swing points can be used to set stop-loss orders.
Cons
▪ Not all pullbacks resume the trend; some signal reversals.
▪ Price can temporarily overshoot levels, creating whipsaws.
▪ Pullback strategies work best in trending markets and may underperform in sideways conditions.
🔹 Custom Feature : Require Lower Low
The optional requirement for a lower low may help confirm that an actual pullback is occurring, rather than just sideways chop or continuation strength.
Stricter Definition of a Pullback
▪ A pullback implies some retracement against the prevailing trend.
▪ By requiring a lower low, you ensure price is genuinely pulling back, not just consolidating at the highs.
Avoids False Triggers
▪ Without this filter, you might catch stocks that simply paused for a bar (small doji, tiny inside candle) but haven’t really pulled back.
▪ The lower low condition filters for bars where sellers actually pushed price down.
Improves Entry Timing
▪ Many traders want to enter as pullbacks are maturing, not while price is still pushing higher.
▪ A lower low shows some weakness that may soon transition into support, giving a cleaner “buy-the-dip” opportunity.
Psychological Confirmation
▪ From a trader psychology standpoint, a lower low indicates that at least some holders are taking profits and that short-term participants are testing the trend.
▪ This is often the moment when strong hands step in if the trend is healthy.
🔹 Custom Feature : Specify Closing Range
Closing range % is another optional feature that can be very useful when scanning for pullbacks as it helps separate healthy retracements from weak price action.
Shows Buyer Support Within the Bar
▪ Closing near the top of the day’s range (e.g., above 60–70%) signals that even though price pulled back intraday, buyers stepped in and pushed it higher by the close.
▪ That strength is a good sign the pullback may be stabilizing.
Filters Out Weak Pullbacks
▪ If a stock closes near the low of the day, sellers are still in control — the “dip” might not be done.
▪ By requiring a higher Closing Range, you filter out setups that may keep falling.
Timing Advantage
▪ Many traders prefer entering when a pullback shows early signs of turning.
▪ A strong closing range is an objective way to catch that transition, often right before the next leg higher.
Psychological Read
▪ Closing strength suggests demand is stepping back in — traders and investors still want exposure to the trend.
▪ It reflects confidence, whereas weak closes show hesitation or distribution.
🔹 Custom Feature : ATR % Filter
Specifying an ATR (Average True Range) filter is helpful when scanning for stocks because it normalizes volatility relative to price, enabling traders to identify stocks with suitable price movement for their strategy while managing volatility by filtering out excessively erratic stocks (high ATR %) or those with insufficient movement (low ATR %), thus aligning with risk tolerance and optimizing position sizing and stop-loss placement.
Focus on Stocks With Tradable Volatility
▪ ATR measures how much a stock typically moves in a day.
▪ By setting a minimum ATR, you avoid slow, low-volatility stocks that don’t move enough to create good opportunities.
Filters Out “Too Wild” Stocks
▪ Extremely high ATR stocks can be erratic, difficult to size properly, and risky to trade.
▪ By specifying a maximum ATR (or ATR % relative to price), you can avoid setups where risk is too unpredictable.
Normalizes Price Differences
▪ A $20 stock and a $200 stock can’t be compared just on raw dollar moves.
▪ ATR (or ATR as a % of price) gives a volatility-adjusted way to compare them, so your screen is consistent across all price levels.
Improves Entry & Stop Placement
▪ Knowing that a stock typically moves, say, 2% daily versus 0.5% daily helps you set realistic stops and targets.
▪ Screening for stocks with ATR in your preferred range means trades will line up better with your risk/reward model.
Psychology
▪ ATR captures behavior. Stocks with healthy, steady volatility attract active traders because they offer movement without chaos.
▪ Too quiet = boring, too wild = stressful. ATR filters help you stay in the sweet spot.
🔹 Customization Options
With extensive customization options, traders can fine-tune pullback scans by adjusting moving averages, proximity to those averages, bar structure, closing range strength, and volatility filters. This flexibility supports different trading styles, timeframes, and risk preferences.
Configurable Moving Averages
Scanning is optimized for daily and weekly timeframes.
▪ Select up to three moving average lengths and types (e.g. 20 EMA, 50 SMA, 200 SMA) for daily and weekly timeframes.
▪ Tailor scans to different trading styles:
• Short-term traders may prefer faster averages (e.g. 10–20 EMA).
• Swing traders often use medium-term averages (e.g. 50 SMA).
• Long-term investors may focus on slower averages (e.g. 200 SMA).
Pullback Within X % of Moving Average
▪ Specify the total range of a pullback using % above and % below a moving average. The bar low is used for this comparison.
▪ For example, .5% above and .5% below a moving average, giving price a total range of 1%. If the low is outside the range, it's not considered a valid pullback.
Require Low Lower
▪ Optional setting to require that the current bar to be a lower low compared to the prior bar.
▪ See above section for more information.
Closing Range %
▪ Specify a closing range to help you spot pullbacks where buyers are reasserting control.
▪ Define how close the closing price is to the daily high or low.
▪ See above section for more information.
ATR % Filter
▪ Incorporates volatility by measuring price movement relative to Average True Range (ATR).
▪ Options include:
• Above a specified ATR %
• Below a specified ATR %
• Within a specified ATR range
This options enables filtering for setups that align with volatility preferences and risk tolerance.
🔹 Trader Psychology
Pullback trading requires both patience and discipline. Understanding the psychology behind it can improve decision-making:
▪ Patience Over FOMO: Traders must resist the urge to chase extended moves. Waiting for a pullback often leads to better entries.
▪ Confidence in the Trend : Entering during a pullback can feel counterintuitive, as price is moving against the trend in the short term. Trusting the larger trend is essential.
▪ Managing Doubt: False pullbacks and whipsaws can create frustration. Keeping risk small and consistent helps maintain emotional balance.
▪ Discipline in Risk Control: Stops should be respected. Moving or ignoring stop-loss levels during a pullback can turn a small loss into a large one.
Successful pullback traders focus on process over outcome , knowing that consistency across many trades matters more than the result of any single trade.
🔹 True Market Leader Pullbacks
▪ GEV: Pullback to 10-EMA and 21-EMA
▪ NVDA: Pullback to 50-SMA
🔹 Best Practices
▪ Trend First : Pullbacks are most effective when traded in the direction of the larger trend. Confirm trend strength before acting on screener results.
▪ Combine Filters : Use moving average, closing range, and ATR filters together for higher-quality setups.
▪ Chart Review : Always verify results visually before trading.
▪ Risk Management : Consider swing lows (uptrends) or highs (downtrends) to define stop-loss placement.
🔹 Summary
The Pullback Screener helps traders quickly locate potential opportunities where price retraces toward key moving averages within an ongoing trend. With customizable filters for moving averages, closing range, and ATR, the screener adapts to a wide range of strategies and risk profiles.
Pullback trading offers favorable entries and defined risk, but success requires patience, discipline, and confirmation of trend conditions.
Script de pago

EdgeFlow Pullback [CHE]EdgeFlow Pullback \ — Icon & Visual Guide (Deep Dive)
TL;DR (1-minute read)
⏳ Hourglass = Pending verdict. A countdown runs from the signal bar until your Evaluation Window ends.
✔ Checkmark (green) = OK. After the evaluation window, price (HLC3) is on the correct side of the EMA144 for that signal’s direction.
✖ Cross (red) = Fail. After the evaluation window, price (HLC3) is on the wrong side of the EMA144.
▲ / ▼ Triangles = the actual PB Long/Short signal bar (sequence completed in time).
Small lime/red crosses = visual markers when HLC3 crosses EMA144 (context, not trade signals).
Orange line = EMA144 (baseline/trend filter).
T3 line color = Context signal: green when T3 is below HLC3, red when T3 is above HLC3.
Icon Glossary (What each symbol means)
1) ⏳ Hourglass — “Pending / Countdown”
Appears immediately when a PB signal fires (Long or Short).
Shows `⏳ currentBars / EvaluationBars` (e.g., `⏳ 7/30`).
The label stays anchored at the signal bar and its original price level (it does not drift with price).
During ⏳ you get no verdict yet. It’s simply the waiting period before grading.
2) ✔ Checkmark (green) — “Condition met”
Appears after the Evaluation Window completes.
Logic:
Long signal: HLC3 (typical price) is above EMA144 → ✔
Short signal: HLC3 is below EMA144 → ✔
The label turns green and text says “✔ … Condition met”.
This is rules-based grading, not PnL. It tells you if the post-signal structure behaved as expected.
3) ✖ Cross (red) — “Condition failed”
Appears after the Evaluation Window completes if the condition above is not met.
Label turns red with “✖ … Condition failed”.
Again: rules-based verdict, not a guarantee of profit or loss.
4) ▲ “PB Long” triangle (below bar)
Marks the exact bar where the 4-step Long sequence completed within the allowed window.
That bar is your signal bar for Long setups.
5) ▼ “PB Short” triangle (above bar, red)
Same as above, for Short setups.
6) Lime/Red “+” crosses (tiny cross markers)
Lime cross (below bar): HLC3 crosses above EMA144 (crossover).
Red cross (above bar): HLC3 crosses below EMA144 (crossunder).
These crosses are context markers; they’re not entry signals by themselves.
The Two Clocks (Don’t mix them up)
There are two different time windows at play:
1. Signal Window — “Max bars for full sequence”
A pullback signal (Long or Short) only fires if the 4-step sequence completes within this many bars.
If it takes too long: reset (no signal, no triangle, no label).
Purpose: avoid stale setups.
2. Evaluation Window — “Evaluation window after signal (bars)”
Starts after the signal bar. The label shows an ⏳ countdown.
When it reaches the set number of bars, the indicator checks whether HLC3 is on the correct side of EMA144 for the signal direction.
Then it stamps the signal with ✔ (OK) or ✖ (Fail).
Timeline sketch (Long example):
```
→ ▲ PB Long at bar t0
Label shows: ⏳ 0/EvalBars
t0+1, t0+2, ... t0+EvalBars-1 → still ⏳
At t0+EvalBars → Check HLC3 vs EMA144
Result → ✔ (green) or ✖ (red)
(Label remains anchored at t0 / signal price)
```
What Triggers the PB Signal (so you know why triangles appear)
LONG sequence (4 steps in order):
1. T3 falling (the pullback begins)
2. HLC3 crosses under EMA144
3. T3 rising (pullback ends)
4. HLC3 crosses over EMA144 → PB Long triangle
SHORT sequence (mirror):
1. T3 rising
2. HLC3 crosses over EMA144
3. T3 falling
4. HLC3 crosses under EMA144 → PB Short triangle
If steps 1→4 don’t complete in time (within Max bars for full sequence), the sequence is abandoned (no signal).
Lines & Colors (quick interpretation)
EMA144 (orange): your baseline trend filter.
T3 (green/red):
Green when T3 < HLC3 (price above the smoothed path; often supportive in up-moves)
Red when T3 > HLC3 (price below the smoothed path; often pressure in down-moves)
HLC3 (gray): the typical price the logic uses ( (H+L+C)/3 ).
Label Behavior (anchoring & cleanup)
Each signal creates one label at the signal bar with ⏳.
The label is position-locked: it stays at the same bar index and y-price it was born at.
After the evaluation check, the label text and color update to ✔/✖, but position stays fixed.
The indicator keeps only the last N labels (your “Show only the last N labels” input). Older ones are deleted to reduce clutter.
What You Can (and Can’t) Infer from ✔ / ✖
✔ OK: Structure behaved as intended during the evaluation window (HLC3 finished on the correct side of EMA144).
Inference: The pullback continued in the expected direction post-signal.
✖ Fail: Structure ended up opposite the expectation.
Inference: The pullback did not continue cleanly (chop, reversal, or insufficient follow-through).
> Important: ✔/✖ is not profit or loss. It’s an objective rule check. Use it to identify market regimes where your entries perform best.
Input Settings — How they change the visuals
T3 length:
Shorter → faster turns, more signals (and more noise).
Longer → smoother turns, fewer but cleaner sequences.
T3 volume factor (0–1, default 0.7):
Higher → more curvature/smoothing.
Typical sweet spot: 0.5–0.9.
EMA length (baseline) default 144:
Smaller → faster baseline, more cross events, more aggressive signals.
Larger → slower, stricter trend confirmation.
Max bars for full sequence (signal window):
Smaller → only fresh, snappy pullbacks can signal.
Larger → allows slower pullbacks to complete.
Evaluation window (after signal):
Smaller → verdict arrives quickly (less tolerance).
Larger → gives the trade more time to prove itself structurally.
Show only the last N labels:
Controls chart clutter. Increase for more history, decrease for focus.
(FYI: The “Debug” toggle exists but doesn’t draw extra overlays in this version.)
Practical Reading Flow (how to use visuals in seconds)
1. Triangles catch your eye: ▲ for Long, ▼ for Short. That’s the setup completion.
2. ⏳ label starts—don’t judge yet; let the evaluation run.
3. Watch EMA slope and T3 color for context (trend + pressure).
4. After the window: ✔/✖ stamps the outcome. Log what the market was like when you got ✔.
Common “Why did…?” Questions
Q: Why did I get no triangle even though T3 turned and EMA crossed?
A: The 4 steps must happen in order and within the Signal Window. If timing breaks, the sequence resets.
Q: Why did my label stay ⏳ for so long?
A: That’s by design until the Evaluation Window completes. The verdict only happens at the end of that window.
Q: Why is ✔/✖ different from my PnL?
A: It’s a structure check, not a profit check. It doesn’t know your entries/exits/stops.
Q: Do the small lime/red crosses mean buy/sell?
A: No. They’re context markers for HLC3↔EMA crosses, useful inside the sequence but not standalone signals.
Pro Tips (turn visuals into decisions)
Entry: Use the ▲/▼ triangle as your trigger, in trend direction (check EMA slope/market structure).
Stop: Behind the pullback swing around the signal bar.
Exit: Structure levels, R-multiples, or a reverse HLC3↔EMA cross as a trailing logic.
Tuning:
Intraday/volatile: shorter T3/EMA + tighter Signal Window.
Swing/slow: default 144 EMA + moderate windows.
Learn quickly: Filter your chart to show only ✔ or only ✖ windows in your notes; see which sessions, assets, and volatility regimes suit the system.
Disclaimer
No indicator guarantees profits. Sweep2Trade Pro \ is a decision aid; always combine with solid risk management and your own judgment. Backtest, forward test, and size responsibly.
The content provided, including all code and materials, is strictly for educational and informational purposes only. It is not intended as, and should not be interpreted as, financial advice, a recommendation to buy or sell any financial instrument, or an offer of any financial product or service. All strategies, tools, and examples discussed are provided for illustrative purposes to demonstrate coding techniques and the functionality of Pine Script within a trading context.
Any results from strategies or tools provided are hypothetical, and past performance is not indicative of future results. Trading and investing involve high risk, including the potential loss of principal, and may not be suitable for all individuals. Before making any trading decisions, please consult with a qualified financial professional to understand the risks involved.
By using this script, you acknowledge and agree that any trading decisions are made solely at your discretion and risk.
Enhance your trading precision and confidence 🚀
Happy trading
Chervolino

Script_Algo - Fibo Correction Strategy🔹 Core Concept
The strategy is built on combining Fibonacci retracement levels, candlestick pattern confirmation, and trend filtering for trade selection. It performs well on the 1-hour timeframe across many cryptocurrency pairs. Particularly on LINKUSDT over the past year and a half, despite the not very optimal 1:1 risk/reward ratio.
The logic is simple: after a strong impulse move, the price often retraces to key Fibonacci levels (specifically, the 61.8% level). If a confirming candlestick (pattern) appears at this moment, the strategy looks for an entry in the direction of the main trend.
🔹 Indicators Used in the Strategy
ATR (Average True Range) — Used to calculate the stop-loss and take-profit levels.
EMA (9 and 21) — Additional moving averages for assessing the direction of movement (not directly used in entry conditions, but the logic can be expanded to include them).
SMA (Trend Filter, 20 by default) — The trend direction filter. Trades are only opened in its direction.
Fibonacci Levels — The 61.8% retracement level is calculated based on the high and low of the previous candle.
🔹 Entry Conditions
🟢 Long (Buy):
Previous Candle:
Must be green (close higher than open).
Must have a body not smaller than a specified minimum.
The upper wick must not exceed 30% of the body size.
→ This filters out "weak" or "indecisive" candles.
Current Candle:
Price touches or breaches the Fibonacci 61.8% retracement level from the previous range.
Closes above this level.
Closes above the Trend Filter (SMA) line.
A position is opened only if there are no other open trades at the moment.
🔴 Short (Sell):
Previous Candle:
Must be red (close lower than open).
Must have a body not smaller than a specified minimum.
The lower wick must not exceed 30% of the body size.
Current Candle:
Price touches or breaches the Fibonacci 61.8% retracement level from the previous range.
Closes below this level.
Closes below the Trend Filter (SMA) line.
A trade is opened only if there are no other open positions.
🔹 Risk Management
Stop-Loss = ATR × multiplier (default is 5).
Take-Profit = ATR × the same multiplier.
Thus, the default risk/reward ratio is 1:1, but it can be easily adjusted by changing the coefficient. Although, strangely enough, this ratio has shown the best results on some assets on the 1-hour timeframe.
🔹 Chart Visualization
Fibonacci level for Long — Green line with circles.
Fibonacci level for Short — Red line with circles.
Trend Filter line (SMA) — Blue.
🔹 Strengths of the Strategy
✅ Utilizes a proven market pattern — retracement to the 61.8% level.
✅ Further filters entries using trend and candlestick patterns.
✅ Simple, transparent logic that is easy to expand (e.g., adding other Fib levels, an EMA filter, etc.).
🔹 Limitations
⚠️ Performs better in trending markets; can generate false signals during ranging (sideways) conditions.
⚠️ The fixed 1:1 risk/reward ratio is not always optimal and could be refined.
⚠️ Performance depends on the selected timeframe and ATR parameters.
📌 Summary:
The strategy seeks corrective entries in the direction of the trend, confirmed by candlestick patterns. It is versatile and can be applied to forex pairs, cryptocurrencies, and stocks.
⚠️ Not financial advice. Pay close attention to risk management to avoid blowing your account. The strategy is not repainting — I have personally verified it through real testing — but it may not necessarily replicate the same results in the future, as the market is constantly changing. Test it, profit, and good luck to everyone!

Golden Ratio Trend Persistence [EWT]Golden Ratio Trend Persistence
~~~~~~~~~~~~~~~~~~~~~~~~~~~~~~~~~~~~~~~~~~~~
Overview
The Golden Ratio Trend Persistence is a dynamic tool designed to identify the strength and persistence of market trends. It operates on a simple yet powerful premise: a trend is likely to continue as long as it doesn't retrace beyond the key Fibonacci golden ratio of 61.8%.
This indicator automatically identifies the most significant swing high or low and plots a single, dynamic line representing the 61.8% retracement level of the current move. This line acts as a "line in the sand" for the prevailing trend. The background color also changes to provide an immediate visual cue of the current market direction.
~~~~~~~~~~~~~~~~~~~~~~~~~~~~~~~~~~~~~~~~~~~~
The Power of the Golden Ratio (61.8%)
The golden ratio (ϕ≈1.618) and its inverse (0.618, or 61.8%) are fundamental mathematical constants that appear throughout nature, art, and science, often representing harmony and structure. In financial markets, this ratio is a cornerstone of Fibonacci analysis and is considered one of the most critical levels for price retracements.
Market movements are not linear; they progress in waves of impulse and correction. The 61.8% level often acts as the ultimate point of support or resistance. A trend that can hold this level demonstrates underlying strength and is likely to persist. A breach of this level, however, suggests a fundamental shift in market sentiment and a potential reversal.
~~~~~~~~~~~~~~~~~~~~~~~~~~~~~~~~~~~~~~~~~~~~
How to Use This Indicator
This indicator is designed for clarity and ease of use.
Identifying the Trend : The visual cues make the current trend instantly recognizable.
A teal line with a teal background signifies a bullish trend. The line acts as dynamic support.
A maroon line with a maroon background signifies a bearish trend. The line acts as dynamic resistance.
Confirming Trend Persistence : As long as the price respects the plotted level, the trend is considered intact.
In an uptrend, prices should remain above the teal line. The indicator will automatically adjust its anchor to new, higher lows, causing the support line to trail the price.
In a downtrend, prices should remain below the maroon line.
Spotting Trend Reversals : The primary signal is a trend reversal, which occurs when the price closes decisively beyond the plotted level.
Potential Sell Signal : When the price closes below the teal support line, it indicates that buying pressure has failed, and the uptrend is likely over.
Potential Buy Signal : When the price closes above the maroon resistance line, it indicates that selling pressure has subsided, and a new uptrend may be starting.
Think of this tool as an intelligent, adaptive trailing stop that is based on market structure and the time-tested principles of Fibonacci analysis.
~~~~~~~~~~~~~~~~~~~~~~~~~~~~~~~~~~~~~~~~~~~~
Input Parameters
You can customize the indicator's sensitivity through the following inputs in the settings menu:
Pivot Lookback Left : This number defines how many bars to the left of a candle must be lower (for a pivot high) or higher (for a pivot low) to identify a potential swing point. A higher value will result in fewer, but more significant, pivots being detected.
Pivot Lookback Right : This defines the number of bars that must close to the right before a swing point is confirmed. This parameter prevents the indicator from repainting. A higher value increases confirmation strength but also adds a slight lag.
Fibonacci Ratio : While the default is the golden ratio (0.618), you can adjust this to other key Fibonacci levels, such as 0.5 (50%) or 0.382 (38.2%), to test for different levels of trend persistence.
Adjusting these parameters allows you to fine-tune the indicator for different assets, timeframes, and trading styles, from short-term scalping to long-term trend following.