PT LiquidityVersion 1.0 of our Liquidity indicator helps determine areas where price might gravitate to fill liquidations. We have six levels of interest, broken down into three levels for shorts (highlighted in red) & three levels for longs (highlighted in green). Each level is labeled 25x, 50x, 100x. We added a cloud for a visual to assist in short/long liquidation zones. You want to be taking short setups at the top of the cloud when shorts get squeezed & taking long setups at the bottom of the cloud when longs get squeezed. The indicator has a proprietary formula that allows the levels to change based on volume and time frames. The levels are generated in real-time with a rolling VWMA.
Strategy:
If you are scalping, price tends to ping pong between the 50x & 100x longs (green) to 50x & 100x shorts (red). If we shift outside that zone, consider the trend to have changed. Look at a higher time frame (12h+) for trend direction. Price usually reverses when the daily takes all three liquidation levels. You want to see a strong reaction (wick) once we tap that last liquidation level.
This Oscillator was built around our buy sell indicator & it is used on all time frames for swinging & scalping. It is included as part of the library. Just message us for access!
Puntos pivote

Hancock - POC VAThis indicator shows POC (Point of Control) and VA (Value Area) High and Low as well as the developing ranges. This indicator makes use of the new arrays which means the resolution for calculating POC and VA is up to 100k bins at, in most cases, tick resolution and allows for custom time-frames.
Not much else needs to be said about this indicator.
Happy Trading
Hancock

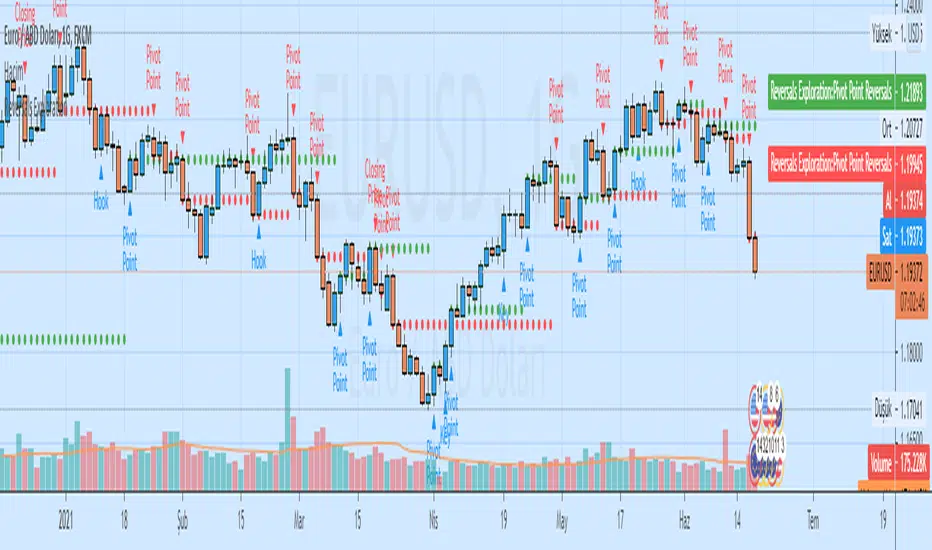
Auto Analysis Short-term Reversals ExplorationAuto Analysis Short-term Reversals Exploration
Based on a study by Larry Lovrencic
Closing Price Reversals Automatic Analysis
Hook Reversals Automatic Analysis
Island Reversals Automatic Analysis
Key Reversals Automatic Analysis
Open/Close Reversals Automatic Analysis
Pivot Point Reversals Automatic Analysis
Combo Backtest 123 Reversal & Floor Pivot Points This is combo strategies for get a cumulative signal.
First strategy
This System was created from the Book "How I Tripled My Money In The
Futures Market" by Ulf Jensen, Page 183. This is reverse type of strategies.
The strategy buys at market, if close price is higher than the previous close
during 2 days and the meaning of 9-days Stochastic Slow Oscillator is lower than 50.
The strategy sells at market, if close price is lower than the previous close price
during 2 days and the meaning of 9-days Stochastic Fast Oscillator is higher than 50.
Second strategy
The name ‘Floor-Trader Pivot,’ came from the fact that Pivot points can
be calculated quickly, on the fly using price data from the previous day
as an input. Although time-frames of less than a day can be used, Pivots are
commonly plotted on the Daily Chart; using price data from the previous day’s
trading activity.
WARNING:
- For purpose educate only
- This script to change bars colors.

Hancock - Pivot RangeShows central pivot point and developing central pivot point and colors both pivot ranges based on pivot criteria without using security function calls.
Green - Indicates up trend
Red - Indicates down trend
Orange - Indicates pivot point territory
Happy trading
Hancock

Combo Strategy 123 Reversal & Floor Pivot Points This is combo strategies for get a cumulative signal.
First strategy
This System was created from the Book "How I Tripled My Money In The
Futures Market" by Ulf Jensen, Page 183. This is reverse type of strategies.
The strategy buys at market, if close price is higher than the previous close
during 2 days and the meaning of 9-days Stochastic Slow Oscillator is lower than 50.
The strategy sells at market, if close price is lower than the previous close price
during 2 days and the meaning of 9-days Stochastic Fast Oscillator is higher than 50.
Second strategy
The name ‘Floor-Trader Pivot,’ came from the fact that Pivot points can
be calculated quickly, on the fly using price data from the previous day
as an input. Although time-frames of less than a day can be used, Pivots are
commonly plotted on the Daily Chart; using price data from the previous day’s
trading activity.
WARNING:
- For purpose educate only
- This script to change bars colors.

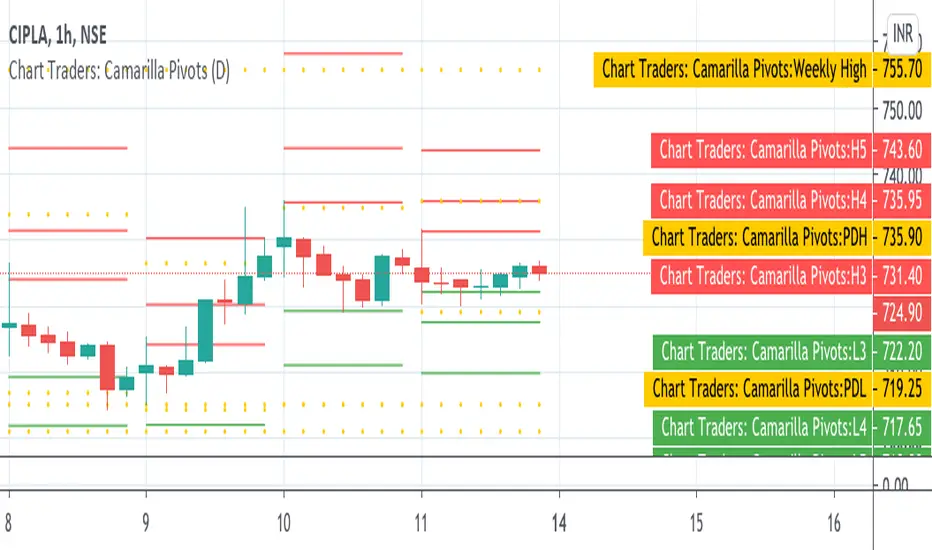
Chart Traders: Camarilla PivotsChart Traders: Camarilla Pivot point indicator gives you support and resistance level.
This indicator give (h1 to H5) five resistance level and (L1 to L5) support level. You can buy at any support level with reversal sign and sell at resistance with reversal sign.
In this indicator you can also see the next day Camarilla pivot points.
Support Resistance - Dynamic v2Hello Traders!
After the addition of "Arrays" to the Pine, I developed new and improved version of Support Resistance - Dynamic script as version 2. In this script Arrays were used. This can be used as Support Resistance tool, also it will be an example for the people who want to learn Array usage in Pine. Many thanks to Pine Team for adding Arrays!
The script finds the Pivot Points and check them in channels if there can be S/R or not, and draws mid line of the channel as S/R line. you can set number of PPs and channel width in the options. Each channel width is optimized dynamically according to Pivot Points. Also you can choose " High/Low " or " Close/Open " as source for Pivot Points.
There is an option for maximum number of S/R levels. S/R levels are found and sorted dynamically and number of S/R lines with enough strength changes dynamically.
Some other options for coloring and line width. (Solid, Dashed or Dotted)
S/R levels are shown in the Labels and Label colors are changed automatically, if S/R line is below the closing price then it's color is Green (as Support), otherwise its color is Red (as Resistance).
Examples:
Enjoy!

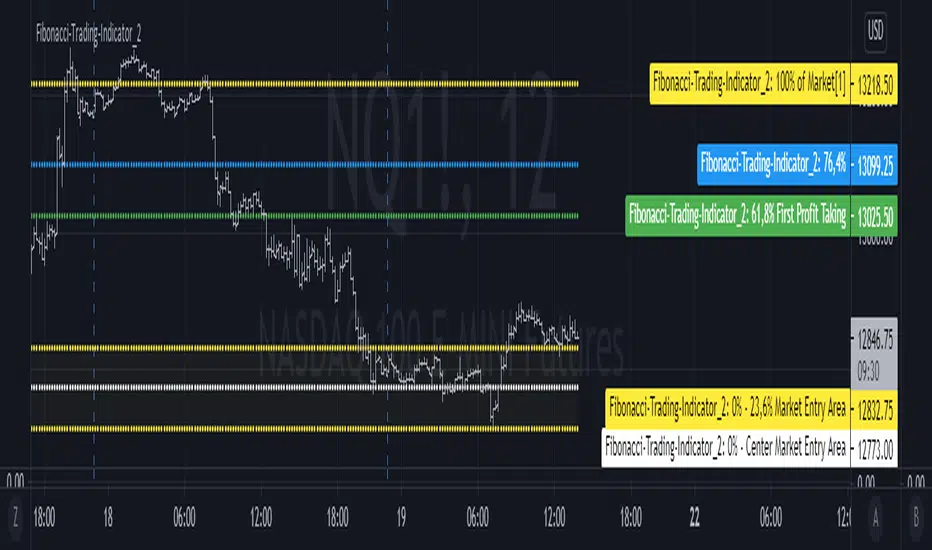
Fibonacci-Trading-Indicator_2 (Code-Änderung)Tägliche Gewinne mit dem Fibonacci-Trading Indikator
Die Notierungen bewegen sich in liquiden Märkten in Fibonacci-Verhältnissen. Mit diesem Indikator erhalten Sie für Tagesgeschäfte und für Positionstrades auf Basis einer Woche oder eines Monats Informationen, wo Sie in den Markt einsteigen sollten und was das mindeste erreichbare Kursziel ist. Dieses Kursziel liegt bei 61,8% der gestrigen Handelspanne, der Handelspanne der Vorwoche oder der Handelspanne des Vormonats. Dort realisieren Sie Ihre Gewinne.
Erforderliche Eingaben im Eigenschaftenfenster des Indikators:
• Vorwahl Aufwärtstrend/ Abwärtstrend.
• Zeitrahmen des Kursbalkens für das zu ermittelnde mögliche Hoch/ Tief.
• Handelspanne der vorherigen Periode.
• Aktuell tiefstes Tief des vorgewählten Zeitrahmens, wenn die Notierungen steigen.
• Aktuell höchstes Hoch des vorgewählten Zeitrahmens, wenn die Notierungen fallen.
Für die Erkennung der Bewegungsrichtung kann der Camelback-Indikator eine gute Hilfe sein.
Ausgaben im Chart sind die möglichen Kurslevels, für das mögliche Hoch oder Tief des Kursbalkens im eingestellten Zeitrahmen des Trading-Indikators.
Wichtige Bereiche für das Trading sind folgende Kurslevels:
• Einstiegsbereich 0% - 14,6% oder 0% - 23,6%
• Kursziellevel 61,8%
Kaufen/ verkaufen Sie innerhalb des Einstiegsbereichs zwischen 0% und 23,6%, während der Markt die Bewegungsrichtung vorgibt und sich in Richtung des long-/ oder short-Einstiegspunktes bewegt. Das sind jeweils die Kurslevels bei 14,6% oder 23,6%. Der 61,8%-Kurslevel ist das mindeste erwartbare Kursziel. Wir gehen davon aus, dass der aktuelle Kursbalken mindestens 61,8% der Handelsspanne, der vorherigen Periode erreichen wird. Realisieren Sie deshalb die angelaufenen Gewinne mit 50% der Position, wenn die Notierungen den 61,8% - Level erreicht haben. Mit einem geeigneten Trailing-Stopp lassen Sie sich mit der restlichen Position ausstoppen, riskieren Sie dafür aber nicht mehr als 50 % der angelaufenen Gewinne.
Wählen Sie einen kleinen Zeitrahmen, wenn sich die Notierungen noch im Einstiegsbereich bewegen, um die Richtung des Kursbalkens zu erkennen. Für Positionstrades auf Wochen- oder Monatssicht wird für den Einstieg der Einstiegsbereich 0% - bis 14,6% gewählt. Für Tagesgeschäfte (Zeitrahmen Tag vorgewählt) wird wegen der geringeren Tageshandelspanne der Einstiegsbereich 0% - 23,6% empfohlen.
Mit der Vorwahl Jahr und den entsprechenden Eingaben kann auch das mindeste erwartbare Jahreshoch/ Jahrestief ermittelt werden.
Die Fibonacci-Kurslevels lassen sich ein- und ausblenden. Klicken Sie im Chart auf das Zahnrad für „Chart Einstellungen“. Im Menü „Skalierungen“ kann mit der Vorwahl „Label für Indikatornahmen“ und „Label für letzten Indikatorwert“ die Kurslevels angezeigt werden. Schieben Sie den Chart nach rechts um Unterstützungen und Widerstände an den Kurslevels zu finden.
Bei Eingabefehlern oder fehlenden Eingaben zu einem Zeitrahmen wird der Indikator ausgeblendet.
Achten Sie zur Vermeidung von Verlusten auf ihr Handelsmanagement.
Daily profits with the Fibonacci trading indicator
The quotes move in Fibonacci ratios in liquid markets. With this indicator you receive information for daily trades and position trades based on a week or a month, where you should enter the market and what is the minimum price target that you can achieve. This price target is 61.8% of yesterday's trading range, the trading range of the previous week or the trading range of the previous month.
There you realize your profits.Required entries in the properties window of the indicator:
• Preselection uptrend / downtrend.
• Time frame of the price bar for the possible high / low to be determined.
• previous period trading range.
• Current lowest low of the selected time frame when prices rise.
• Current highest high in the selected time frame when prices fall.
The camelback indicator can be of great help in recognizing the direction of movement.
Outputs in the chart are the possible price levels for the possible high or low of the price bar in the set time frame of the trading indicator.
The following price levels are important areas for trading:
• Entry range 0% - 14.6% or 0% - 23.6%
• Target price level 61.8%
Buy / sell within the entry range between 0% and 23.6% as the market sets the direction of movement and moves towards the long / or short entry point. These are the price levels at 14.6% or 23.6%. The 61.8% price level is the minimum expected price target. We assume that the current bar will reach at least 61.8% of the trading range of the previous period. You should therefore realize the profits you have made with 50% of the position when the prices have reached the 61.8% level. With a suitable trailing stop you can be stopped with the rest of the position, but do not risk more than 50% of the profits.
Choose a small time frame when the quotes are still moving in the entry area to see the direction of the price bar. For position trades on a weekly or monthly perspective, the entry range 0% - to 14.6% is chosen. For day-to-day trades (pre-selected time frame), the entry range 0% - 23.6% is recommended due to the lower daily trading range.With the preselection year and the corresponding entries, the minimum expected annual high / annual low can also be determined.
The Fibonacci price levels can be shown and hidden. In the chart click on the gear wheel for “Chart Settings”. In the “Scaling” menu, the price levels can be displayed with the preselection “Label for indicator names” and “Label for last indicator value”. Slide the chart to the right to find support and resistance at the price levels.
In the event of input errors or missing entries for a time frame, the indicator is hidden.
Pay attention to your trade management to avoid losses.
Derivative Pivot HL Points Hello.
This script aims to take into account mutable variable Pivot Points' periods.
While doing this, it takes the period between 2 signals that I use in the script:
And these periods in my Pivot HL function integrated into len length (Mutable variables) :
The cornerstone of the script is these facts.
Pivot can be optimized by playing with reversal periods.
These pre-formed levels can be used as Supply and Demand levels.
Regards.

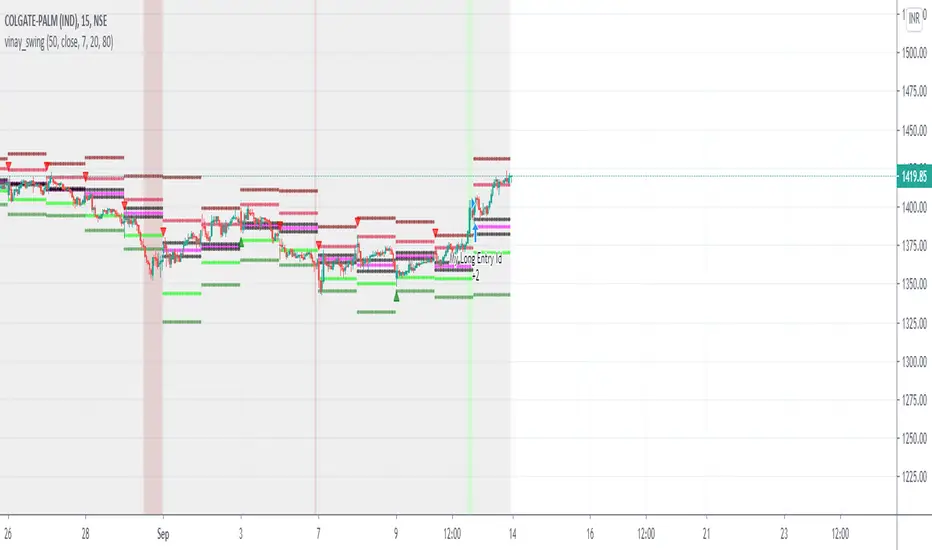
swing tradeTHIS strategy is based on the
franklin ochao swing trade book
confirmed bullish - when ever stock closed above R2 (more bullish)
when ever stock closed between R1 AND R2 (moderatly bullish or consolidation phase with respect to previous trend)
entry1 for more bullish trend is buy at every dips means when ever price low below pivot when it open above the pivot
entry2 for more bullish trend is buy at low is below s1
keep strictly stoploss at s1 of previous day (r2 close day)
trend reversal is possible once stock close below s1 in 1hr time frame
virgin cpr or missed pivot is added a advantage
For bearish mode this vice verse
Automatic Fibonacci Retracements [MS]Automatic Fibonacci Retracement Level indicator for any time frame, any asset.
Simple to use, just add to your chart and set the size of retracements you want to see.
Fib levels keep drawing in real time until the next low or high is found to start drawing the next fib.
Settings Include
• Fib size
• Show prices
• Draw low-to-high or high-to-low
• Toggle fib levels
Use the link below or PM us to obtain access to this indicator.

Double Top Double Bottom [MS]Automatic Double Top and Double Bottom pattern scanner for any time frame, any asset.
Simple to use, just add to your chart, and set the size (in the settings) for the patterns you want to find.
• Green patterns are bullish
• Red patterns are bearish
• Alerts are available for when new patterns are displayed
• When a pattern completes (at the neckline), it will change from dotted lines to solid lines.
To scan for multiple sizes of patterns, add the script to your chart multiple times.
Use the link below or PM us to obtain access to this indicator.

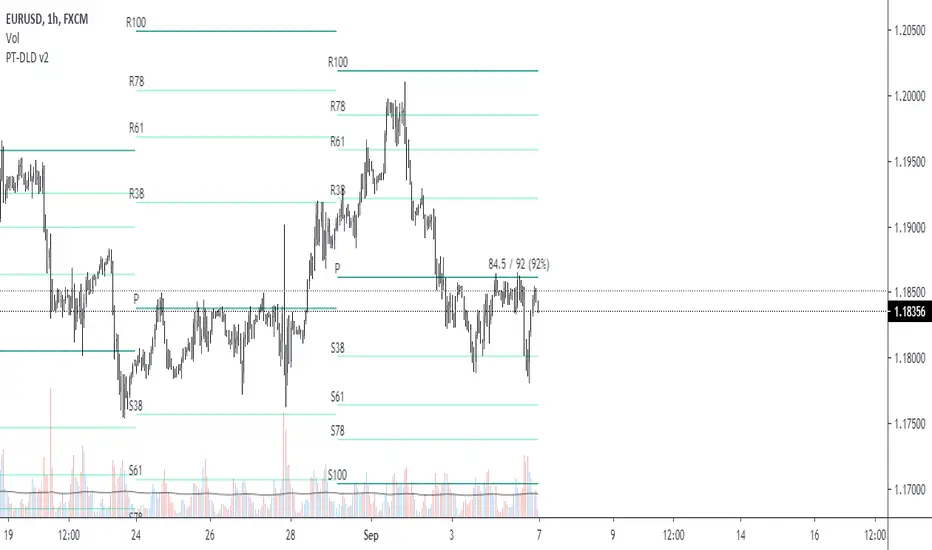
Pivot Fibonacci TradingWe use fibonacci in many things, why not the Pivot? Hey, it does works, price does reacts to the fibonacci off the pivot.
Pivots are road map for the price, fibonacci are just some stops or gas stations appear on the road, with these additional lines, there's more time for price to think about which way it'd move, therefore, more time for us traders to track and follow.
I know they usually use Daily pivot in H1, Weekly in H4 and Monthly in Daily timeframe, but since there are more lines now, price now needs space to travel between line. I recommend using Weekly Pivot for intraday(H1,...), Monthly for H4 and Yearly for Daily.
I also add some text that shows current day's range in pips (High - Low = range) and compare it to Average Daily Range. I thinks this is helpful if you use it for day trading.
I'll let this as a open sources as you may find something to customize in your own way.
Hope this helps you in someway, community :)
Happy trading!
#Thanks to @Davit on forexfactory for the idea
Trend Following with Moving AveragesHello Traders,
With the info "Trend is Your Friend ", you should not take position against the trend. This script checks multipte moving averages if they are above/below the closing price and try to find trend. The moving averages with the length 8, 13, 21, 34, 55, 89, 144, 233, 377 used. these are fibonacci numbers, but optionally you can change the lengths of each moving averages. while it's green you better take long positions, while it's red you better take short positions according to other indcators or tools.
Optionally you have "smoothing" option to get rid of whipsaws. it's enabled by default.
You have option to use following moving average types: EMA, SMA, RMA, WMA, VWMA. by default it's EMA
Also the script has "Resolution" option. with this option you can get the trend for other time frames, in following example 1h was set as for higher time frame on 15m chart:
This should not be used as buy/sell signal indicators as it's tries to find trend but not entry points, you should use other indicators (such RSI, Momentum) or other tools to find buy/sell signals.
Enjoy!

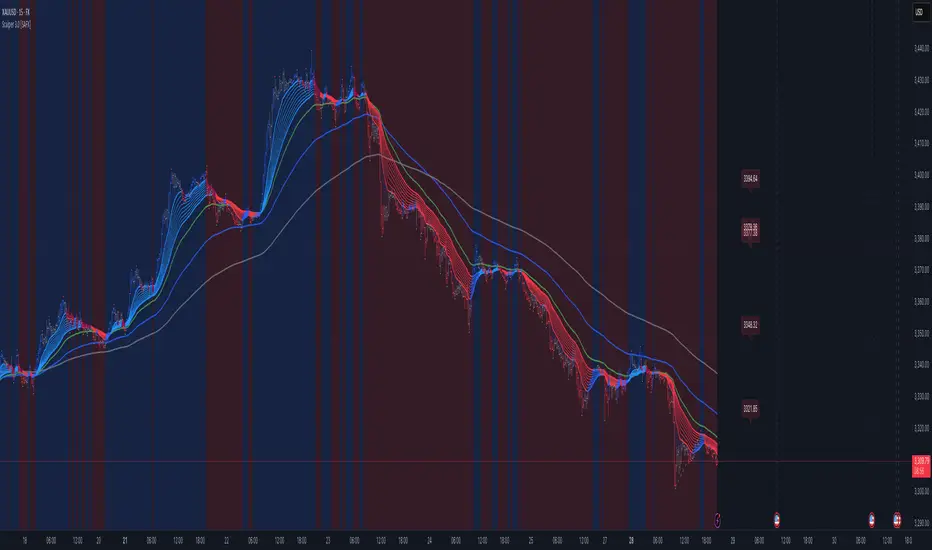
Scalper [SystemAlpha]This is a scalping tool designed for a two pane chart layout.
Includes:
- EMAs
- Price Action Channel
- Bar Color based on PAC, Impulse and TTM
- Pivot HL - Price, Shape, Text
- Pivot Extensions
- Dynamic Support Resistance
Reference:
- Scalping Swing Trading Tool R1-4 by JustUncle
- Support Resistance - Dynamic by LonesomeTheBlue