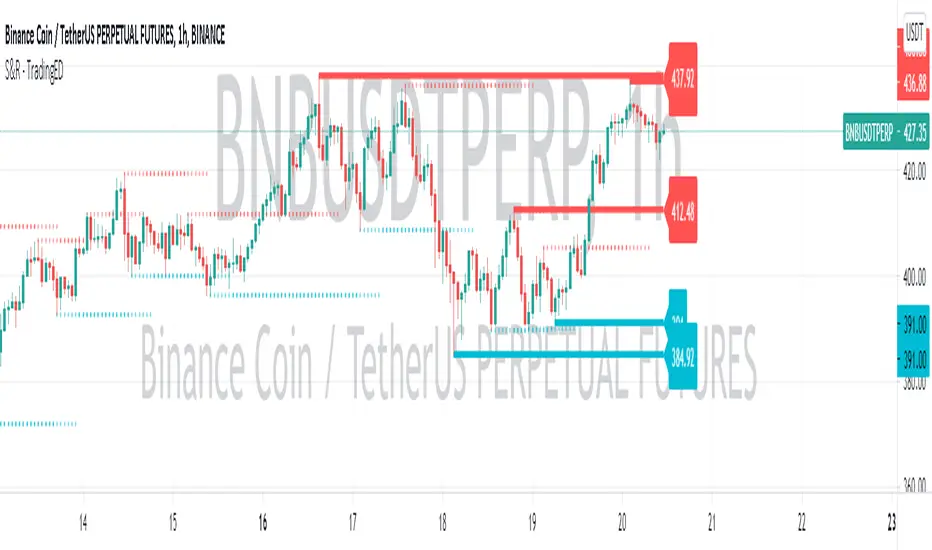
Support & Resistance - TradingEDThe use of this indicator is restricted to private use, and it can be used only by invitation. Different functionalities have been added, such as alerts and signals that seek to make trading much easier to interpret by any type of trading operator of any experience level, from beginner to intermediate and advanced.
This indicator will help you identify support and resistance levels over a previously determined range, whether from a count by candles , by minutes , hours or days . These support and resistance levels are calculated thanks to the highest and lowest points that will be painted along the chart, from the levels that you have previously selected .
You will even have a way to identify the most recent levels , thanks to the fact that they will be painted in a darker tone , as well as some price labels to quickly identify each of the levels on the chart . Identifying these levels sometimes seems like a pretty difficult task, but with this indicator you will discover that it will be much easier than you think to be able to master these levels.
As part of the analysis of chart patterns, traders use these price levels on charts that tend to act as barriers, preventing the price of an asset from being pushed in a certain direction. Support and resistance levels serve to identify the points where the price can favor certain probabilities for a stagnation or reversal of a prevailing trend.
Main functions of this indicator:
1) The MEASURE can be based on a CANDLES count if you are trading OHLC Charts from 1D onwards , or if your trading is intraday, you can also select counts by MINUTES , HOURS or DAYS , depending on your trading style.
2) LENGTH , by default it will be loaded as in the STRATEGY , but considering the previous point, you can modify it according to your convenience.
3) You have the option to hide or show the EXTENDED LEVELS the way to identify the most recent levels.
4) You have the option to hide or show a LABEL at the right of the chart, with respect to the price levels.
Main functions to customize the style of this indicator:
a) You can select the COLOR for Support and for Resistance, with the colors that best suit you.
b) In the case of the LABELS that appear at the right, the text, type of label and default color is not modifiable.
Pivot
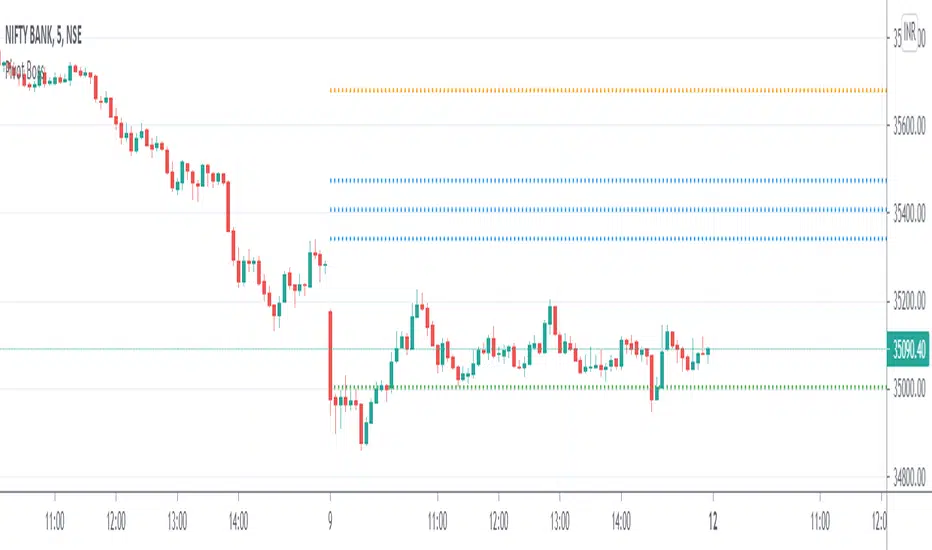
Pivot Boss - CPRThe Central Pivot Range (CPR) is used to identify key price points to set up trades. CPR is beneficial for intraday trading. This indicator can plot:
1. Daily Pivots and Daily Support/Resistance
2. Tomorrow Pivots and Support/Resistance
3. Weekly Pivots and Weekly Support/Resistance
4. Monthly Pivots and Monthly Support/Resistance
5. Previous Day High/Low
6. Previous Week and Month High/Low
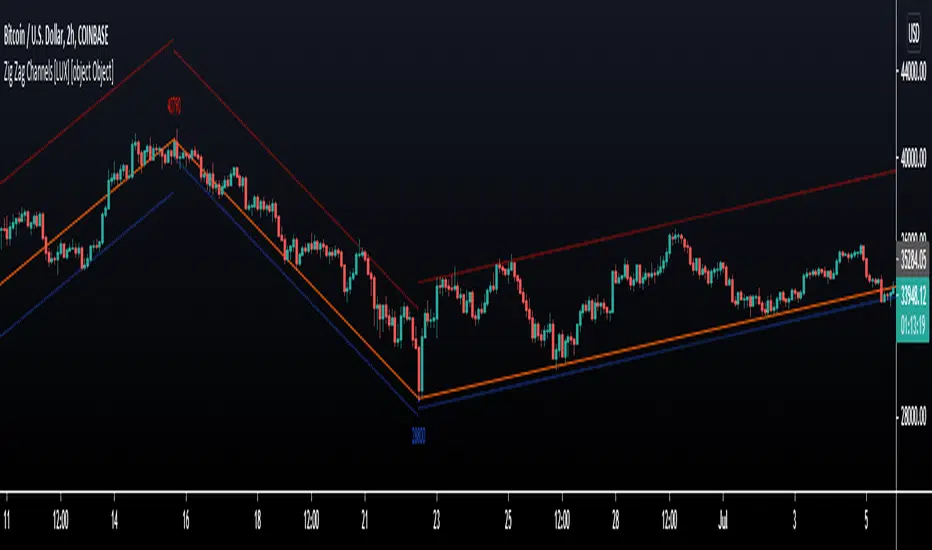
Zig Zag Channels [LuxAlgo]The Zig Zag indicator is a useful indicator when it comes to visualizing past underlying trends in the price and can make the process of using drawing tools easier. The indicator consists of a series of lines connecting points where the price deviates more than a specific percentage from a maximum/minimum point ultimately connecting local peaks and troughs.
This indicator by its very nature backpaints by default, meaning that the displayed components are offset in the past.
🔶 USAGE
The Zig Zag indicator is commonly used to returns points of references for the usage of specific drawing tools, such as Fibonacci retracements, fans, squares...etc.
The proposed indicator estimates peaks and troughs by using rolling maximums/minimums with a window size determining their significance. This window size approach allows us to have an indicator that works with a certain regularity no matter the scale of the price, something the percentage-based approach struggles with. Additionally, one upper and lower extremity are displayed, highlighting the price point that deviates the most from the Zig Zag lines.
A common usage also includes the easy determination of Elliot wave patterns in the price.
The Zig Zag indicator above highlights a downtrending motive wave.
🔹 Extremities
The novel approach taken by this Zig Zag indicator is the addition of two extremities derived from the distance between the price and the Zig Zag line, thus returning channels. It is uncommon seeing extremities in Zig Zag indicators since the line connecting peaks and troughs has rarely any other utility than seeing trend variations with more clarity and is not meant to provide an accurate estimate of underlying local trends in the price.
This channel can be useful to study the potential relationship between underlying trends and the Zig Zag line. A low width between the Zig Zag and the upper extremity indicates price variations mostly located below the Zig Zag while equal width indicates more linear trends.
When the indicator is extended to the last line, the extremities provide potential support and resistances, thus making this indicator able to forecast price variations.
🔶 SETTINGS
Length: Determines the significance of the detected peaks and troughs.
Extend To Last Bar: Extend the most recent line to the most recent closing price value.
Show Extremities: Displays the extremities.
Show Labels: Display labels highlighting the high/low prices located at peaks and troughs.
🔹 Style
Upper Extremity Color: Color of the upper extremity displayed by the indicator.
Zig Zag Color: Color of the ZigZag lines.
Lower Extremity Color: Color of the lower extremity displayed by the indicator.
Intraday Trading ZonesThis script can help in intraday trading. It can plot
1. Previous day high, low and close.
2. Intraday Fibonacci levels
3. Big Round Numbers
3. CPR (Central Pivot Range)
4. VWAP

GANN Square Of 9 PivotsGANN Square Of 9 Pivots
How to use for Intraday ?
Method 01 (From 9:05 am to 9:15 am or pre-open market)
Take the Weighted Average Price or Volume Weighted Average Price (VWAP) or Time Weighted Average Price (TWAP) of any stock or index.
You can use TWAP for Index as volume is not available.
Method 02 (From 9:05 am to 9:15 am or pre-open market)
Take the Last Traded Price (LTP) of index or stock
Method 03 (After 9:30 am or after 1st 15 min)
Only take Last Traded Price (LTP) of stock or index
Ideal Time
15min to 1hr after market opens
Indicator Features
Lines
Gray Dashed Line: Calculation Price
Teal Solid Line: Long Above
Red Solid Line: Short Below
3 Teal Dotted Lines: Bullish Targets 1, 2 & 3
3 Red Dotted Lines: Bearish Targets 1, 2 & 3
Labels
1st Numbers: Price
2nd Numbers in (): % change from LTP to that Level
For Index
As VWAP is not available for Index, TWAP (Time Weighted Average Price) values can be used for Index.
Custom Price Inputs
Price of your choice can be given manually by selecting:
Source > Custom
Enter Price > (type the price)
Timeframe
Higher timeframes like Weekly, Monthly can be changed using Timeframe Option
For More Reading
Reading: traderji.com/community/threads/intraday-trading-using-gann-calculator.39185/#post-419677
Calculator: stockmaniacs.net/freebies/free-tools/gann-square-of-9-calculator/

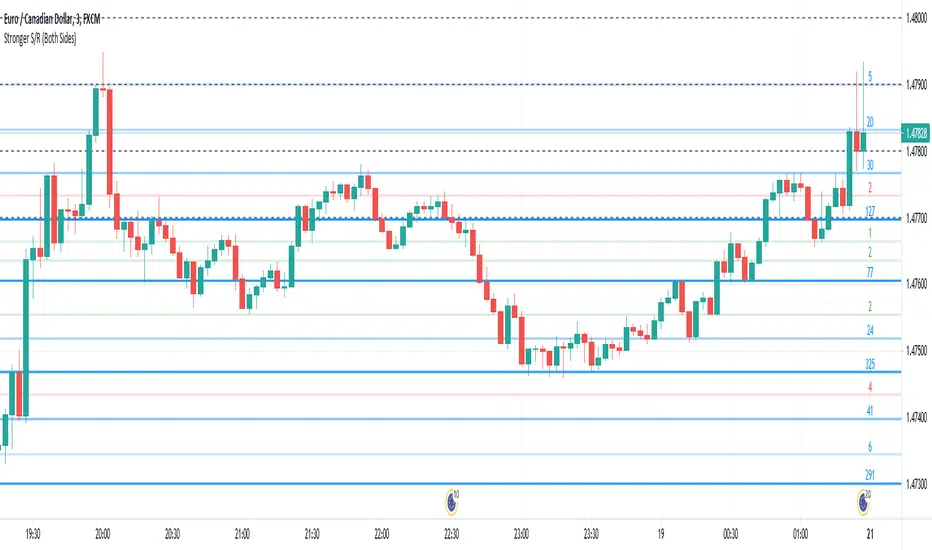
Stronger Classical Support/Resistance + Round LevelsI wrote some Support/Resistance scripts before this. In this new script, I implemented the logic of the code from the scratch, so it's very different from my previous S/R indicators and I think it's more advanced, accurate and efficient.
As the result it could do the followings for now:
- Draw more strong classical resistance/support levels by checking previous direction changes of the chart as far as Pine technically allows
- Colorize the levels based on the counted points of retracement/pullback (The darker the color is, the stronger the level is.)
- Show the number of reactions to each level
- Change the color of each level based on its main role as support, resistance or both
- Draw close round levels to current price for Forex pairs
I suggest all users of my previous S/R indicators to try this one.
Feel free to send me any issue or opinion!
Developing Pivot Range [Swastik]This is the developing cpr indicator made by Swastik.
It shows how the cpr is developing as the day is progressing.
The colour of the range is red when tc is below bc and green when tc is above bc .
While calculating the value of cpr , the high is the high from starting of the session and low is the low from starting of the session till that specific candle.
This also shows that the trend is developing.
If the colour is red and the range starts widening, it means downtrend has started to develop and
when the colour is green and range starts widening, it means uptrend is developing.

Zig Lines with Percent & ValueOverview, Features, and Usage:
The Zig Lines with Percent & Value is an indicator that highlights the highest and lowest points of the market from pivot points and zigzag lines based on the ZigZag Period setting. By a default value of 13 for the ZigZag Period this works well on Bitcoin or other alt coins on the 1 hour or higher timeframe charts.
What makes this indicator unique is that it draws a green line to signify an uptrend or a red line to signify a down trend. It will also show the percent difference between the previous point/line, for example: If you see a -negative percentage point with a red line drawn to it, then you are looking at a low pivot point and then as the green line is drawn to a +positive percentage value the percentage you see is the difference between the two points. This is great to see a trend reversal as you can look at previous pivot points and notice about how far the price moves before it changes direction (trend reversal).
There is an invisible EMA line that is used to assist with coloring the negative vs positive values. The value above or below the percentage is the lowest or highest price at that pivot point . The display of the price at the pivot point depends on your ZigZag Period setting and the timeframe of your chart.
Added Bollinger Bands as it fits perfectly with the visuals of the Zig Lines & Pivots.
Usage of Bollinger Bands:
~As the price or candle gets close to the top or bottom of the Bollinger band it can give you a better confirmation that the pivot location is at it's final place, and the trend is more likely to switch directions.
It’s important to know this indicator should not be used for alerts of any type it does repaint as the green or red line is drawing based on live chart data and it can change depending on the direction of the market. This is a great visual tool for trend analysis or to be used with other indicators as a confirmation for a possible good entry or exit position.
Credits ( and consent to use ):
Credits go to user LonesomeTheBlue for creation of this 'Double Zig Zag with HHLL' script.
The addition of the Value above/below the Percentages is from user Noldo and that script is found here:
The Bollinger Bands setup was suggested by user countseven12 and his script that uses the same BB setup is found here:
References:
1. Chen, James. (2021 March 15). Zig Zag Indicator . Received from http: www.investopedia.com
2. Mitchell, Cory. (2021 April 30). Pivot Points . Received from http: www.investopedia.com

Logging in Pine ScriptI'm building quite a lot of pretty complicated indicators/strategies in Pine Script. Quite often they don't work from the 1 try so I have to debug them heavily.
In Pine Script there are no fancy debuggers so you have to be creative. You can plot values on your screens, check them in the data window, etc.
If you want to display some textual information, you can plot some info as labels on the screen.
It's not the most convenient way, so with the appearance of tables in Pine Script, I decided to implement a custom logger that will allow me to track some useful information about my indicator over time.
Tables work much better for this kind of thing than labels. They're attached to your screen, you can nicely scale them and you can style them much better.
The idea behind it is very simple. I used few arrays to store the message, bar number, timestamp, and type of the message (you can color messages depend on the type for example).
There is a function log_msg that just append new messages to these arrays.
In the end, for the last bar, I create the table and display the last X messages in it.
In parameters, you can show/hide the entire journal, change the number of messages displayed and choose an offset. With offset, you can basically scroll through the history of messages.
Currently, I implemented 3 types of messages, and I color messages according to these types:
Message - gray
Warning - yellow
Error - red
Of course, it's a pretty simple example, you can create a much fancier way of styling your logs.
What do you think about it? Is it useful for you? What do you use to debug code in Pine Script?
Disclaimer
Please remember that past performance may not be indicative of future results.
Due to various factors, including changing market conditions, the strategy may no longer perform as good as in historical backtesting.
This post and the script don’t provide any financial advice.

Pivot Detective Indicator v1.0Overview of Features
The Pivot Detective is an indicator that simply highlights the waves of the market by identifying the pivot highs and pivot lows by using shapes and zigzag lines.
What makes this indicator unique is that you do not have to specify the number of bars to the left or right side of the pivots (aka pivot strength), nor do you need to specify percent deviation for filtering the zigzag (1)lines. Thus, the indicator will monitor price action and keep track of pivot high and low prices and implements a common trend analysis algorithm to determine when the trend has reversed to confirm the pivot price and begin tracking the next pivot price. The tolerance of the trend reversal can be configured to be strict or loose depending on your preference.
Be aware that this indicator does not determine key levels of price like support (S1, S2, etc.) and resistance (R1, R2, etc.) levels that are found in the traditional Pivot Points indicators (2).
Usage Information
The indicator can be applied to any chart at any time frame. It is very customizable where you can add or change various chart elements to help you enhance your interpretation of the price action trend reversals at the pivots. You can specify the pivot shapes, colors, and visibility as well as zigzag line thickness, color, and visibility. You can adorn the pivot shapes with any combination of price, rate of change percentage, and pivot trend using HH/LH/LL/HL text as well as control the coloring schemes for the in-progress pivot. The size of the text can also be customized.
Be aware that this indicator makes use of lines and labels which are limited to 500 lines and 500 labels, so if traverse far into the history, they will not appear because they have reached these limits and were removed by the chart's rendering engine.
Lastly, you can define "any alert() function call" messages on the "New Pivot High Point" and "New Point Low Point" events. These alerts provide custom placeholders that can be used in the messages, which are: {{exchange}}, {{ticker}}, {{currency}}, {{new_pivot_point_price}}, and {{new_pivot_point_roc}}
References
1. Chen, James. (2021 March 15). Zig Zag Indicator. Received from http: www.investopedia.com
2. Mitchell, Cory. (2021 April 30). Pivot Points. Received from http: www.investopedia.com

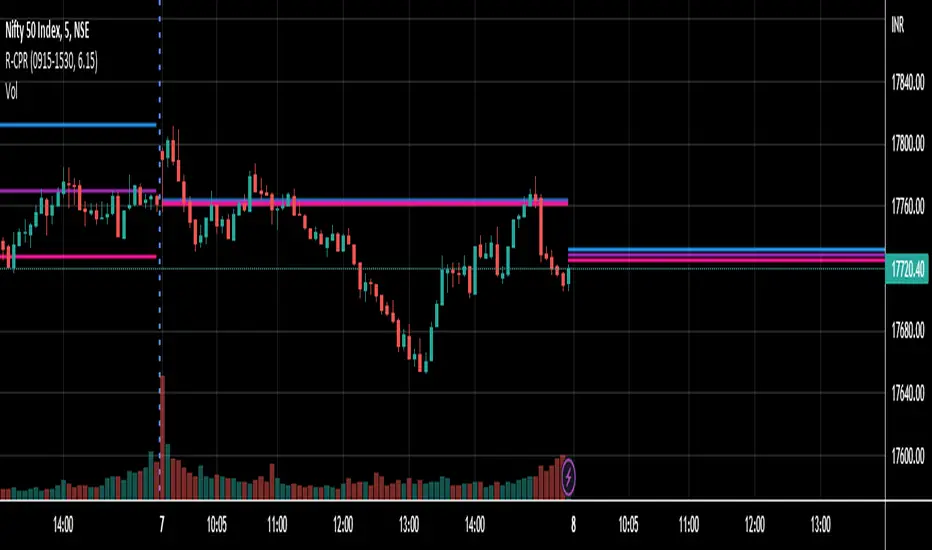
R-CPRThis is a simple CPR script that plots the following data,
Central Pivot,
Pivot,
Bottom Central Pivot.
Thanks.
TestedFX SR RADAR v3 (Support & Resistance Radar)TestedFX SR Radar is unlike any other Support and Resistance indicator I have seen to date. It doesn't just show you recent important pivots. Everyone with eyes can see those levels lol. You need an edge on the market. You need to know the levels AHEAD OF TIME. Trading is about having MORE and BETTER information than everyone else. Notice how the levels start BEFORE price touches those levels!!
How does TestedFX SR Radar do this?? Glad you asked.
Just like real radar, it searches within 5 ATR of the current price for strong pivots thousands of bars previous major pivots. But that is just the start. Then when a level is respected with a wick rejection a upvote is cast. When the level is busted a downvote is cast. The shading levels are based on the levels POWER as scored by the market voting on it. (Notice the purple dots at then end of the wicks that hit the level) Using this novel technique high probability pivot points are calculated IN ADVANCE so you know the important levels ahead of time.
Darker levels and multiple lines grouped together show strong S/R levels.
You can use this in combination with your favorite strategy. However, it was built to go with one of our private indicators. Typically good practice on TV is to include all functionality in one indicator. We tried to do that with this indicator but we couldn't because it uses too much CPU power. As it is if you change the SR Radar settings you will get "Script takes too long to execute" type errors. If that happens try hiding and showing the indicator again. If that doesn't work then reset your settings back to standard settings. The upside is that we are releasing this free to our tradingview friends.
I love this community and it is great to be able to give back. I really hope this helps you make better trading decisions. If so please let me know your experiences (good and bad) in the comments.
Sincerly,
Doug Collins
TestedFX

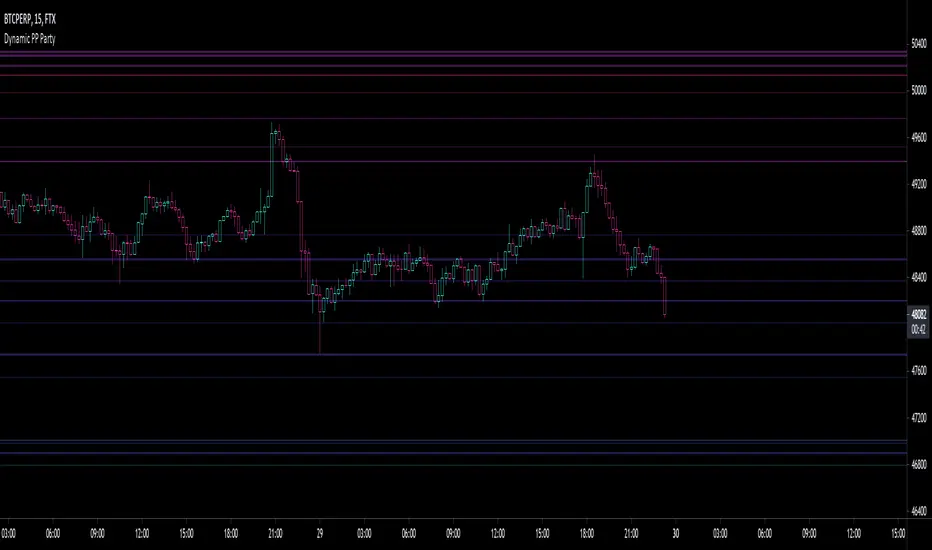
Fibonacci PP Party LTMulti-timeframe fibonacci pivot point analysis with 38.2%, 61.8% and 100% retracement levels.
Select and agglomerate different fib timeframes on your single timeframe chart fren .
The following scopes made available and stackable to your heart's desire (toggle on or off timeframes within settings):
1 Month
3 Week
2 Week
1 Week
5 Day
4 Day
3 Day
2 Day
1 Day
Go ahead, hit up that 1m & keep major support and resistance levels in plain view.
Rid your self of narrow scope , ya dope.
Warning: slow performance due to enormous heaps of timeframes hitting the dome.
Let me know where the errors are.
Make Money
Ya dummy
Second TimeFrame [TT]This Script Allows You to look for second Timeframe for the same Ticker or another ticker. Useful for those who cannot afford any pro versions of TV.
Anyway this doesn't let you use any indicators on it.. So you will be left with only 2 more indicators to use on the chart.
For Example : I have plotted NSE:Niftybank on upper pane and NSE:Nifty on lower pane

Combo Backtest 123 Reversal & Pivot Point V2 This is combo strategies for get a cumulative signal.
First strategy
This System was created from the Book "How I Tripled My Money In The
Futures Market" by Ulf Jensen, Page 183. This is reverse type of strategies.
The strategy buys at market, if close price is higher than the previous close
during 2 days and the meaning of 9-days Stochastic Slow Oscillator is lower than 50.
The strategy sells at market, if close price is lower than the previous close price
during 2 days and the meaning of 9-days Stochastic Fast Oscillator is higher than 50.
Second strategy
Pivot points simply took the high, low, and closing price from the previous period and
divided by 3 to find the pivot. From this pivot, traders would then base their
calculations for three support, and three resistance levels. The calculation for the most
basic flavor of pivot points, known as ‘floor-trader pivots’, along with their support and
resistance levels.
WARNING:
- For purpose educate only
- This script to change bars colors.

Combo Backtest 123 Reversal & Pivot Detector Oscillator Copyright by HPotter v1.0 20/04/2021
This is combo strategies for get a cumulative signal.
First strategy
This System was created from the Book "How I Tripled My Money In The
Futures Market" by Ulf Jensen, Page 183. This is reverse type of strategies.
The strategy buys at market, if close price is higher than the previous close
during 2 days and the meaning of 9-days Stochastic Slow Oscillator is lower than 50.
The strategy sells at market, if close price is lower than the previous close price
during 2 days and the meaning of 9-days Stochastic Fast Oscillator is higher than 50.
Second strategy
The Pivot Detector Oscillator, by Giorgos E. Siligardos
The related article is copyrighted material from Stocks & Commodities 2009 Sep
WARNING:
- For purpose educate only
- This script to change bars colors.
Pivot Points - Daily(with CPR)/Weekly/Monthly with two EMAsThis script plots all the Pivot points and Support/Resistance on your chart
You can chose Daily, Weekly or Monthly pivot.
Daily Pivot has CPR, 4 support levels and 4 resistance levels
Monthly and Weekly pivot has 3 supports and 3 resistance.
You will also get to plot two EMAs if you want.
Untick the checkbox of Primary EMA and Secondary EMA if you don't want to see EMAs(by default EMAs are disabled)
As this is a leading indicator, price reacts to these levels quite significantly.
You can use this indicator by 'Add to Favourite Indicators' option

Market PivotsMarket pivots take previous high, low, close to calculate pivot range.
* within yellow pivot range, expecting choppy. not a good location to entry a trade
* above yellow pivot range, expecting bullish.
* below yellow pivot range, expecting bearish.

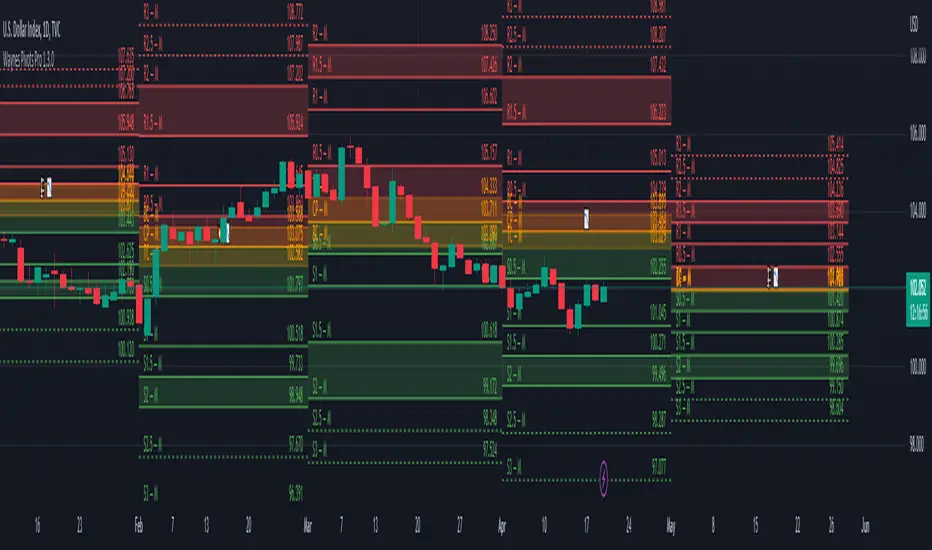
Wayne's Pivots ProThere is a public version of this indicator titled "Wayne's Pivots" if you would like to try out something similar to this indicator.
Wayne's Pivots Pro is named after Wayne McDonnel who came up with this indicator's pivot trading methodology. Wayne's Pivots are only one part of his methodology, but these pivots are the most critical part. They are frequently applied to supplement other trading methodologies as well. There are 3 key features that separate Wayne's Pivots specifically from every other pivot point indicator out there.
1. Midpoint Pivots
2. Biased Pivots
3. Next Period's Pivots
Understand that this indicator is supposed to be used, according to the methodology, alongside a fundamental bias. If you have not done fundamental research to know if you're a bull or bear on an asset, then you will likely not be using these pivots correctly. They do not tell you which direction the market will move. It tells you how far and how long a trade may go depending on which way you bias the pivots, and if your fundamental view was correct. This is trade planning tool for your entries and exits.
Breaking each point down:
1. Midpoint Pivots
If you take regular pivots (S#, R#), and get a histogram of every time price closed at or above each level, you generally end up with an even distribution. By adding midpoint levels you are doubling the amount of data, and increasing the resolution of the histogram. While these extra levels don't necessarily give us entries or exits, they do tell us when price doesn't quite reach a major support or resistance level. Midpoint pivot levels are calculated by finding the midpoint between each pivot level, and are labeled from the bottom up starting at M0 (Midpoint 0).
2. Biased Pivots
The traditional rules for trading pivot points are to buy support levels and sell resistance levels. In Wayne's methodology, we see pivots as a set for entries and take profits depending on our bias. It is known that trading the inverse of traditional pivot point rules that you can end up with a reasonable strategy. Biased pivots let us focus on only what matter to us by removing all other pivots, lines, and labels. Only showing us pivots useful to the bias we set.
For example, if you are a bull fundamentally you would set the bullish biased pivots. You would look for an entry in the area between the central pivot and second midpoint (M2), and an exit in the area between R2 and M4.
3. Next Period's Pivots
The third major feature of Wayne's Pivots are the "future" pivots. These are really calculated by taking the current HLC data and plotting it in realtime into the future before there's any data there. When we enter a new trading period, let say the day, we will have little data on the next day's pivots. As the current trading day goes on and gets closer to it's close, we start to see the next day's pivot points firm up. It's at this point that future pivots become actionable to create trading plans for the next day. The next period's pivots are exceptionally useful when scaled up to weekly, monthly, quarterly, and yearly timeframes. Daily, weekly, and monthly are the most commonly used within communities trading Wayne's methodology.
This is a completely rebuilt, professional use version of Wayne's Pivots. It includes many technical upgrades required by professional using Wayne's methodology. I released the original version publicly because it does not have many of the features here included in the Professional's version.
Features in Pro that are not in the public version:
Works on ALL timeframes.
Realtime pivot point updates.
Price levels on the pivots.
Extra pivots. (R3, M5, M0, S3)
All pivots start and end at the correct dates and times. (public version can't due to plot())
Easier to add more features!
Does this mean that you've abandoned the public version of Wayne's Pivots?
Absolutely not. Whenever there is a new feature in the Pro version, I always see if I can add it into the public one. It's just that the way it's built was not how I originally envisioned these pivots to be. If there's ever something that breaks the public version, I'm going to fix it because there's hundreds of people who use it.
I use the public version of Wayne's Pivots perfectly fine with my trading. Why switch to Pro?
Simply put, it's not going to give you the most accurate pivots that a professional would need. The pivots do not print properly on months with more or less than 30 days, and do their worst on short weeks. The public version has been like this ever since I first made it, and the only work around was to completely rebuild it. That's the major reason why I made the public version available to everyone in the first place. On top of all that, I can add way more features and customization options to these pivots than the public ones.
If I have a feature request will you try to implement it?
Absolutely! Some requests do have their limits, but don't be afraid to ask for something you really want. I'll try and implement lots of requested features as time goes on.
Trading Con Propositomy scrip intention is to make easier and simpler my analisis, having everything toghether helps me take desicions when to enter the market, the estrategy is based in moving averages, pivot points and structure, and the bollinger bands and the sthochastic are just another tool of confirmation when i'm goin to execute the trade.
the market for this strategy is more focused on futures and us stocks but it can be use in any other market. the way to use this strategy is simple, every time a candle goes thru a MA and pull's back to it is a sign of a possible trade, samething when it cuts thru a pivot point and the perfect condition is when the bollinger bands and the sthocasthic are in oversold and overbuy areas.

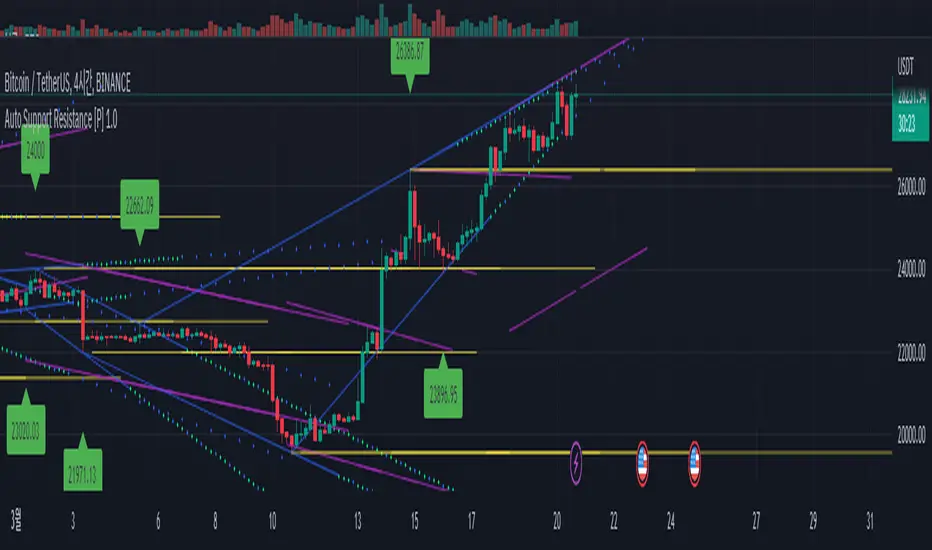
Auto Support Resistance [WS]This is paid version.
If you wanna use free version
This show support line, and resistance line.
moderately! and beautiful way!
also proper trend line .
you cannot see source code, but it doesnt have any secret formula.
It use just pivot function.
( i just wanna keep my design tech. )
it has 3 type line.
1. horizontal. yellow. default pivot size is 15
2. connection of top(peak, blue). pivot size 10
3. connection of bottom(green). pivot size 10
you can change pivot size.
it has one speical option about volume .
if the bottom has too small volume , it cannot be starting point.
if you want every bottom can be starting point, you can turn off the option.
each point has name like H6, G8.
this name help you to talk with someone about the point, sharing the infomation.
that name is base on the time of candle (it mean it is not randome). so in your friend chart(screen), the point has same name.
=========================================
한글 설명.
이 지표는 유료버전입니다.
무료버전은 위의 그림을 누르시면 됩니다.
아름답게 절제된, 그리고 적절한 추세선들을 자동으로 보여줍니다!!!
소스코드를 볼 수 없지만, 추세선을 결정하는 비밀 수식 같은 것은 없습니다.
오직 pivot피봇 함수만을 사용하여 고점과 저점을 찾고 있습니다.
선은 3가지가 있습니다.
1. 고점을 연결한 선. 파란색. 기본 피봇 10
2. 저점을 연결한 선. 녹색. 피봇 10
3. 고점 또는 저점의 수평선. 노란색. 피봇 15
특별한 기능이 하나 있는데, 볼륨이 낮은 저점은 녹색선의 시작점이 되지 못하게 하는 기능입니다.
이 기능은 옵션에서 끄거나, 정도를 조절할 수 있습니다.
각 고점 저점은 H4, G8 같은 이름을 가지고 있습니다.
이 이름은 여러분이 차트분석을 올리거나 친구와 차트에 대해 대화를 나눌 때 유용하게 쓰일 수 있습니다.
이 이름은 캔들의 시간값을 이용하며 (무작위로 지어진게 아니라는 의미), 그래서 친구의(모두의) 화면에서 같은 이름을 보여줍니다.
점선은 확장선이며, 기본은 30, 최대 55까지 늘릴 수 있습니다.
(너무 늘리면 화면이 복잡해집니다.)
가장 최근의 고점과 저점 수평선은 무한대의 길이를 가집니다.
그 외의 수평선은 적당한 길이로 조절되어 출력됩니다.
간혹 3개의 선으로 나뉘어 보이거나 투명도가 변하곤 하는데 이는 특별한 의미를 보이려는 것이 아닙니다. 트레이딩뷰 파인스크립트의 한계로 인한 현상입니다.
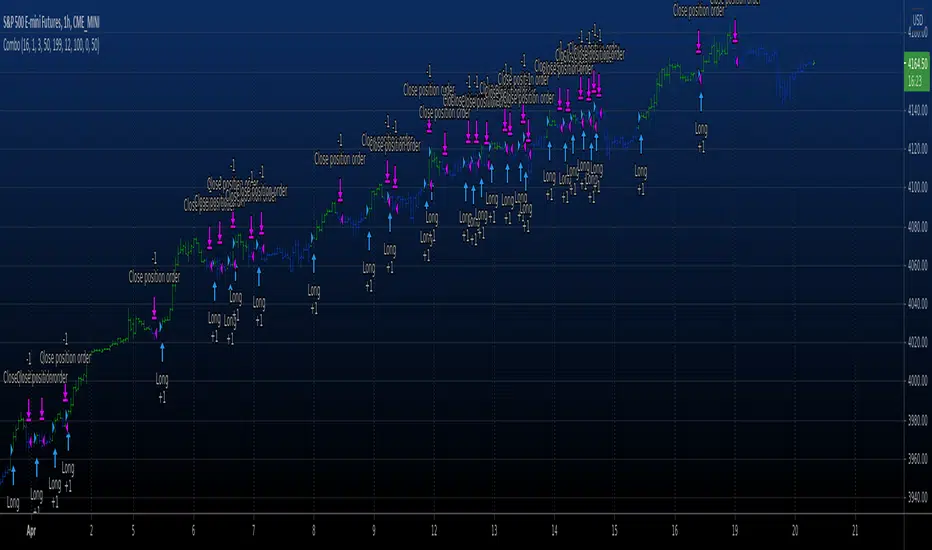
Pivot Points AlgoThis is a Pivot Points Algo (PPA).
PPA uses an adaptive pivot algorithm that adapts to different market situations based on various factors.
PPA also includes depth filtering to make it more precise at its signal decision.
======= Signal Types ======
Main Signal of BUY and SELL shown by buy/sell labels.
Mini Signals of BUY and SELL shown by buy/sell arrows and shows additional breakouts after the Main Signal occurred.
Optional reversal signals show a possible reversal in trend (small triangle).
======= Alerts =======
Main Signals alerts - Alerts when a main Buy or Sell is triggered (Shown as Labels).
Combo Alerts - Alerts when main or mini signals of Buy and Sell are triggered (Shown as Arrows).
======= Assets and Time frames =======
Can be used on various assets, stocks, forex, crypto and works great for day trading as well as swing trading and long term investing.
PPA is designed to adjust to any time frame!
======= General info =======
The purpose of this indicator is to signal possible breakouts with a high rate of success.
PPA has been extensively tested and fine tuned to provide traders and investors with a valuable tool for timing long and short entries. However, no system is 100% perfect, and it is good practice to have a plan in place and use stop losses or other tools to mitigate unforeseen risk.
Also, note, I don't hide what PPA is doing as opposed to some other commercial indicators on the market. You can view pivot lines and pivot bands and so on.
The magic is the inner system itself which works for you to pinpoint the best entrance possible, I recommend confirming your own methods to make sure you want to take the trade.
To subscribe to Pivot Points Algo service see “Author's instructions” below.
For any question you can PM me.
Happy and profitable trading!

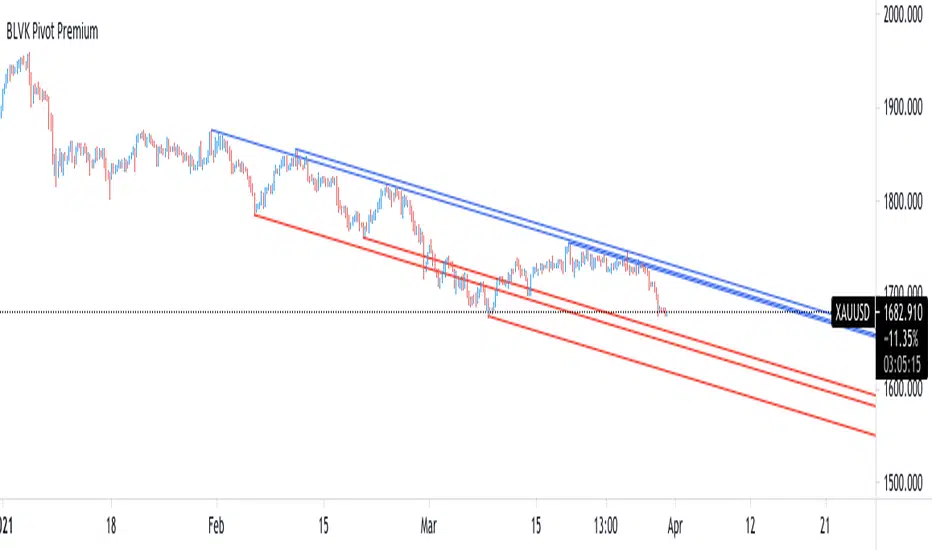
BLVK Pivot PremiumDisplays lines connecting past pivot high/low points with each line having the slope of a linear regression . This slope can also be controlled by the user with the 'Slope' setting. Each line can be used as a support or resistance by the user.
Settings
Length : Pivot length. Use higher values for having lines connected to more significant pivots points.
Lookback : Number of lines connecting a pivot high/low to display, with a total of lines equal to Lookback*2
Slope : Allows the user to multiply the linear regression slope by a number within -1 and 1
Limitations
The script has currently several real time behavior limitations. Lines are displayed retrospectively and will not update with the arrival of new bars. Readjusting the indicator to newer pivots will require the user to either hide/unhide the indicator or change its settings.
High Length or Lookback values might not return any lines if the location of a pivot point is outside the defined buffer size of the indicator (set as 5000 bars).
How To Use
The indicator can be used to get supports and resistances and is more so closer to a drawing tool due to its limitations. The lines not updating with the arrival of new bars have the advantage of providing fixed supports/resistances.
The Slope setting allows the user to control the angle and direction of the lines. Using a Slope of 1 will return lines with the same slope as the one of a linear regression fit from the farthest pivot point displayed by the indicator to the most recent bar.
Conclusion
We hope you like this indicator (drawing tool) and find it useful for drawing your support & resistances in a unique way!