ICT Turtle SoupICT Turtle Soup identifies classic “failed breakout” reversals after liquidity sweeps of recent highs/lows, then augments the setup with volume validation, market structure context, Kill Zone (session) filters, Order Blocks (OB), Fair Value Gaps (FVG), OTE (61.8–78.6%) zones, and optional risk targets (SL/TP 1:1, 1:2, 1:3). A compact dashboard summarizes current context (recent high/low, lookbacks, active session, structure state, mitigation counts).
What the Script Does
⦁ Detects Turtle Soup events: Price breaks a prior swing extreme and then quickly reverses back inside the range.
⦁ Grades signal quality: Factors include reversal speed, volume confirmation, breakout magnitude, and consecutive patterns.
⦁ Overlays market context: Trend/range classification (ADX / MA / ATR Bands / Combined), Kill Zones (Asian/London/NY), and time-of-day filters.
⦁ Marks IMB / mitigation zones: Draws Order Blocks and Fair Value Gaps, with optional live mitigation tracking and fading/removal on mitigation.
⦁ Shows OTE zones (61.8–78.6%) after confirmed reversals to highlight potential pullback entries.
⦁ Plots risk management guides: Optional SL buffer below/above reversal wick and TP bands at 1:1, 1:2, 1:3 R multiples.
⦁ Emits alerts on bullish/bearish Turtle Soup confirmations.
How It Works (Conceptual)
1. Liquidity Sweep & Breakout Check
⦁ Looks back over user-defined windows (single or multiple lookbacks: short/medium/long) to find the most recent swing high/low.
⦁ Flags a breakout when price pierces that swing (above for bearish, below for bullish).
⦁ Optional breakout bar volume check requires volume > avg(volume, N) × multiplier.
⦁ Optional swing age check requires the broken swing to be at least X bars old.
2. Reversal Confirmation
⦁ Within N bars after the sweep, validates a mean-reversion close back inside the prior range with a minimum wick/body ratio to confirm rejection.
⦁ Quality Score adds points for:
⦁ Speed: reversal within fast_reversal_bars;
⦁ Volume: breakout and/or reversal volume spike;
⦁ Series: previous consecutive signals;
⦁ Magnitude: sufficient sweep distance.
⦁ Optional high-quality filter only shows signals meeting a minimum score.
3. Context Filters (Optional)
⦁ Sessions/Kill Zones: Only allow signals in selected sessions (Asian/London/NY) with fully custom HHMM inputs.
⦁ Time Window: Restrict to specific hours (e.g., 08–12).
⦁ Market Structure: Classify Trending vs. Ranging (via ADX, MA separation/slope, ATR bands, or Combined). You can allow signals in trends, ranges, or both.
4. Smart Confluence Layers
⦁ Order Blocks: Finds likely OBs with structural validation (e.g., bearish up-candle prior to down move), imbalance score (body/range × volume factor), and extend-until-touched with mitigation % tracking.
⦁ Fair Value Gaps: Detects valid 3-bar gaps (bull/bear) with size threshold, supports touch / 50% / full mitigation logic, and can fade or remove after mitigation.
⦁ OTE Zones: After a reversal, projects the 61.8–78.6% retracement box from the actual swing range; offset scales to timeframe to avoid clutter.
5. Risk & Display
⦁ SL/TP guides: Optional wick-buffered SL and 1:1/1:2/1:3 TPs.
⦁ Dashboard: Recent high/low, active lookbacks, current session, structure label, and live counts of mitigated OBs/FVGs.
Signals & Visuals
⦁ Bullish Turtle Soup: Triangle up + label (🐢S/M/L/D + star rating).
⦁ Bearish Turtle Soup: Triangle down + label (🐢S/M/L/D + star rating).
⦁ Labels can show: quality stars, FAST/SLOW reversal, reversal & breakout volume tags, previous consecutive count, and last move %.
⦁ Lines/Boxes: OBs, FVGs, OTE zones, SL/TP bands, and optional breakout magnitude line.
Inputs (Key Groups)
⦁ Turtle Soup: Lookbacks (single or S/M/L), reversal bars, wick ratio, magnitude line, reversal speed, volume confirmation (multiplier/length), consecutive tracking.
⦁ Order Blocks: Show/validate structure, lookback, extend-until-touched, mitigation % threshold, colors.
⦁ Fair Value Gaps: Show, min size %, colors, mitigation mode (Touch/50%/Full), optional remove-on-mitigation.
⦁ Kill Zones/Sessions: Enable Asian/London/NY with custom HHMM, colors.
⦁ OTE: Show OTE (61.8–78.6%), color, timeframe-adaptive offsets.
⦁ Signal Filters: Filter by session, time window, market structure method (ADX/MA/ATR/Combined), thresholds (ADX, MA periods, ATR multiplier), trending/ranging allowances, structure label & offset.
⦁ SL/TP: SL buffer %, TP 1:1/1:2/1:3 toggles & colors.
⦁ Breakout Validation: Require breakout-bar volume, min swing age, volume label toggles.
⦁ Alerts: Enable/disable.
⦁ Dashboard: Position, text size, colors, border.
How to Use
1. Markets & Timeframes: Works on FX, crypto, indices, and futures. Start with M5–H1 for intraday and H1–H4 for swing; refine lookbacks per instrument volatility.
2. Core Flow:
⦁ Enable multiple lookbacks for robustness on mixed volatility.
⦁ Turn on validate_swing_significance to avoid micro sweeps.
⦁ Use validate_breakout_volume + use_volume_confirmation to filter weak pokes.
3. Context Choice:
⦁ In ranging environments, allow both sides; in trends, consider counter-trend only at HTF OB/FVG/OTE confluence.
⦁ Narrow to London/NY for higher activity if desired.
4. Entries/Stops/Targets:
⦁ Entry on confirmed label close or at OTE pullback post-signal.
⦁ SL: below/above reversal wick + sl_buffer%.
⦁ TP: scale at 1:1/1:2/1:3 or manage via OB/FVG/structure breaks.
5. Confluence: Prefer Turtle Soup that aligns with OB/FVG zones and Combined structure method for added reliability.
Alerts
⦁ “Bullish Turtle Soup detected” and “Bearish Turtle Soup detected” fire on confirmation.
⦁ Set to Once Per Bar (as coded) or adjust in the alert dialog per your workflow.
Notes & Tips
⦁ Multiple lookbacks (S/M/L) help capture both shallow and deep liquidity sweeps.
⦁ Use market structure label with offset to keep it readable on the right of price.
⦁ Mitigation tracking visually communicates when OB/FVG confluence is no longer valid.
⦁ Dashboard = fast situational awareness; keep it on during live trading.
Limitations & Disclaimer
⦁ This tool is educational and not financial advice. No profitability or win-rate is implied. Markets carry risk; manage position size and test thoroughly.
⦁ Signal quality depends on market regime, spreads, news, and data quality. Backtests/forward-tests may differ.
⦁ Visual objects are capped for performance; old items may auto-clean to keep charts responsive.
OTE

ICT Multi-Session Hi/L/EQ
Indicator Overview: The "ICT Multi-Session Hi/L/EQ" indicator is a versatile tool designed for traders utilizing Inner Circle Trader (ICT) strategies, enabling the visualization of key price levels—High (H), Low (L), Equilibrium (EQ, the midpoint between high and low), and Optimal Trade Entry (OTE) levels at 61.8%, 70%, and 79% of the session range—across up to 6 customizable market sessions on a single chart.
Core Functionality: It dynamically tracks and plots session-specific highs, lows, and EQ, updating in real-time as price action evolves, providing traders with immediate insights into potential support, resistance, and balance zones during defined periods like the Asian, London, or New York sessions. This multi-session capability allows for comprehensive market analysis without the need for multiple indicators.
Unique OTE Auto Detection: A standout feature is the automatic detection and directional calculation of OTE levels. When a session forms a new high, OTE levels are recalculated downward from the high to the low (bearish bias), highlighting potential short entry zones. Conversely, a new low triggers upward OTE levels from the low to the high (bullish bias), signaling long opportunities. This auto-detection adapts to market momentum without manual input, making it highly unique for ICT traders seeking efficient entry signals based on range retracements. No other indicator combines this session-based auto-directionality with OTE percentages tailored for ICT methodologies.
Left-Side Trimming Innovation: Another innovative aspect is the left-side trimming option, which allows users to limit the historical extension of lines to a user-defined number of bars (e.g., the last 8 bars), reducing chart clutter and focusing attention on recent price action. This feature is particularly unique as it addresses a common issue in multi-session indicators where full historical lines can overwhelm the chart, making it ideal for scalpers or day traders who prioritize clarity.
Without trimming the left side:
And when left side trimming is enabled:
Multi-Session Customization: Support for up to 6 independent sessions, each with individual time ranges (HHMM-HHMM format), timezones, and enable/disable toggles, offers unparalleled flexibility. Traders can configure sessions for specific market phases (e.g., Asia: 2000-0000 UTC) and customize colors, line styles (solid, dashed, dotted), and label properties separately, ensuring a personalized setup for global trading environments.
Auto-Deletion at Market Close: Levels can be automatically deleted at the session's calculated market close (17:00 NY timestamp), keeping the chart clean for the next session or day, a useful feature for avoiding accumulation of outdated levels.
Label and Visual Controls: Users can toggle labels on/off, adjust text color, background color, transparency, and size (tiny, small, normal, large), with options to stick labels to the right for better visibility. This level of customization ensures the indicator integrates seamlessly with any chart style.
No External Dependencies: All calculations are performed using built-in Pine Script functions on the chart's price data, making it self-contained and reliable without needing external libraries or data sources.
Professional and Compliant Design: Developed to comply with TradingView House Rules, this indicator is original in its combination of multi-session plotting, directional OTE auto-detection, and left-side trimming, providing traders with a robust tool for ICT-based analysis.
How It Works
Session Setup: Define session times and timezones in settings; the script tracks high/low from session start.
Level Calculation: High/low update on every bar; EQ is the midpoint. OTE levels recalculate directionally upon new extremes.
Drawing Mechanism: Lines extend with user-defined padding; trimming cuts left side for cleanliness.
Update Logic: OTE direction shifts based on new high/low detection, with levels refreshed accordingly.
Deletion: Auto-deletes at session end if enabled, resetting for new sessions.
Uniqueness and Innovation
Session OTE Auto Detection: Automatically adjusts OTE direction based on new highs/lows, a feature not commonly available in other indicators, enabling hands-free bias identification.
Left-Side Trimming: Unique clutter-reduction tool that trims historical lines, improving chart readability—a rare capability in session-based indicators.
Multi-Session Support: Handles 6 sessions independently, with per-session OTE, making it a one-stop tool for global market analysis.
Directional OTE: Adapts to market bias, offering dynamic entry zones tailored to ICT strategies.
Full Customization: Extensive controls for visuals and behavior, ensuring adaptability to individual trading styles.
User Guide: How to Use the "ICT Multi-Session Hi/L/EQ" Indicator
This guide provides a comprehensive, step-by-step explanation of how to use the "ICT Multi-Session Hi/L/EQ" indicator on TradingView. The indicator is designed to help Inner Circle Trader (ICT) enthusiasts plot key price levels—High (H), Low (L), Equilibrium (EQ, the midpoint), and Optimal Trade Entry (OTE) levels at 61.8%, 70%, and 79% of the session range—across up to 6 customizable sessions. It also includes a Candle Open line for midnight or custom times. I'll break it down by settings groups, explaining each option, its purpose, how to tweak it, and tips for optimal use. All settings are accessible via the indicator's settings panel (cog icon next to the indicator name on your chart).
General Settings
These control global behaviors that apply to all sessions and levels. They allow you to customize the overall appearance and functionality of the indicator on your chart.
Line Padding (Bars Beyond Current): This integer input (default: 2, minimum: 0) extends the plotted lines beyond the current bar by the specified number of bars.
How to Use/Tweak: Increase this value (e.g., to 5) for longer forward projections of levels, useful for anticipating future price action. Decrease to 0 for no extension. It's ideal for traders who like to see levels projected ahead in volatile markets.
Tip: On lower timeframes (e.g., 5M), higher padding (4-6) helps visualize potential targets; on higher timeframes (1H), keep it low to avoid clutter.
Label Padding (Bars from Line End): An integer (default: 3, minimum: 0) that positions labels away from the end of the lines by the specified bars.
How to Use/Tweak: Adjust to move labels further right (higher value) or closer to the line end (lower value). This prevents label overlap with price action or other indicators.
Tip: If your chart has many labels, set to 5+ for better readability; use 1-2 for minimalistic setups.
Enable Left-Side Trimming: A boolean toggle (default: true) to trim lines from the left, limiting their historical extension.
How to Use/Tweak: Turn on to reduce chart clutter by showing only recent bars of the lines; turn off for full historical view. Pairs with "Left Trim Bars" for fine-tuning.
Tip: Enable for clean charts during live trading; disable for backtesting to see long-term patterns.
Left Trim Bars: An integer (default: 8, minimum: 1) specifying how many bars back from the current bar to trim lines when left trimming is enabled.
How to Use/Tweak: Set higher (e.g., 20) for more historical visibility while trimmed; lower (e.g., 4) for ultra-clean charts focusing on immediate action.
Tip: Use 8-12 for intraday trading on 15M charts; adjust based on timeframe to balance context and clarity.
Stick Labels to Right of Current Bar: A boolean toggle (default: true) to position labels at the right end of the lines.
How to Use/Tweak: Enable for labels to "stick" right, keeping them visible as the chart updates; disable for labels at the current bar position.
Tip: Keep enabled for real-time trading to avoid labels shifting left; disable for static analysis.
Delete Previous Session Lines/Labels on Market Close: A boolean toggle (default: true) to automatically delete session lines and labels at the calculated market close (17:00 NY time).
How to Use/Tweak: Enable to keep the chart clean by clearing old sessions; disable to retain historical levels for reference.
Tip: Enable for live trading to focus on active sessions; disable for educational reviews or backtesting.
Session 1 to 6 Settings
Each session has identical options, allowing independent configuration. I'll describe Session 1; replicate for others by changing the number (e.g., Session 2 uses "Session 2 Name", etc.).
Session Name: String input (default: "Asia" for Session 1) to label the session (e.g., "Asia" or "London").
How to Use/Tweak: Enter a descriptive name like "NY Open" for clarity in labels (e.g., "NY Open High").
Tip: Use short names to avoid long labels; this appears in all session labels for easy identification.
Session Time (HHMM-HHMM): Session input (default: "2000-0000" for Session 1) to define the start and end time.
How to Use/Tweak: Set the time range (e.g., "0930-1600" for NY session). Ensure start < end in 24-hour format.
Tip: Use for custom sessions like "London Kill Zone" (0800-1100); validate with the timezone setting.
Session Timezone: String selection (default: "America/New_York") from a list of options.
How to Use/Tweak: Choose the timezone matching your session (e.g., "Europe/London" for UK times).
Tip: Align with session name for accuracy; "Etc/UTC" for universal times.
Enable Session Drawings: Boolean toggle (default: true for Session 1, false for others) to activate the session's lines and labels.
How to Use/Tweak: Enable to show the session; disable to hide it without removing settings.
Tip: Enable one session at a time for focused analysis; use for multi-session overlays.
Enable EQ Line/Label: Boolean toggle (default: true) to show the EQ line and label.
How to Use/Tweak: Enable for midpoint plotting; disable to hide EQ while keeping high/low.
Tip: Useful for ICT fair value gaps; toggle off if focusing on extremes only.
Enable Labels: Boolean toggle (default: true) to show labels for high, low, EQ, and OTE levels.
How to Use/Tweak: Enable for annotated levels; disable for lines-only view.
Tip: Disable on crowded charts; customize label size for better readability.
Enable OTE Levels: Boolean toggle (default: false) to activate OTE levels (61.8%, 70%, 79%).
How to Use/Tweak: Enable for OTE plotting; disable to hide while keeping high/low/EQ.
Tip: Toggle on for entry zone identification; adjust colors for visual distinction.
Line Color: Color input (default varies by session, e.g., blue for Session 1) for lines.
How to Use/Tweak: Choose a color to differentiate sessions (e.g., green for bullish).
Tip: Use contrasting colors for multiple sessions; match your chart theme.
Line Style: String selection (default: "Dashed") from "Solid", "Dashed", "Dotted".
How to Use/Tweak: Select style for line appearance (e.g., dotted for OTE).
Tip: Use dashed for OTE to distinguish from solid high/low lines.
Label Text Color: Color input (default: white) for label text.
How to Use/Tweak: Set to contrast with background (e.g., black on white charts).
Tip: Use bright colors for visibility; match line color for cohesion.
Label Background Color: Color input (default: black) for label background.
How to Use/Tweak: Choose a semi-transparent background for readability.
Tip: Set to chart background color for subtle labels.
Label Transparency (0=opaque, 100=transparent): Integer input (default: 70) for label opacity.
How to Use/Tweak: Lower for solid labels (e.g., 0); higher for see-through (e.g., 90).
Tip: Use 50-80 for balance; 100 hides background entirely.
Label Text Size: String selection (default: "Small") from "Tiny", "Small", "Normal", "Large".
How to Use/Tweak: Choose size for label visibility (e.g., "Large" for emphasis).
Tip: "Small" for crowded charts; "Large" for main levels.
OTE 61.8% Color: Color input (default: purple) for 61.8% OTE line.
How to Use/Tweak: Customize to highlight the 61.8% level (e.g., gold for key entry).
Tip: Use distinct colors for each OTE level to differentiate (e.g., purple, orange, teal).
OTE 70% Color: Color input (default: orange) for 70% OTE line.
How to Use/Tweak: Set to a secondary color for mid-range OTE.
Tip: Coordinate with overall theme; use faded shades for less prominence.
OTE 79% Color: Color input (default: teal) for 79% OTE line.
How to Use/Tweak: Choose for the deepest OTE level (e.g., red for aggressive entries).
Tip: Make it stand out if 79% is your preferred entry zone.
Candle Open Settings
This section adds a custom open line (e.g., midnight open) with similar customization.
Use Time 1: Boolean toggle (default: true) to enable the first time setting.
How to Use/Tweak: Enable for the open line; disable to hide.
Tip: Use for midnight open in ICT setups; toggle off if not needed.
Name: String input (default: "Midnight Open") for the open line label.
How to Use/Tweak: Change to "Daily Open" or similar for context.
Tip: Keep short for clean labels.
Start Time: String input (default: "0000") for open range start.
How to Use/Tweak: Set in HHMM format (e.g., "0000" for midnight).
Tip: Ensure valid (0000-2359); pair with end time for narrow ranges.
End Time: String input (default: "0001") for open range end.
How to Use/Tweak: Set slightly after start (e.g., "0001") for precise open capture.
Tip: Use for quick ranges; start < end always.
Color: Color input (default: teal) for the open line.
How to Use/Tweak: Customize to distinguish from session lines.
Tip: Use gray for subtle open lines.
Timezone: String selection (default: "America/New_York") for the open line.
How to Use/Tweak: Choose matching your chart or session.
Tip: "Etc/UTC" for universal opens.
Enable Line/Label: Boolean toggle (default: true) for the open line/label.
How to Use/Tweak: Enable to show; disable to hide.
Tip: Use for daily opens in ICT; toggle off for session-only focus.
Enable Label: Boolean toggle (default: true) for the open label.
How to Use/Tweak: Enable for named label; disable for line-only.
Tip: Disable if labels clutter the chart.
Auto Delete at 18:00 NY: Boolean toggle (default: true) to delete at 18:00 NY.
How to Use/Tweak: Enable for cleanup; disable to retain.
Tip: Align with new day start; useful for resetting.
Stick Label to Right: Boolean toggle (default: true) for label positioning.
How to Use/Tweak: Enable for right-side labels; disable for current bar.
Tip: Keep enabled for visibility as chart updates.
Enable Left-Side Trimming: Boolean toggle (default: true) for open line trimming.
How to Use/Tweak: Enable to trim historical open line; disable for full view.
Tip: Similar to session trimming; use for clean charts.
Left Trim Bars: Integer input (default: 8) for open line trim bars.
How to Use/Tweak: Set the number of bars back to show when trimming.
Tip: Lower for more focus; higher for context.
Line Padding (Bars Beyond Current): Integer input (default: 2) for open line extension.
How to Use/Tweak: Increase for forward projection; decrease for no extension.
Tip: Match general padding for consistency.
Label Padding (Bars from Line End): Integer input (default: 3) for open label position.
How to Use/Tweak: Adjust to move label away from line end.
Tip: Higher for spaced labels; lower for compactness.
Line Style: String selection (default: "Solid") for open line style.
How to Use/Tweak: Choose "Dashed" or "Dotted" for distinction.
Tip: Use dotted for subtle opens.
Label Text Color: Color input (default: white) for open label text.
How to Use/Tweak: Set to contrast with background.
Tip: Black for light charts.
Label Background Color: Color input (default: black) for open label background.
How to Use/Tweak: Customize for visibility.
Tip: Semi-transparent for blend.
Label Transparency: Integer input (default: 70) for open label opacity.
How to Use/Tweak: 0 for opaque; 100 for transparent.
Tip: 50-80 for balance.
Label Text Size: String selection (default: "Small") for open label size.
How to Use/Tweak: "Large" for emphasis; "Tiny" for minimalism.
Tip: "Normal" for standard use.

Session Range ProjectionsSession Range Projections
Purpose & Concept:
Session Range Projections is a comprehensive trading tool that identifies and analyzes price ranges during user-defined time periods. The indicator visualizes high-probability reversal zones and profit targets by projecting Fibonacci levels from custom session ranges, making it ideal for traders who focus on time-based market structure analysis.
Key Features & Calculations:
1. Custom Time Range Analysis
- Define any time period for range calculation - from traditional sessions (Asian, London, NY) to custom periods like opening ranges, hourly ranges, or 4-hour blocks
- Automatically captures the highest and lowest prices within your specified timeframe
- Supports multiple timezone selections for global market analysis
- Flexible enough for intraday scalping ranges or longer-term swing trading setups
2. Premium & Discount Zones
- Automatically divides the range into premium (above 50%) and discount (below 50%) zones
- Visual differentiation helps identify institutional buying and selling areas
- Color-coded boxes clearly mark these critical price zones
3. Optimal Trade Entry (OTE) Zones
- Highlights the 79-89% retracement zone in premium territory
- Highlights the 11-21% retracement zone in discount territory
- These zones represent high-probability reversal areas based on institutional order flow concepts
4. Fibonacci Projections
- Projects 11 customizable Fibonacci extension levels from the range extremes
- Levels extend both above and below the range for symmetrical analysis
- Each level can be individually toggled and color-customized
- Default levels include common retracement ratios: -0.5, -1.0, -2.0, -2.33, -2.5, -3.0, -4.0, -4.5, -6.0, -7.0, -8.0
How to Use:
Set Your Time Range: Input your desired session start and end times (24-hour format)
Select Timezone: Choose the appropriate timezone for your trading session
Customize Display: Toggle various visual elements based on your preferences
Monitor Price Action: Watch for reactions at projected levels and OTE zones
Set Alerts: Configure sweep alerts for when price breaks above/below range extremes
Input Parameters Explained:
Time Range Settings
Range Start/End Hour & Minute: Define your analysis period
Time Zone: Ensure accurate session timing across different markets
Visual Settings
Range Box: Toggle the premium/discount zone visualization
Horizontal Lines: Customize high/low line appearance
Internal Range Levels: Show/hide equilibrium and OTE zones
Labels: Configure text display for key levels
Fibonacci Projections: Enable/disable extension levels
Display Settings
Historical Ranges: Show up to 10 previous session ranges
Alert Type: Choose between high sweep, low sweep, or both
Trading Applications:
Session-Based Trading: Analyze specific market sessions (Asian, London, New York, opening ranges, hourly ranges)
Reversal Trading: Identify high-probability reversal zones at OTE levels
Breakout/Reversal Trading: Monitor range breaks/reversals with built-in sweep alerts
Risk Management: Use Fibonacci projections as profit targets or rejection areas
Multi-Timeframe Analysis: Apply to any timeframe for various trading styles
Important Notes:
This indicator is for educational purposes only and should not be considered financial advice
Past performance does not guarantee future results
Always use proper risk management when trading
The indicator automatically manages historical data to maintain chart performance

Fibonacci Optimal Entry Zone [OTE] (Zeiierman)█ Overview
Fibonacci Optimal Entry Zone (Zeiierman) is a high-precision market structure tool designed to help traders identify ideal entry zones during trending markets. Built on the principles of Smart Money Concepts (SMC) and Fibonacci retracements, this indicator highlights key areas where price is most likely to react — specifically within the "Golden Zone" (between the 50% and 61.8% retracement).
It tracks structural pivot shifts (CHoCH) and dynamically adjusts Fibonacci levels based on real-time swing tracking. Whether you're trading breakouts, pullbacks, or optimal entries, this tool brings unparalleled clarity to structure-based strategies.
Ideal for traders who rely on confluence, this indicator visually synchronizes swing highs/lows, market structure shifts, Fibonacci retracement levels, and trend alignment — all without clutter or lag.
⚪ The Structural Assumption
Price moves in waves, but key retracements often lead to continuation or reversal — especially when aligned with structure breaks and trend shifts.
The Optimal Entry Zone captures this behavior by anchoring Fibonacci levels between recent swing extremes. The most powerful area — the Golden Zone — marks where institutional re-entry is likely, providing traders with a sniper-like roadmap to structure-based entries.
█ How It Works
⚪ Structure Tracking Engine
At its core, the indicator detects pivots and classifies trend direction:
Structure Period – Determines the depth of pivots used to detect swing highs/lows.
CHoCH – Break of structure logic identifies where the trend shifts or continues, marked visually on the chart.
Bullish & Bearish Modes – Independently toggle uptrend and downtrend detection and styling.
⚪ Fibonacci Engine
Upon each confirmed structural shift, Fibonacci retracement levels are projected between swing extremes:
Custom Levels – Choose which retracements (0.50, 0.618, etc.) are shown.
Real-Time Adjustments – When "Swing Tracker" is enabled, levels and labels update dynamically as price forms new swings.
Example:
If you disable the Swing Tracker, the Golden Level is calculated using the most recent confirmed swing high and low.
If you enable the Swing Tracker, the Golden Level is calculated from the latest swing high or low, making it more adaptive as the trend evolves in real time.
█ How to Use
⚪ Structure-Based Entry
Wait for CHoCH events and use the resulting Fibonacci projection to identify entry points. Enter trades as price taps into the Golden Zone, especially when confluence forms with swing structure or order blocks.
⚪ Real-Time Reaction Tracking
Enable Swing Tracker to keep the tool live — constantly updating zones as price shifts. This is especially useful for scalpers or intraday traders who rely on fresh swing zones.
█ Settings
Structure Period – Number of bars used to define swing pivots. Larger values = stronger structure.
Swing Tracker – Auto-updates fib levels as new highs/lows form.
Show Previous Levels – Keep older fib zones on chart or reset with each structure shift.
-----------------
Disclaimer
The content provided in my scripts, indicators, ideas, algorithms, and systems is for educational and informational purposes only. It does not constitute financial advice, investment recommendations, or a solicitation to buy or sell any financial instruments. I will not accept liability for any loss or damage, including without limitation any loss of profit, which may arise directly or indirectly from the use of or reliance on such information.
All investments involve risk, and the past performance of a security, industry, sector, market, financial product, trading strategy, backtest, or individual's trading does not guarantee future results or returns. Investors are fully responsible for any investment decisions they make. Such decisions should be based solely on an evaluation of their financial circumstances, investment objectives, risk tolerance, and liquidity needs.

CandelaCharts - Fib Retracement (OTE) 📝 Overview
The CandelaCharts Fib Retracement (OTE) indicator is a precision tool designed to help traders identify Optimal Trade Entry (OTE) levels based on Fibonacci retracement principles, as taught in ICT (Inner Circle Trader) methodology.
This indicator automatically plots Fibonacci retracement levels between a selected swing high and swing low, highlighting the key OTE zone between the 61.8% and 78.6% retracement levels—a prime area for potential reversals in trending markets.
📦 Features
Automatic & Custom lookback modes
Customizable fib levels
Dynamic coloring
Reverse & extend
⚙️ Settings
Lookback: Controls the number of bars to look back. You can choose between **Automatic** or **Custom** mode.
Line Style: Sets the line style for the Fibonacci levels.
Levels: 0, 0.236, 0.0.382, 0.500, 0.620, 0.705, 0.790, 0.886, 1.000. Allows you to toggle the visibility of Fibonacci levels.
Dynamic Coloring: Colors Fibonacci levels according to trend direction.
Show Labels: Shows the price value at each Fibonacci level.
Reverse: Flips the Fibonacci levels in the opposite direction.
Extend Left: Extends the Fibonacci levels to the left.
⚡️ Showcase
Dynamic Coloring
Manual Coloring
Fib Retracement
Extended
Custom Length
📒 Usage
Using the CandelaCharts Fib Retracement (OTE) is pretty straightforward—just follow these steps to spot high-probability trade setups and refine your entries.
Identify the Trend – Determine whether the market is in an uptrend or downtrend.
Select Swing Points – The indicator automatically plots from the most recent swing high to swing low (or vice versa).
Wait for Price to Enter OTE Zone – Look for price action confirmation within the optimal entry zone (61.8%-78.6%).
Enter the Trade – Consider longs in an uptrend at the OTE zone, and shorts in a downtrend.
Set Stop & Target – Place stops below/above the swing low/high and target extension levels (127.2%, 161.8%).
🎯 Key takeways
The CandelaCharts Fib Retracement (OTE) is a must-have tool for traders looking to refine their entries and maximize risk-reward potential with precision-based ICT trading strategies. 🚀
🚨 Alerts
The indicator does not provide any alerts!
⚠️ Disclaimer
Trading involves significant risk, and many participants may incur losses. The content on this site is not intended as financial advice and should not be interpreted as such. Decisions to buy, sell, hold, or trade securities, commodities, or other financial instruments carry inherent risks and are best made with guidance from qualified financial professionals. Past performance is not indicative of future results.

Discount/Premium OTE LevelsThis indicator is created to identify discount/premium areas to provide additional confluence to trades taken. The underlying theory is that the trades taken in discounted areas are likely to have less risk due to a smaller stop loss and a higher reward/risk ratio.
The indicator operates by first identifying a zone between the last major swing high and low. These highs and lows are determined as price points that at the extremes within the number of bars to the left, as defined by the "Swing Sensitivity" setting.
Once a price zone is established, the indicator verifies that the zone meets the minimum size in points as configured via the "Minimum size" setting to be considered tradable. Zones that are too small may not provide a sufficient range even for scalping. The default value is 42 points based on Nasdaq, which means that the distance between inner most OTE levels (0.382 and 0.618) is at least 10 points.
When a valid zone is identified, it is then subdivided into areas of interest based on OTE levels, which can be configured/adjusted via the "Levels to Draw" setting. These levels represent the midpoint (50%), which distinguishes between premium and discount, and the three OTE levels 0.79, 0.705, 0.618, above the 50% for discount and below the 50% for premium.
For example, if a zone is formed initially by a swing low followed by a swing high with the assumption that the draw is higher, the indicator can be used to formulate long positions from below the 50% level starting at 0.38 OTE level, or ideally at 0.295 OTE level using 0 as a stop loss. Alternatively, if the 50% level is not yet tapped, short scalp positions can be made from 0.79-0.618 OTE levels with 50% as a partial or TP target.
See for long/short example
Typically, the indicator will show only a single zone. However, there may be cases with two zones: one larger parent zone containing a smaller, valid price zone within itself.
The indicator will automatically invalidate and remove the zone once the high/low of the zone is invalidated.
Configuration:
The indicator provides several visualization options for customization, including:
Color settings for OTE levels, with separate settings for edge/50% color, premium, and discount levels.
Settings for line style for OTE levels.
Settings to determine whether to show prices on level labels.
Settings to decide if lines should be extended to the right.

Monday_Weekly_Range/ErkOzi/Deviation Level/V1"Hello, first of all, I believe that the most important levels to look at are the weekly Fibonacci levels. I have planned an indicator that automatically calculates this. It models a range based on the weekly opening, high, and low prices, which is well-detailed and clear in my scans. I hope it will be beneficial for everyone.
***The logic of the Monday_Weekly_Range indicator is to analyze the weekly price movement based on the trading range formed on Mondays. Here are the detailed logic, calculation, strategy, and components of the indicator:
***Calculation of Monday Range:
The indicator calculates the highest (mondayHigh) and lowest (mondayLow) price levels formed on Mondays.
If the current bar corresponds to Monday, the values of the Monday range are updated. Otherwise, the values are assigned as "na" (undefined).
***Calculation of Monday Range Midpoint:
The midpoint of the Monday range (mondayMidRange) is calculated using the highest and lowest price levels of the Monday range.
***Fibonacci Levels:
// Calculate Fibonacci levels
fib272 = nextMondayHigh + 0.272 * (nextMondayHigh - nextMondayLow)
fib414 = nextMondayHigh + 0.414 * (nextMondayHigh - nextMondayLow)
fib500 = nextMondayHigh + 0.5 * (nextMondayHigh - nextMondayLow)
fib618 = nextMondayHigh + 0.618 * (nextMondayHigh - nextMondayLow)
fibNegative272 = nextMondayLow - 0.272 * (nextMondayHigh - nextMondayLow)
fibNegative414 = nextMondayLow - 0.414 * (nextMondayHigh - nextMondayLow)
fibNegative500 = nextMondayLow - 0.5 * (nextMondayHigh - nextMondayLow)
fibNegative618 = nextMondayLow - 0.618 * (nextMondayHigh - nextMondayLow)
fibNegative1 = nextMondayLow - 1 * (nextMondayHigh - nextMondayLow)
fib2 = nextMondayHigh + 1 * (nextMondayHigh - nextMondayLow)
***Fibonacci levels are calculated using the highest and lowest price levels of the Monday range.
Common Fibonacci ratios such as 0.272, 0.414, 0.50, and 0.618 represent deviation levels of the Monday range.
Additionally, the levels are completed with -1 and +1 to determine at which level the price is within the weekly swing.
***Visualization on the Chart:
The Monday range, midpoint, Fibonacci levels, and other components are displayed on the chart using appropriate shapes and colors.
The indicator provides a visual representation of the Monday range and Fibonacci levels using lines, circles, and other graphical elements.
***Strategy and Usage:
The Monday range represents the starting point of the weekly price movement. This range plays an important role in determining weekly support and resistance levels.
Fibonacci levels are used to identify potential reaction zones and trend reversals. These levels indicate where the price may encounter support or resistance.
You can use the indicator in conjunction with other technical analysis tools and indicators to conduct a more comprehensive analysis. For example, combining it with trendlines, moving averages, or oscillators can enhance the accuracy.
When making investment decisions, it is important to combine the information provided by the indicator with other analysis methods and use risk management strategies.
Thank you in advance for your likes, follows, and comments. If you have any questions, feel free to ask."

NWOG & Dynamic Event Horizon°The ICT concept of New Week Opening Gaps (NWOG) is simply an imbalance that manifests at each Week Opening time. This gap in price is formed by the Close on Friday at 5PM EST and the open of Sunday at 6PM EST.
According to ICT's studies, this gap in price holds a lot of significance when it comes to price action, acting as a magnet or a point of reference during the week (and following weeks).
The Event Horizon (EH) is simply the midpoint between two of these NWOGs. The EH can be very useful to determine where price is drawn towards from a liquidity perspective. If price reaches this level it is probable that it will continue to the next NWOG, as explained by ICT himself.
In my own studies I have noticed that price also tends to respect and use the Optimal Trade Entry (OTE) levels drawn from both NWOGs in question. OTE levels are nothing but fibonacci 0.79 – 0.705 – 0.68 levels.
I decided to put all of these into an indicator that dynamically selects the most relevant NWOG Dealing Range and plots their EH and OTE levels automatically.
Available Alerts:
– Cross Below Event Horizon
– Cross Above Event Horizon
– New NWOG Range Established
Important Remarks:
– Note that although these work on all timeframes, the lower in resolution one goes, the less gaps will be available due to data availability.
– This indicator works on charts that have the NWOG already present in chart (i.e. no crypto assets, unless one looks at CME crypto futures such as BTC1! and ETH1!).
– The dollar index's NWOGs have a slightly different timestamp, however this has been taken care of and will allow to be plotted ONLY for the TVC:DXY ticker.
TrandingView struggles to display the indicator correctly for the default view, check out its accurate appearance here:

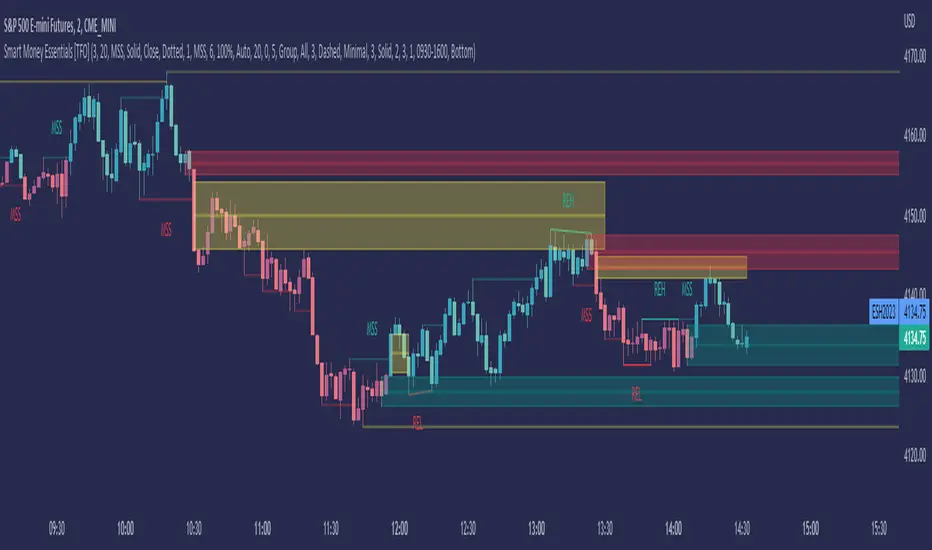
Smart Money Essentials [TFO]This indicator utilizes “Smart Money Concepts” like liquidity, order blocks, premium & discount, and more to analyze price action.
What’s included in the initial release:
Market Structure
Liquidity
Displacement
Order Blocks
Premium / Discount
Confluence Table
Alerts
Market structure logic objectively identifies whether the current trend is bullish or bearish, based on swing highs and lows. Liquidity levels offer insight into major pivots where we can assume many traders may place their stop loss, which can also serve as areas where “Smart Money” may be accumulating or distributing positions.
Displacement adds to this by spotting rapid price movement, often accompanied by imbalances where price may come back to before continuing in the direction of the displacement. These can be filtered based on whether the imbalance is accompanied by a Break of Structure (BOS) or Market Structure Shift (MSS), which may give additional insight into the draw on liquidity.
Order blocks (OB’s) are detected and treated as areas that may offer support for price in an uptrend or resistance in a downtrend. Premium and discount zones are essentially fitted by an “auto-fib” retracement that looks at recent liquidity levels, and optionally offers areas to look for an Optimal Trade Entry (OTE) where price retraces between 62-79% of the preceding displacement leg.
The confluence table provides an organized place to visualize and identify where any of the above concepts may be present at or around the same time. We can implement a threshold where, if the number of selected factors meets or exceeds this threshold, we can potentially identify bullish and bearish opportunities where multiple layers of confluence are overlapping.
And of course, alerts are built in for all significant events related to the above concepts, for example: runs on liquidity, BOS and MSS, rejections from OB and OTE, etc.
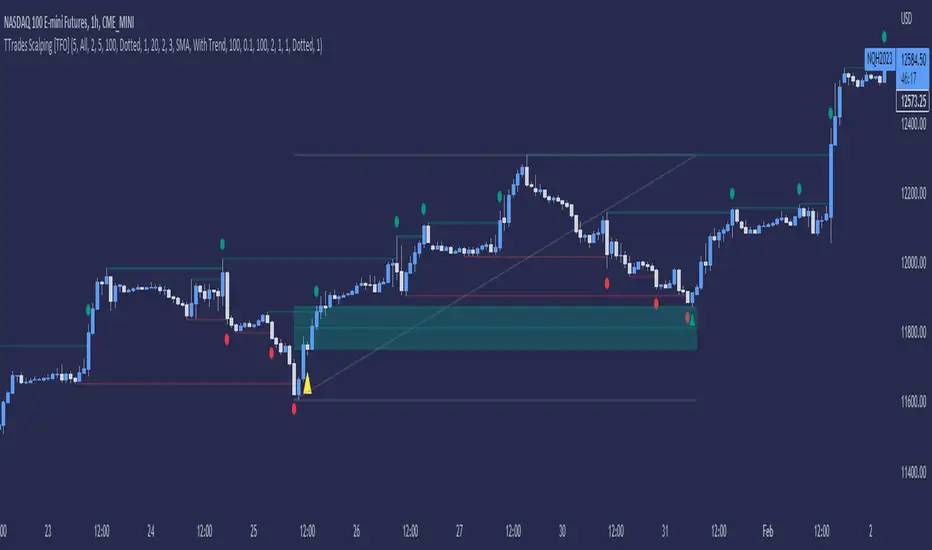
TTrades Scalping Indicator [TFO]Specialized for the scalping strategy of TTrades, this indicator focuses on inducement / stop hunt setups, utilizing additional factors such as volume spikes and trend bias to filter out setups that don’t fit the user-defined criteria.
The idea is that price is always seeking liquidity by reaching for trivial pivots where traders may put their stop loss orders. When price seeks these levels and stops these traders out, we may observe an influx of volume due to the large number of shares/contracts being exchanged given the large number of traders that have similar orders.
If price quickly comes back into the original range, we may determine this to be a stop hunt or a fakeout, only for price to proceed in the opposing direction. If it continues running and creates a displacement leg, we look to capitalize on that movement by tracking the Optimal Trade Entry (62 - 79% retracement), anchored to the swing pivot created as a result of the stop hunt.
Aside from volume, we can also use existing technical indicators like VWAP and SMA’s to ensure we’re only taking trades with the current trend (or against it). Simple criteria like this can help keep us out of low probability market environments.
OTE optimal trade entry (ICT); visible chart only: Dynamic-simple tool based on ICT free YouTube material of many years.
-Highlights a box showing Optimal Trade Entry (OTE): 61.8% - 78.6% retracement
-Auto shifts depending on Bull or Bear move on chart.
--If visible chart is Bullish (low then high): shows OTE box 61.8-78.6% retracement down from the high
--If visible chart is Bearish (high then low): shows OTE box 61.8-78.6% retracement up from the low
-Thanks the use of PineCoders Visible Chart Library, and some of the example code there

Automated MSB OTE Fibs and Premium DiscountOTE means optimal trade entry and can give the best price point to enter a trade at lower time frames. This indicator automatically draws these OTE levels and the premium /discount of the range, following a market structure break or MSB.
It does this by finding a pivot, checking if it has been broken by a candle body, then drawing a line for that MSB.
The premium /discount range and fib levels are taken from the high/low before and after the MSB, with the most recent MSB being used.
What is particularly great is that the levels and boxes move in realtime, so there is never any need to redraw things manually, drawing is fully automated and updates with every change in price or MSBs.
Settings:
Left and Right bars for Pivot - this determines the strength of the pivot that has been broken. The stronger the pivot, the stronger the MSB.
Max Lookback - How far to look back for MSBs.
Various aesthetic options to show bullish / bearish MSBs independently, as well as colour and line settings for the MSB, Fibs and Premium/Discount.

ote 3d v0This was supposed to be an automatic ICT OTE (Optimal Trade Entry) Fib level placement on a 3-day scale, but this did not turn out anywhere near close to how I envisioned it working.
Probably with some more development and applied math for the fib levels, I can get this to work even with breached 3D levels, but currently it's an exercise in frustration.
