ZoneRadar by Chaitu50cZoneRadar
ZoneRadar is a tool designed to detect and visualize hidden buy or sell pressures in the market. Using a Z-Score based imbalance model, it identifies areas where buyers or sellers step in with strong momentum and highlights them as dynamic supply and demand zones.
How It Works
Z-Score Imbalance : Calculates statistical deviations in order flow (bull vs. bear pressure).
Buy & Sell Triggers: Detects when imbalances cross predefined thresholds.
Smart Zones: Marks potential buy (green) or sell (red) zones directly on your chart.
Auto-Merge & Clean: Overlapping or noisy zones are automatically merged to keep the chart clean.
History Control: Keeps only the most recent and strongest zones for focus.
Key Features
Customizable Z-Score level and lookback period
Cooldown filter to avoid over-signaling
Smart zone merging to prevent clutter
Adjustable price tolerance for merging overlapping zones (ticks)
Extend zones into the future with right extensions
Fully customizable colors and display settings
Alert conditions for Buy Pressure and Sell Pressure
Why ZoneRadar?
Simplifies complex order flow into clear, tradable zones
Helps identify high-probability reversal or continuation levels
Avoids noise by keeping only the cleanest zones
Works across any timeframe or market (stocks, futures, forex, crypto)
Disclaimer
This tool is designed for educational and informational purposes only. It does not provide financial advice. Always test on demo and combine with your own trading strategy.
Orderblocks

FlowScope [Hapharmonic]FlowScope: Uncover the Market's True Intent 🔬
Ever wished you could look inside the candles and see where the real action is happening? FlowScope is your microscope for the market's flow, designed to give you a powerful edge by revealing the volume distribution that price action alone can't show you.
Instead of just looking at the open, high, low, and close, FlowScope lets you dive deeper into the market's auction process. It groups candles together and builds a detailed Volume Profile for that period, showing you exactly where the trading happened and revealing the story behind the price action.
Let's explore how you can use it to gain a powerful new edge.
🧐 Core Concept: How It Works
At its heart, FlowScope does three key things:
It Groups Candles: You decide how many candles to group together. For example, setting " Group Candles " to 4 on a 5-minute chart effectively gives you a detailed 20-minute candle and profile. This helps you see the bigger picture and filter out market noise.
It Builds a Volume Profile: For each group, FlowScope analyzes the volume at every single price level. It then displays this as a horizontal histogram (we call this a "footprint" or profile). Longer bars mean more volume was traded at that price, indicating a "fair" price or an area of acceptance. Shorter bars mean price moved through quickly, indicating rejection.
It Creates a Custom "Grouped Candle": To summarize the group's overall price action, FlowScope draws a single, custom candle representing the entire group's:
Open: The open of the first candle in the group.
High: The absolute highest price reached within the group.
Low: The absolute lowest price reached within the group.
Close: The close of the last candle in the group.
This gives you a crystal-clear view of the group's net result, free from the back-and-forth noise of the individual candles inside it.
Below are some of the stunning preset color palettes you can choose from to customize your view:
🚀 How to Use: Practical Applications
FlowScope isn't just for looking pretty; it's a powerful analysis tool. Here are a few ways to integrate it into your trading:
Identify High-Volume Nodes (HVNs): Look for the longest bars in the profile. These are price levels where the market spent the most time and traded the most volume. HVNs often act as powerful "magnets" for price, becoming key areas of support and resistance.
Spot Low-Volume Nodes (LVNs): These are areas with very short bars or gaps in the profile. They represent price levels that the market moved through quickly and inefficiently. If price returns to an LVN, it's likely to move through it quickly again.
Analyze the Summary Box: This is where the real magic happens! ✨
Total Volume (Σ): The total volume for the entire group.
Buy (B) vs. Sell (S) Volume: FlowScope analyzes the lower timeframe action to estimate the buying and selling pressure that made up the total volume. Is a big red candle mostly aggressive selling, or was it just a lack of buyers? The B/S data gives you clues. A high-volume candle with nearly 50/50 buy/sell pressure might indicate absorption or a potential reversal.
Use the Grouped Candle for Clarity: Is the market in a clear uptrend, or is it just choppy? The grouped candle can give you a much clearer signal. A series of strong, green grouped candles shows much more conviction than a mix of small green and red candles.
⚙️ Settings & Customization
This is where you can truly make FlowScope your own. Let's walk through each setting.
Profile Settings
Group Candles: The number of standard chart candles you want to combine into a single FlowScope profile. A setting of 1 will analyze every single bar. A higher number gives you a broader market view. When Group Candles is set to 5, the data from the 5 individual candles are combined, and the volume is calculated accordingly.
Max Profile Boxes: This setting is more than just a number; it's a smart limit that ensures your profiles are always readable and relevant to the current market conditions.
Adaptive Sizing (The Ideal Goal): FlowScope first tries to create the perfect profile by making each volume box's height proportional to the current market volatility. It calculates an "ideal" box height based on the Average True Range ( ATR / 10 ). This is powerful because it automatically adapts: you get smaller, more detailed boxes in quiet, low-volatility markets, and larger, clearer boxes in volatile, fast-moving markets.
The Safety Cap (Your Setting): However, what if you group several candles during a massive price move? The price range could be huge! If we only used the small, ATR-based box height, you might end up with hundreds of tiny, unreadable boxes. This is where your Max Profile Boxes setting (defaulting to 50) comes in. It acts as a maximum detail cap . If the adaptive, volatility-based calculation determines that it would need more boxes than your setting (e.g., more than 50), the indicator will override it. It will then simply divide the entire price range of the group into exactly the number of boxes you specified (e.g., 50).
In short: You are setting the maximum allowable detail. FlowScope intelligently adapts the profile's granularity below that limit based on market volatility, ensuring you always get a clear and meaningful picture.
Style
Show Profile BG: A simple toggle to show or hide the faint background color behind the volume bars. Turning it off can create a cleaner look.
Color Mode: This dropdown controls how the volume profile text is colored.
Custom Gradient: This mode uses the three custom colors you select in the "Profile Colors" section to create a beautiful gradient across the profile.
Candle Color: This mode colors the profile based on whether the grouped candle was bullish (green) or bearish (red). The color will be a gradient, with the most intense color applied to the box with the highest volume; the colors of the other boxes will fade out from that point. It's a great way to see the profile's "mood" at a glance.
Profile Colors 🎨
Use Preset Palette: This is the master switch!
If checked: You can choose from 10 stunning, pre-designed color palettes from the Palette dropdown. The custom color pickers below will be disabled.
If unchecked (Default): The Palette dropdown will be disabled, and you can now choose your own three colors for the gradient.
Palette: (Only active when "Use Preset Palette" is checked) . Choose from 10 luxurious, eye-catching color schemes like "Solar Flare" or "Deep Space" to instantly change the look and feel of your chart.
Low Price / Mid Price / High Price: (Only active when "Use Preset Palette" is unchecked) . These three color pickers allow you to design your own unique gradient for the Custom Gradient color mode.
Candle Display
These settings control the custom "Grouped Candle" that summarizes the profile. When using the "Show Custom Candle" feature, you should change the chart's candlestick display to Bars for a cleaner view.
Show Custom Candle: This is the main toggle. When you check this box, the original chart candles will be hidden, and your custom FlowScope candle will be displayed instead. This custom candle is intentionally small to ensure it does not visually overlap with the volume profile boxes.
Show Body: (Only active when "Show Custom Candle" is checked) . Toggles the visibility of the candle's body.
Wick Width & Body Width: (Only active when "Show Custom Candle" is checked) . These sliders let you control the thickness of the wick and body lines to match your personal style.
Up Color / Down Color: (Only active when "Show Custom Candle" is checked) . Choose the colors for your bullish and bearish custom candles.
Experiment with the settings, find a style that works for you, and start seeing the market in a whole new light.
Happy trading! 📈😊

Cnagda Liquidit Trading SystemCnagda Liquidit Trading System helps spot where price is likely to trap traders and reverse, then gives simple, actionable Level to entry, place SL, and take profits with confidence. It blends imbalance zones, trend bias, order blocks, liquidity pools, high-probability fake Signal, and context-aware candle patterns into one clean workflow.
🟩🟥 Imbalance boxes: “Crowd rushed, gaps left”
What it is: Green/red boxes mark fast, one-sided moves where price “skipped” orders—think FVG-like zones that often get revisited.
Why it helps: Price frequently pulls back to “fill” these zones, creating clean retest entries with logical stops.
⏩How to use:
Green box = potential demand retest; Red box = potential supply retest. Enter on pullback into box, not on first impulse. Put stop on far side of box and aim first targets at recent swing points.
↕️ Swing bias (HH/HL vs LH/LL): “Which way is the road?”
What it is: Higher-highs/higher-lows = up-bias; Lower-highs/lower-lows = down-bias. system plots Buy/Sell OB levels aligned with that bias.
Why it helps: Trading with the broader flow reduces “hero trades” against institutions. Bias gives clearer entries and cleaner drawdowns.
⏩How to use:
Up-bias: look for long on Buy OB retests. Down-bias: look for short on Sell OB retests. Wait for a small rejection/engulfing to confirm before triggering.
🧱Order blocks: “Where big players remember”
What it is: last opposite-colored candle before an impulsive move—these zones often hold memory and reaction. system plots these as Buy/Sell OB lines.
Why it helps: Many breakouts pull back to the origin. Good entries often happen on retest, not on the breakout chase.
⏩ How to use:
Let price return into the OB, show wick rejection, and decent volume. Enter with stop beyond OB; define risk-reward before entry.
📊Volume coloring: “How Volume is move?”
What it is: Bar color reflects relative volume; inside bars are black. The dashboard also shows Volume and “Volume vs Prev.”
Why it helps: Patterns without volume often fade; volume validates strength and intent of moves.
⏩ How to use:
Favor entries where imbalance/OB/liquidity-grab coincide with higher volume. If volume is weak, reduce size or skip.
🧲 BSL/SSL liquidity pools: “Fishing for stops”
What it is: Equal highs cluster stops above (BSL); equal lows cluster stops below (SSL). system plots these and highlights the nearest one (“magnet”).
Why it helps: Price often sweeps these pools to trigger stops before reversing. This is a prime trap-reversal location.
⏩ How to use:
Watch nearest BSL/SSL. If price wicks through and closes back inside, anticipate a reversal. Trade reaction, not first poke. When price closes beyond, consider that pool mitigated and move on.
🟢🔴 Advanced liquidity grab: “Catch fakeout”
What it is: Bullish grab = makes a new low beyond a prior low but closes back above it, with a long lower wick, small body, and higher volume. Bearish is mirror. Labeled automatically.
Why it helps: It exposes trap moves (stop hunts) and often precedes true direction.
⏩ How to use:
Best when it aligns with a nearby imbalance/OB and supportive volume. Enter on reversal candle break or on retest. Stop goes beyond sweep wick.
🧠 Smart candlestick patterns (only in right place)
What it is: Engulfing, Hammer, Shooting Star, Hanging Man, Doji (with high volume), Morning/Evening Star, Piercing—but marked “effective” only if context (swing/trend/location) agrees.
Why it helps: same pattern in the wrong place is noise; in the right place, it’s signal.
⏩ How to use:
Location first (BSL/SSL/OB/imbalance), then pattern. Treat pattern as trigger/confirmation—one fresh label shows to keep chart clean.
🧭 Dashboard: “Context in a glance”
⏩ Reversal Level: current swing anchor—expect turns or reactions nearby; great for alerts and planning.
⏩ Volume vs Prev + Volume: Strength meter for signal candle—higher adds conviction.
⏩ Nearest Pool: next “magnet” area—look for sweeps/rejections there.
🧩Step-by-step trading flow (with mindset)
⏩ Set bias: HH/HL = long bias, LH/LL = short bias. Counter-trend only on clean sweeps with strong confirmation.
⏩ Find magnet: Check Nearest Pool (BSL/SSL). Focus attention there; it saves screen time.
⏩ Wait for event: Look for a sweep/grab label, or sharp rejection at pool/OB/imbalance. Avoid FOMO.
⏩ Add confluence: Stack 2–3 of these—imbalance box, OB, contextual pattern, supportive volume.
⏩Plan entry: Bullish: trigger above reversal candle high or take retest of FVG/OB. Stop below sweep wick/zone. Target at least 1:1.5–1:2.
Bearish: mirror above.
⏩Manage smartly: Take partials, move to breakeven or trail thoughtfully. Don’t drag stops inside zone out of emotion.
🎛️ Parameter tuning (to reduce human error)
⏩ swingLen: Smaller = faster but noisier; larger = cleaner but slower. Backtest first, then go live.
⏩ Tolerance (ATR or percent): ATR tolerance adapts to volatility (good for fast markets and lower TFs). Start around 0.15–0.30. In calm markets, try percent 0.05–0.15%.
⏩ minBarsGap: Start with 3–5 so equal highs/lows are truly equal—reduces false pools.
❌Common mistakes → ✅ Better habits
⏩Chasing every breakout → Wait for sweep/rejection, then confirm.
⏩Ignoring volume → Validate strength; cut size or skip on weak volume.
⏩Losing history of pools → If reviewing/backtesting, keep mitigated pools visible (dashed/faded).
⏩Over-tight tolerance/too small swingLen → Increases false signals; backtest to find balance.
📝 checklist (before entry)
⏩ Is there a nearby BSL/SSL and did a sweep/grab happen there?
⏩ Is there a close imbalance/OB that price can retest?
⏩ Do we have an effective pattern plus supportive volume?
⏩Is the stop beyond the wick/zone and RR ≥ 1:1.5?
•?((¯°·._.• 🎀 𝐻𝒶𝓅𝓅𝓎 𝒯𝓇𝒶𝒹𝒾𝓃𝑔 🎀 •._.·°¯((?•

True Order Block (OB) True Order Block (OB)
This script automatically detects and plots Order Blocks (OBs) based on the presence of Fair Value Gaps (FVGs).
Only Order Blocks are displayed on the chart.
🔎 How it works
The script looks for Fair Value Gaps (FVGs) according to a relaxed 3-candle definition.
Once an FVG is detected:
For a Bullish FVG → the last bearish candle before the gap is marked as the Bullish Order Block.
For a Bearish FVG → the last bullish candle before the gap is marked as the Bearish Order Block.
OBs are extended into the future until price either:
mitigates the zone (optional auto-removal), or
the number of live OBs exceeds the user’s maximum (FIFO cleanup).
⚙️ User settings
Draw Order Blocks (enable/disable plotting)
Minimum OB length (how far each zone extends initially)
Remove OB after violation (auto delete invalidated zones)
Max active OBs (limit on displayed zones for clarity)
Bullish/Bearish OB colors
✅ Key features
Fully automated OB detection
No clutter – only OBs are plotted (FVG logic hidden in the background)
Smart cleanup: mitigated zones are removed automatically
Customizable colors & limits
⚠️ Notes
This tool is designed for educational and analytical purposes only.
It does not generate trade signals.
Always combine with your own strategy, market context, and risk management.

SMC Pro - Smart Money Concepts🎯 SMC Pro - Complete Smart Money Concepts Trading System with Trade Alerts
The Most Comprehensive SMC/ICT Indicator Built for Real Traders
After extensive research into what retail and prop firm traders actually need, I've created SMC Pro - a complete Smart Money Concepts indicator that solves the biggest problems with existing SMC tools.
🚀 What Makes This Different:
✅ COMPLETE TRADE SETUP ALERTS - Not just structure breaks! Get full trade setups with:
* Entry, Stop Loss & Target Prices
* Risk/Reward Calculations
* 5-Point Confluence Scoring
* Visual Trade Labels on Chart
✅ INTELLIGENT FILTERING - No more chart spam:
* Minimum structure size filter (ATR-based)
* Minimum bars between signals
* Volume confirmation for order blocks
* Clean, actionable signals only
📊 Core Features:
1. Market Structure Analysis
* Break of Structure (BOS) with smart filtering
* Change of Character (CHoCH) detection
* Clear directional bias identification
* Prevents excessive signal clustering
2. Order Blocks
* Volume-confirmed institutional zones
* Automatic mitigation tracking
* Entry points for trade setups
3. Fair Value Gaps
* ATR-based size filtering
* Automatic fill detection
* Confluence factor for trades
4. Liquidity Zones
* Buy-side & Sell-side liquidity mapping
* Sweep detection with alerts
* Target zones for trades
5. Risk Management Integration
* Automatic R:R calculation
* Position sizing guidance
* Minimum R:R filtering (default 2:1)
🎯 5-Point Trade Confluence System:
1. Market structure alignment
2. Recent structure break (BOS/CHoCH)
3. Order block at current price
4. Fair value gap support
5. Liquidity target available
Minimum score of 3/5 required for trade alerts (adjustable)
⚙️ Smart Settings:
* Swing Length: 10 (default) - adjust for sensitivity
* Min Bars Between Signals: 20 - prevents clustering
* Min Structure Size: 1.0 ATR - filters noise
* Min Confluence Score: 3/5 - quality control
* Target R:R: 2:1 minimum - proper risk management
📱 Alert Types:
* 🎯 Trade Setup Alerts - Complete entry/exit plans
* ✅ Structure Breaks - BOS & CHoCH notifications
* 📊 Order Block Touch - Price at key zones
* 💧 Liquidity Sweeps - Stop hunts detected
💡 Pro Tips:
* Start with default settings
* Use on 15m+ timeframes for cleaner signals
* Increase confluence requirement for prop firm trading
* Enable volume confirmation for higher quality OBs
* Dashboard shows real-time setup status
🔧 If You Get Too Many Signals:
* Increase Swing Length to 15-20
* Increase Min Bars Between to 30-50
* Increase Min Structure Size to 1.5 ATR
* Raise Min Confluence Score to 4 or 5
This indicator is the result of solving real problems traders face with SMC/ICT concepts. It's designed to give you clean, actionable trade setups - not just mark up your chart with zones.
Built with Pine Script v6 for maximum performance and reliability.
Trade with confluence. Trade with confidence. Trade smart. 🎯

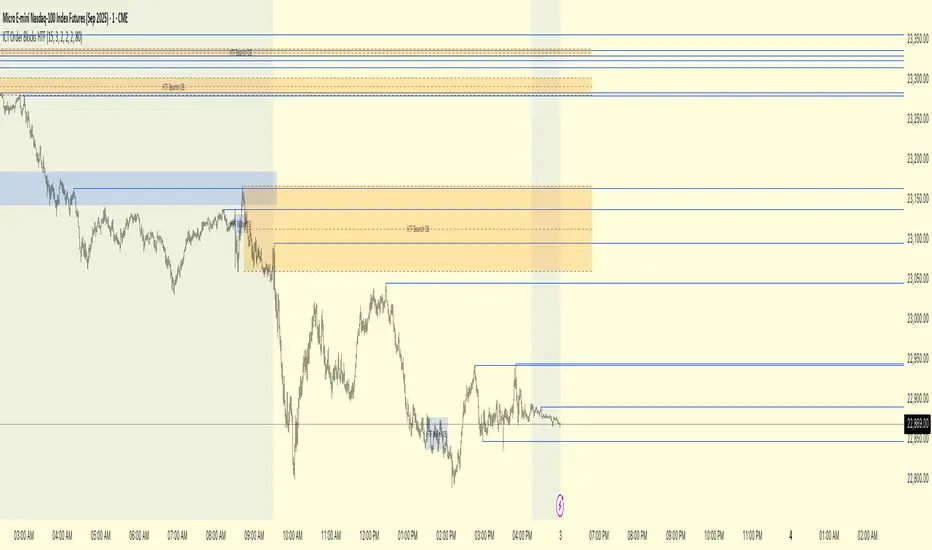
ICT Order Blocks HTFICT Order Blocks HTF (with Parent Swing Confirmation)
This indicator is a powerful tool designed to identify high-probability Higher-Timeframe (HTF) Order Blocks by confirming them with significant liquidity sweeps on your trading chart. It combines two core ICT (Inner Circle Trader) concepts to filter out noise and highlight only the most sensitive areas.
The Core Concept: A High-Probability Model
The most powerful trading setups often occur when a significant event on a lower timeframe happens at a key area on a higher timeframe. This indicator automates that analysis by looking for a specific confluence:
A Liquidity Sweep (LTF): First, it identifies a "Parent Swing" on your current chart. This is a significant swing high (BSL - Buy Side Liquidity) or swing low (SSL - Sell Side Liquidity) that has been validated by a market structure shift. These are the key liquidity pools the market targets.
An Order Block (HTF): Separately, it looks at a higher timeframe of your choice (e.g., 15m, 1H) to find institutional order blocks—the last up or down candle before a strong move.
The Confluence: The magic happens here. The indicator will only draw an HTF order block on your chart if it forms at the exact moment the price is interacting with one of the BSL or SSL liquidity pools from your current chart.
This dual confirmation provides a refined, high-probability signal, indicating that a major liquidity event is fueling a reaction from a significant HTF level.
What the Indicator Does
Identifies Parent Swings: In the background, it constantly tracks and identifies BSL (red lines) and SSL (green lines) on your chart.
Finds HTF Order Blocks: It looks for bullish (last down-candle) and bearish (last up-candle) order blocks on the higher timeframe you select.
Draws Confirmed Zones: It draws a Bullish OB (Blue Box) only when an HTF bullish order block forms at an SSL level. It draws a Bearish OB (Orange Box) only when an HTF bearish order block forms at a BSL level.
Marks Key Levels: Each order block is automatically drawn with dashed lines marking its high, low, and midpoint (50% level) for precise entry and risk management.
Real-Time Invalidation: The order blocks extend into the future and are tracked in real-time. If price closes through a block a specified number of times, the zone is considered invalid and will be dimmed, keeping your chart clean.
How to Use This Indicator
The primary use for this indicator is to identify high-probability entry zones.
When a Bullish Order Block (Blue) appears, it signals a potential area of demand where you might look for long entries.
When a Bearish Order Block (Orange) appears, it signals a potential area of supply where you might look for short entries.
The internal lines (high, low, midpoint) can be used for more precise entries or for setting stop-loss levels.
Settings
Higher Timeframe for Order Blocks: Choose the HTF you want the indicator to analyze for order blocks (e.g., 15m, 1H, 4H).
OB Invalidation Threshold: Set how many times price must close fully through an order block before it is considered invalid.
Parent Swing Settings: You can adjust the lookback periods and invalidation threshold for the BSL/SSL detection to match your trading style. A larger lookback will find more significant liquidity pools.
Disclaimer: This indicator is a tool to assist in technical analysis. It is not a standalone trading system and does not provide financial advice. Always use proper risk management and combine this tool with your own analysis and trading strategy.
ICT Sensitive Key Levels [Mariinus]Indicator Overview – Inspired by ICT Concepts
This indicator is inspired by the teachings of Inner Circle Trader (ICT), whose philosophies and principles have greatly shaped the way I view price action. One of the most powerful lessons that stuck with me is his quote:
"All you need is OHLC."
Another fundamental concept that underpins this tool is the idea that:
"Price is constantly moving in cycles from Premium or Discount to Equilibrium, from Equilibrium to Discount to Premium."
With these core ideas in mind, this indicator was developed to help traders who are already using an ICT-based framework. In addition to plotting the standard OHLC levels, the ICT Sensitive Key Levels indicator also includes derived levels that provide deeper Market insight. These include the Equilibrium of the full candle range (High to Low) as well as the Equilibrium of the wicks – offering a more nuanced view of price balance and potential turning points, in line with ICT’s core concepts.
⚠️ Important Disclaimer:
This is not a standalone trading plan.
This is not a buy or sell signal generator.
Instead, this tool is designed to support traders who follow ICT principles by helping them identify higher-probability PD Arrays – the key zones where setups are more likely to occur. If your trading plan includes looking for specific PD Arrays and structural frameworks taught by ICT, then this indicator is a visual aid to refine and focus your attention on the areas where your framework has a higher probability of playing out.
🔁 Backtesting & Daily Preparation
In addition to improving your real-time analysis, this indicator is also a valuable tool for accelerated backtesting . Rather than manually drawing out levels, the indicator automatically provides them, allowing you to analyze past price action faster and more efficiently .
It’s also ideal for preparing your trading day . By loading the indicator before the session starts, you get a clear visual of key levels that may play a role in your strategy. And if you find the chart too cluttered with lines, simply copy the ones that matter to you, draw them manually, and then turn the indicator off to keep your chart clean while keeping your zones intact.
⚙️ Explanation of the Settings
You can combine up to 4 timeframes to monitor their respective levels while operating on a lower timeframe. For each timeframe, you can:
• Set a lookback period to control how far back you want to calculate levels.
• Choose to display or hide the levels of the current candle , which helps you monitor intra-candle ebbs and flows.
Each level (e.g., High, Low, Open, Close, Equilibrium) can be customized:
• Color
• Line style
• Line width
• To hide a level , simply set its opacity to zero.
You can also enable dividers to clearly mark the start and end of higher timeframe candles on your lower timeframe chart. These dividers are also fully customizable:
• Color
• Style
• Width
• And again, if you prefer a cleaner chart, you can set the opacity to zero to hide them completely.
This setup gives you full control over how much or how little visual data you want to see, aligning the tool with your personal trading workflow.
💡 Example Use Cases
These examples are for educational purposes only. This tool is not financial advice and should always be used in conjunction with your own trading plan—whether it involves Fair Value Gaps, Order Blocks, or a custom combination of ICT-based elements.
• Example 1: A 1H Bearish Fair Value Gap overlapping with the Equilibrium Key Level of the Previous Day's Range – a high-probability zone for reaction.
• Example 2: A 1H Bullish Fair Value Gap in Discount, overlapping with the Equilibrium of Two Days Ago, followed by a move into a 1H Bearish Order Block that coincides with the Previous Day’s Equilibrium.
• Example 3: The same 1H PD Arrays viewed from a 4H chart, alongside Weekly Price Levels – giving you a higher timeframe context that supports or invalidates lower timeframe setups.
• Example 4: A combination of two timeframes for added context. A 4H Bullish Fair Value Gap is nested inside the current Weekly Equilibrium Key Level . On the 15M chart , we observe a reaction that creates an Inversion Fair Value Gap , which aligns with the Equilibrium Key Level of the previous 4H candle .
This indicator doesn’t replace your trading plan—it enhances your ability to execute it. It’s a precision tool made for ICT traders who understand context, structure, and probability.

IDKFAIDKFA - Advanced Order Blocks & Volume Profile with Market Structure Analysis
Why IDKFA?
Named after the legendary DOOM cheat code that gives players "all weapons and full ammo," IDKFA provides traders with a comprehensive arsenal of market analysis tools. Just as the cheat code arms players with everything needed for combat, this indicator equips traders with essential market structure tools: Order Blocks, Volume Profile, LVN/HVN areas, Fibonacci retracements, and intelligent buy/sell signals - all in one unified system.
Core Features
Order Blocks Detection
Automatically identifies institutional order blocks using pivot high/low analysis
Extends blocks dynamically until price interaction occurs
Bullish blocks (demand zones) and bearish blocks (supply zones)
Customizable opacity and extend functionality
Advanced Volume Profile
Real-time volume profile calculation for multiple session types
Point of Control (POC), Value Area High (VAH), and Value Area Low (VAL)
Mode 1: Side-by-side bull/bear volume display
Mode 2: Overlapped volume display with percentage analysis
Shows buying vs selling pressure at each price level
LVN/HVN Area Detection
Low Volume Nodes (LVN): Areas below VAL where price moves quickly
High Volume Nodes (HVN): Areas above VAH with strong resistance
NPOC (Naked Point of Control): Single print areas within Value Area
Volume-based gradient coloring shows relative activity levels
Smart Fibonacci Retracements
Auto-detects trend direction for proper fibonacci orientation
Dynamic color coding: Red levels in uptrends, Gold in downtrends
Special 88.6% level turns lime green in downtrends
Key levels: 23.6%, 38.2%, 50%, 61.8%, 65%, 78.6%, 88.6%
Intelligent Signal System
Works best on higher timeframes
Identifies high-probability reversal setups at key levels
Buy signals: Large bearish rejection followed by bullish reclaim
Sell signals: Large bullish rejection followed by bearish breakdown
Signals only trigger near significant support/resistance areas
Signal Analysis & Usage Guidelines
Buy Signal Mechanics
The buy signal triggers when:
Previous candle shows significant bearish movement (minimum ATR multiplier)
Current candle reclaims a configurable percentage of the previous candle's range
Price is near a key support level (order blocks, fibonacci, volume levels)
Sell Signal Mechanics
The sell signal triggers when:
Previous candle shows significant bullish movement (minimum ATR multiplier)
Current candle rejects below a configurable percentage of the previous candle's range
Price is near a key resistance level (order blocks, fibonacci, volume levels)
When to TAKE Signals
High Probability Buy Signals:
Signal appears AT or BELOW the VAL (Value Area Low)
Signal occurs at bullish order block confluence
Price is in LVN area below VAL (momentum acceleration zone)
Signal aligns with fibonacci 61.8% or 78.6% support
Multiple session POC levels provide support confluence
Previous session's VAL acting as current support
High Probability Sell Signals:
Signal appears AT or ABOVE the VAH (Value Area High)
Signal occurs at bearish order block confluence
Price is in HVN area above VAH (heavy resistance zone)
Signal aligns with fibonacci 61.8% or 78.6% resistance
Multiple session POC levels provide resistance confluence
Previous session's VAH acting as current resistance
When to AVOID Signals
Avoid Buy Signals When:
Signal appears ABOVE the VAH (buying into resistance)
Price is in HVN red zones (high volume resistance areas)
No clear support structure below current price
Volume profile shows heavy selling pressure (high bear percentages)
Signal occurs during low-volume periods between major sessions
Multiple bearish order blocks exist below current price
Avoid Sell Signals When:
Signal appears BELOW the VAL (selling into support)
Price is in LVN green zones (momentum could continue)
No clear resistance structure above current price
Volume profile shows heavy buying pressure (high bull percentages)
Signal occurs during Asian session ranges without clear direction
Multiple bullish order blocks exist above current price
Volume Profile Context for Signals
Understanding Bull/Bear Percentages:
70%+ Bull dominance at a level = Strong support expected
70%+ Bear dominance at a level = Strong resistance expected
50/50 Split = Neutral zone, less predictable
Use percentages to gauge conviction behind moves
POC (Point of Control) Interactions:
Signals above POC in uptrend = Higher probability
Signals below POC in downtrend = Higher probability
Signals against POC bias require extra confirmation
POC often acts as magnetic level for price return
Trading Strategies
Strategy 1: VAL/VAH Bounce Strategy
Wait for price to approach VAL (support) or VAH (resistance)
Look for signal confirmation at these critical levels
Enter with tight stops beyond the Value Area
Target opposite boundary or next session's levels
Strategy 2: Order Block + Volume Confluence
Identify order block alignment with VAL/VAH
Wait for signal within the confluence zone
Enter on signal with stop beyond order block
Use LVN areas as acceleration zones for targets
Strategy 3: LVN/HVN Strategy
LVN (Green) Areas: "Go Zones" - expect quick price movement through low volume
HVN (Red) Areas: "Stop Zones" - expect resistance and potential reversals
NPOC Areas: "Fill Zones" - price often returns to fill single print gaps
Strategy 4: Multi-Session Analysis
Use Daily/Weekly for major structure context
Use 4H for intermediate levels
Use 1H for precise entry timing
Ensure all timeframes align before taking signals
Strategy 5: Fibonacci + Volume Profile
Buy signals at 61.8% or 78.6% fibonacci near VAL
Sell signals at 61.8% or 78.6% fibonacci near VAH
Use 88.6% level as final support/resistance before major moves
50% level often aligns with POC for confluence
Signal Quality Assessment
Grade A Signals (Highest Probability):
Signal at VAL/VAH with order block confluence
Fibonacci level alignment (61.8%, 78.6%)
Volume profile shows 70%+ dominance in signal direction
Multiple timeframe structure alignment
Signal occurs during high-volume sessions (London/NY)
Grade B Signals (Moderate Probability):
Signal near POC with some confluence
Fibonacci 50% or 38.2% alignment
Mixed volume profile readings (50-70% dominance)
Some timeframe alignment present
Signal during overlap sessions
Grade C Signals (Lower Probability):
Signal with minimal confluence
Weak fibonacci alignment or none
Volume profile neutral or against signal
Conflicting timeframe signals
Signal during low-volume periods
Risk Management Guidelines
Position Sizing Based on Signal Quality:
Grade A: Standard position size
Grade B: Reduced position size (50-75%)
Grade C: Minimal position size (25%) or skip entirely
Stop Loss Placement:
Beyond order block boundaries
Outside Value Area (VAL/VAH)
Below/above fibonacci confluence levels
Account for session volatility ranges
Profit Targets:
First target: Opposite VAL/VAH boundary
Second target: Next session's key levels
Final target: Major order blocks or fibonacci extensions
Credits & Attribution
Original components derived from:
Market Sessions & Volume Profile by © Leviathan (Mozilla Public License 2.0)
Volume Profile elements inspired by @LonesomeTheBlue's volume profile script
Pivot Order Blocks by TradingWolf / © MensaTrader (Mozilla Public License 2.0)
Auto Fibonacci Retracement code (public domain)
Significant enhancements and modifications include:
Advanced LVN/HVN detection and visualization
Bull/Bear percentage analysis for Mode 2/3
Comprehensive alert system with market context
Integrated buy/sell signals at key levels
Performance optimizations and extended session support
Enhanced Mode 2/3 with percentage pressure analysis
Important Disclaimers
This indicator is a technical analysis tool designed for educational purposes. It does not provide financial advice, investment recommendations, or trading signals that guarantee profits. All trading involves substantial risk of loss, and past performance does not guarantee future results. Users should conduct their own research, understand the risks involved, and consider consulting with qualified financial advisors before making trading decisions. The signals and analysis provided are based on historical price patterns and volume data, which may not predict future market movements accurately.
Best Practices
Never trade signals blindly - always consider volume profile context
Wait for confluence between multiple tools before entering
Respect the Value Area - avoid buying above VAH or selling below VAL
Use session context - Asian ranges vs London/NY breakouts
Practice proper risk management - position size based on signal quality
Understand the bigger picture - use multiple timeframes for context
Remember: Like the IDKFA cheat code, having all the tools doesn't guarantee success. The key is learning to use them together effectively and understanding when NOT to take a signal is often more important than knowing when to take one.

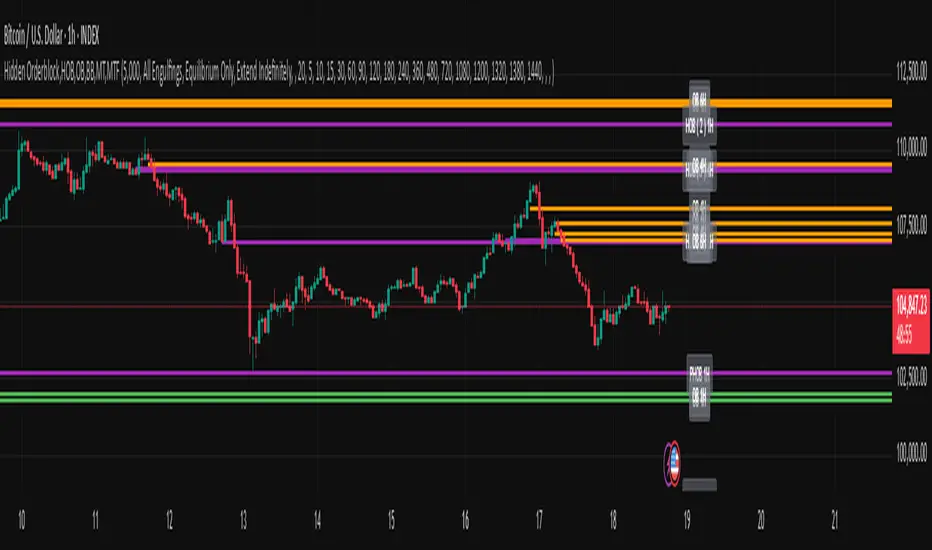
Hidden Orderblock,HOB,OB,BB,MT,MTF Hidden Order Block & Breaker Block (HOB/BB) Multi-Timeframe Analysis
A powerful tool for Smart Money traders and ICT-style practitioners seeking precision, confluence, and clean visual execution. This indicator identifies institutional price zones such as Hidden Order Blocks (HOB), Breaker Blocks (BB), Partial Hidden Order Blocks (PHOB), and traditional Order Blocks (OB)—all across multiple timeframes with minimal chart clutter.
✅ Key Features
1. Hidden Order Block (HOB) Detection
Identifies non-obvious order blocks often hidden within price action.
Requires the EQ (Equilibrium) of the block to pass through at least one Fair Value Gap (FVG).
Invalidation Rule: If price touches the EQ and then closes beyond it (depending on structure), the HOB is invalidated.
2. Breaker Block (BB) Detection
Highlights zones where price made a liquidity grab followed by a strong reversal.
Useful for anticipating support/resistance flips and high-probability reaction areas.
3. Partial Hidden Order Block (PHOB) Detection
A variation of HOBs where price only partially touches the EQ.
Often acts as an early warning zone for reversals or continuation.
Less strict than HOBs, but still institutionally relevant.
4. Traditional Order Block (OB) Detection
Identifies bullish/bearish OBs based on engulfing patterns and displacement.
Marks only the body of the engulfing candle, with the EQ line acting as a key validation/invalidation level.
Once the EQ is touched, the OB is considered invalidated.
5. Engulfing Filter Engine
Customizable logic for OB qualification.
“Easy Engulfing Mode” simplifies detection for newer traders or faster workflow.
Fine-tune aggressiveness and visual clarity with user-defined settings.
6. Multi-Timeframe (MTF) Visualization
Overlay OBs, HOBs, BBs, and PHOBs from higher timeframes (e.g., 4H, 1D) on lower timeframes (15m, 1H).
Enhances top-down confluence without switching charts.
Keeps the visual experience clean and intuitive.
7. Minimalist Visual Design
Only the zone boundaries and EQ lines are displayed.
No extra noise—perfect for both scalpers and swing traders.
Dynamic label positioning and styling for improved chart aesthetics.
8. Performance-Optimized Code
Lightweight, real-time rendering.
Designed for responsiveness—even on lower timeframes with dense historical data.
⚙️ How It Works (Simplified Logic)
Order Block Detection:
Scans for engulfing candles that show displacement.
Defines the OB as the body of the engulfing candle.
EQ line is marked and projected forward until invalidated.
Hidden Order Block Logic:
Starts from a traditional OB, but requires the EQ to pass through at least one FVG.
Upon a close beyond the EQ in the opposite direction, the HOB is invalidated.
PHOB Logic:
Similar to HOBs, but allows partial touches of the EQ before reacting.
Breaker Block Logic:
Identifies liquidity sweeps followed by impulsive moves.
Marks these zones as BBs for potential reaction areas.
📈 Use Cases
Detect institutional price zones with high precision.
Simplify decision-making with visual EQs and MTF overlays.
Integrate seamlessly into:
Smart Money Concepts (SMC)
ICT-style trading
Wyckoff methodology
Discretionary zone-to-zone strategies
🧠 Definitions Summary
OB (Order Block):
Engulfed candle body; EQ is the midpoint of the body. Invalid once EQ is touched.
HOB (Hidden Order Block):
Like OB, but EQ must pass through at least one FVG.
Invalidated when a candle touches EQ and closes beyond it.
PHOB (Partial Hidden Order Block):
Like HOB, but allows partial touch of the EQ to remain valid.
MarketMastery Suite by DGTAll-in-One Trading Framework for Price Action, Smart Money, and Market Structure
Unlock a complete, institutional-grade toolkit built for modern traders. The MarketMastery Suite blends advanced price action logic, multi-timeframe structure detection, capital flow analytics, and liquidation-based risk tools — empowering you to decode market behavior with confidence.
Whether you're identifying smart money zones, anticipating structural shifts, or managing position risk, MarketMastery Suite delivers actionable and adaptive insights.
KEY FEATURES
---------------------------------------------------------------------------------------------------------------
⯌ Dynamic Support & Resistance Zones
Automatically detects major Support and Resistance zones based on adaptive logic derived from ICT-style OBs and BBs. Rather than using fixed lookbacks, the script applies swing-based detection to reveal significant levels across Local, Regional, Global, and Macro structures — pinpointing areas of likely institutional interest.
⯌ Trend Stop & Range Detection
Tracks market bias with a smart 3-tier trailing stop that filters noise and identifies potential breakouts, traps, or directional flips — even in ranging conditions.
⯌ Fractal Market Structure & Shift Detection
Detects real-time Break of Structure (BoS) and Change of Character (CHoCH) events across fractal structure levels — Local to Macro — helping confirm or anticipate market shifts.
⯌ Volume & Capital Flow Analysis
Highlights volume spikes and overlays Cumulative Volume Delta (CVD) and Open Interest (OI) to uncover buyer/seller intent and momentum pressure shifts.
⯌ Trend Snapshot Dashboard
A clean, mobile-friendly dashboard that shows live trend strength, directional flow (Price, OI, CVD), and key capital activity, anchored to the latest swing evaluation window.
⯌ Liquidation Risk Zones
Visualizes liquidation and margin thresholds based on leverage, entry price, and maintenance margin — essential for futures risk planning.
ALERT MESSAGES
---------------------------------------------------------------------------------------------------------------
Support & Resistance Events
"Rejection {count} at Support · Support ≈ {value}"
"Support Retest {count} After Break · Support ≈ {value}"
"Rejection {count} at Resistance · Resistance ≈ {value}"
"Resistance Retest {count} After Break · Resistance ≈ {value}"
Support & Resistance Transitions
"Support Broken · {value} → Becomes Resistance"
"Resistance Broken · {value} → Becomes Support"
Market Structure Alerts
"{fractal depth} {Bullish|Bearish} Break of Structure detected."
"{fractal depth} {Bullish|Bearish} Change of Character detected."
Bias Transitions
"{Bullish|Bearish} Bias — Trailing stop flipped {upward|downward} {volume activity}"
"Potential {Bullish|Bearish} Flip — Early signs of {upward|downward} pressure {volume activity}"
"Ranging or Transitioning — Market lacks a clear trend {volume activity}"
Volume Spike
"Extreme volume spike detected!"
DISCLAIMER
---------------------------------------------------------------------------------------------------------------
This script is intended for informational and educational purposes only. It does not constitute financial, investment, or trading advice. All trading decisions made based on its output are solely the responsibility of the user.
Script de pago

CANX Supply and Demand - Order Block - Candle Identification© CanxStixTrader
CANX Supply and Demand - Order Block - Candle Identification
Description
Designed as a visual aid, to highlight the last up or down candle before a fractal break. We can assume these candles where the point of origin that generated enough strength to break recent structure. By using them as reference points, traders are expected to follow their own set of rules and mark higher probability supply and demand zones in the area.
How to use:
Expect price to retest in these areas, and if they fail, a potential retest in the opposite direction . The greater the number of times a zone is tested, the more likely it is to break. A fresh zone that has not yet been tested will have a higher probability of a bounce.
Fractal period and candle break type can be customized in the settings. This works on all time frames.
**The indicator is set to my optimal settings for the 5 minute or 15 minute time frame** Please mess around to find your comfort zone and back test the results.
The lower the period number the more noise this creates on the market. The higher the number the less noise and more potential for a stronger zone.
Keep it simple
Order Block with BoSHere’s a professional and concise description you can use for publishing your **TradingView script** titled **"Order Block with BoS"**:
---
### 📌 **Description for TradingView Publication:**
**"Order Block with Break of Structure (BoS)"** is a powerful price action-based indicator designed to identify potential reversal zones and momentum shifts using **Order Block** detection combined with **Break of Structure (BoS)** confirmation.
### 🔍 **Key Features:**
* **Order Block Detection**: Highlights bullish and bearish order blocks using precise candle structure logic.
* **Break of Structure (BoS)**: Confirms structural breaks above swing highs or below swing lows to validate potential trend continuation or reversal.
* **Dynamic ATR Filter**: Uses a 14-period ATR with dynamic thresholds to confirm significant moves, filtering out weak breakouts.
* **Visual Aids**:
* Color-coded **boxes** to mark detected Order Blocks.
* **Arrows** at BoS confirmation points when ATR confirms strong momentum.
* Optional **dashed BoS lines** to show where price broke structure.
### ⚙️ **Customizable Inputs**:
* `Swing Length`: Defines the sensitivity of swing high/low detection.
* `Show Break of Structure`: Toggle on/off BoS confirmation lines.
* `Candle Lookback`: Number of historical candles to consider.
This indicator is ideal for traders who incorporate **smart money concepts**, **market structure analysis**, or **institutional order flow** strategies.
---
Would you like me to help write the **strategy** version of this or translate the description into another language for international audiences?

Order Block Matrix [Alpha Extract]The Order Block Matrix indicator identifies and visualizes key supply and demand zones on your chart, helping traders recognize potential reversal points and high-probability trading setups.
This tool helps traders:
Visualize key order blocks with volume profile histograms showing liquidity distribution.
Identify high-volume price levels where institutional activity occurs.
rank historical order blocks and analyze their strength based on volume.
Receive alerts for potential trading opportunities based on price-block interactions.
🔶 CALCULATION
The indicator processes chart data to identify and analyze order blocks:
Order Block Detection
Inputs:
Price action patterns (consolidation areas followed by breakouts).
Volume data from current and lower timeframes.
User-defined lookback periods and thresholds.
Detection Logic:
Identifies consolidation areas using a dynamic range comparison.
Confirms breakout patterns with percentage threshold validation.
Maps volume distribution across price levels within each order block.
🔶Volume Analysis
Volume Profiling:
Divides each order block into configurable grid segments.
Maps volume distribution across price segments within blocks.
Highlights zones with highest volume concentration.
Strength Assessment:
Calculates total block volume and relative strength metrics.
Compares block volume to historical averages.
Determines probability of reversal based on volume patterns.
isConsolidation(len) =>
high_range = ta.highest(high, len) - ta.lowest(high, len)
low_range = ta.highest(low, len) - ta.lowest(low, len)
avg_range = (high_range + low_range) / 2
current_range = high - low
current_range <= avg_range * (1 + obThreshold)
🔶 DETAILS
Visual Features
Volume Profile Histograms:
Color-coded bars showing volume concentration within order blocks.
Gradient coloring based on relative volume (high volume = brighter colors).
Bull blocks (green/teal) and bear blocks (red) with varying opacity.
Block Visualization:
Dynamic box sizing based on volume concentration.
Optional block borders and background fills.
Volume labels showing total block volume.
Screener Table:
Real-time analysis of order block metrics.
Shows block direction, proximity, retest count, and volume metrics.
Color-coded for quick reference.
Interpretation
High Volume Areas: Zones with institutional interest and potential reversal points.
Block Direction: Bullish blocks typically support price, bearish blocks typically resist price.
Retests: Multiple tests of an order block may strengthen or weaken its influence.
Block Age: Newer blocks often have stronger influence than older ones.
Volume Concentration: Brightest segments within blocks represent the highest volume areas.
🔶 EXAMPLES
The indicator helps identify key trading opportunities:
Bullish Order Blocks
Support Zones: Identify strong support levels where price is likely to bounce.
Breakout Confirmation: Validate breakouts with volume analysis to avoid false moves.
Retest Strategies: Enter trades when price retests a bullish order block with high volume.
Bearish Order Blocks
Resistance Zones: Identify strong resistance levels where price is likely to reverse.
Distribution Areas: Detect zones where smart money is distributing to retail.
Short Opportunities: Find optimal short entry points at high-volume bearish blocks.
Combined Strategies
Order Block Stacking: Multiple aligned blocks create stronger support/resistance zones.
Block Mitigation: When price breaks through a block, it often indicates a strong trend continuation.
Volume Profile Applications: Higher volume segments provide more precise entry and exit points.
🔶 SETTINGS
Customization Options
Order Block Detection:
Consolidation Lookback: Adjust the period for consolidation detection.
Breakout Threshold: Set minimum percentage for breakout confirmation.
Historical Lookback Limit: Control how far back to scan for historical order blocks.
Maximum Order Blocks: Limit the number of visible blocks on the chart.
Visual Style:
Grid Segments: Adjust the number of volume profile segments.
Extend Blocks to Right: Enable/disable extending blocks to current price.
Show Block Borders: Toggle border visibility.
Border Width: Adjust thickness of block borders.
Show Volume Text: Enable/disable volume labels.
Volume Text Position: Control placement of volume labels.
Color Settings:
Bullish High/Low Volume Colors: Customize appearance of bullish blocks.
Bearish High/Low Volume Colors: Customize appearance of bearish blocks.
Border Color: Set color for block outlines.
Background Fill: Adjust color and transparency of block backgrounds.
Volume Text Color: Customize label appearance.
Screener Table:
Show Screener Table: Toggle table visibility.
Table Position: Select positioning on the chart.
Table Size: Adjust display size.
The Order Block Matrix indicator provides traders with powerful insights into market structure, helping to identify key levels where smart money is active and where high-probability trading opportunities may exist.

Order Blocks [TakingProphets]The Order Blocks indicator automatically finds and highlights institutional Order Blocks (OBs) on your chart — powerful price zones where smart money has previously entered the market with large orders. These areas often act as strong support or resistance, and they’re key tools for traders using ICT (Inner Circle Trader) and Smart Money Concepts (SMC) strategies.
📘 What’s an Order Block?
An Order Block is usually the last bullish or bearish candle before a big move or shift in market structure. It represents where banks, funds, or institutions placed large buy or sell orders. Retail traders often miss these zones, but smart money traders use them to anticipate where price may return, stall, or even reverse.
This indicator identifies these zones for you — both bullish and bearish — so you don’t have to manually mark them.
🔍 How the Indicator Works
It waits for a market structure shift — when price breaks out of a recent high or low range.
Then it looks back to find the last opposite candle before that breakout — that candle becomes the OB.
It draws a box from the open of that candle to the high/low (depending on type) and keeps updating the box forward.
You can choose how strict the OBs need to be (Small, Medium, or Large) using ATR-based size filtering.
🔄 Breaker Blocks (Optional Feature)
If price closes through an Order Block in the opposite direction, that OB is considered invalid. But instead of deleting it, the indicator can automatically draw a Breaker Block. Breakers are important because they often become new support or resistance zones — a sign the market has flipped direction and is now respecting that level in a new way.
🎛 Custom Settings
Choose OB detection sensitivity: High (shows smaller moves), Medium, or Low (only the biggest institutional moves).
Customize colors and whether you want to show borders on each block.
Turn Breaker Blocks on or off based on your strategy.
Everything is dynamic and updates live as price evolves.
💡 Why Use It?
Knowing where smart money entered the market gives you a huge edge. Price often returns to these Order Blocks to "rebalance" or fill unfilled orders. With this indicator, you’ll:
Spend less time marking charts.
Spot high-probability entry zones faster.
Avoid common retail traps and trade with the algorithm.

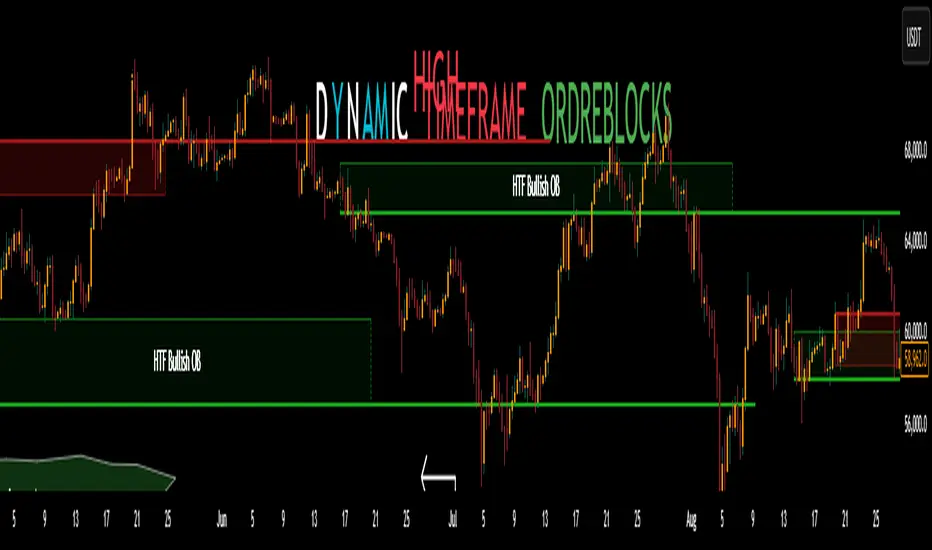
CoffeeShopCrypto High Timeframe Dynamic Order BlocksThis indicator automates the detection of significant order blocks in real time, from higher timeframes (Daily, Weekly, Monthly) and dynamically adapts their zone boundaries to your current chart timeframe regardless of what you change it to. By analyzing market structure across multiple time horizons, it identifies institutional-level supply/demand zones and precisely recalculates their parameters to match your active chart's resolution - whether you're viewing 1-minute or 4-hour candles or even higher.
Key Technical Features:
Multi-Timeframe Analysis: Scans daily/weekly/monthly data to identify the most significant order blocks that influence all lower timeframes
Adaptive Zone Calculation: Automatically recalculates zone boundaries when you change timeframes, maintaining accurate price levels and candle formations specific to your chart
Smart Price Action Filtering: Isolates only the relevant candles that formed each order block within your current timeframe's context
Structural Precision: Adjusts zone width and position based on the actual candle wicks/bodies that created the order block in your active timeframe.
What they look like when calculated instantly.
About Order Blocks (Market Structure Perspective):
Order blocks represent concentrated areas where institutional traders executed significant positions, creating imbalances in market structure.
These zones become:
Bullish Order Blocks: Demand areas where aggressive buying overwhelmed sellers, often appearing as consolidation before strong upward movements.
Bearish Order Blocks: Supply zones where distribution activity preceded substantial downward moves.
How It Works Differently:
The indicator identifies these critical areas by analyzing the relationship between consecutive candles' opens, highs, lows, and closes - particularly focusing on break-of-structure patterns that confirm zone validity.
Traditional order block indicators simply copy higher timeframe zones to lower charts. These common orderblocks are said be found as the candle before the candle that caused a huge market swing. In a break long, you would look backwards to find the first previous bearish candle. The opposite find would be for a break short.
This is a most unreliable method in finding orderblocks and simply is not true.
Zone Extensions. Choose how far into the future you want your zone to go to. There is no wrong number but you don't want to go too far.
This scripts performs true multi-timeframe analysis by:
Detecting the original order block formation conditions on HTFs
Drilling down to find the exact "candle sequence" that created the zone in your current timeframe.
Continuously monitoring for structural breaks that invalidate zones
Automatically adjusting all visual elements when you switch timeframes
Usage Benefits:
Eliminates manual timeframe switching to identify significant zones
Maintains visual consistency when changing chart resolutions
Provides cleaner charts by only showing relevant order blocks
Adapts to any market (Forex, Stocks, Crypto) and any timeframe combination
Breached Zones. The zone becomes invalidated but the Supply or Demand line is still relevant.
Note on Trading:
While this indicator precisely identifies order block locations, trading methodologies using these zones depend on individual strategy preferences. The tool focuses exclusively on accurate technical detection and adaptive visualization across timeframes.
How to Use Them:
As long as you don't have price action breach of a Bullish Zone Demand Floor you can keep using that zone as a bullish orderblock until its Demand Floor has been breached.
This also means you can still use its Demand Floor as a support level while the Zone itself is no longer relevant. This eliminates the orderblock ZONE as being an orderblock and now you only have a supply floor left to use as support.
As long as you don't have price action breach of a Bearish Zone Supply Wall you can keep using that zone as a bearish orderblock until its Supply Wall has been breached.
This also means you can still use its Supply Wall as a resistance level while the Zone itself is no longer relevant. This eliminates the orderblock ZONE as being an orderblock and now you only have a resistance level.
Once either has been breached, you would find liquidity behind the zone of the ordreblock. This is where price will seek support or resistance depending on the zone type.
Orderblocks has a BODY and who knew they could be so cute. I mean look at this structure.
This is how they are built and what their levels represent.
Smarter Money Concepts - OBs [PhenLabs]📊 Smarter Money Concepts - OBs
Version: PineScript™ v6
📌 Description
Smarter Money Concepts - OBs (Order Blocks) is an advanced technical analysis tool designed to identify and visualize institutional order zones on your charts. Order blocks represent significant areas of liquidity where smart money has entered positions before major moves. By tracking these zones, traders can anticipate potential reversals, continuations, and key reaction points in price action.
This indicator incorporates volume filtering technology to identify only the most significant order blocks, eliminating low-quality signals and focusing on areas where institutional participation is likely present. The combination of price structure analysis and volume confirmation provides traders with high-probability zones that may attract future price action for tests, rejections, or breakouts.
🚀 Points of Innovation
Volume-Filtered Block Detection : Identifies only order blocks formed with significant volume, focusing on areas with institutional participation
Advanced Break of Structure Logic : Uses sophisticated price action analysis to detect legitimate market structure breaks preceding order blocks
Dynamic Block Management : Intelligently tracks, extends, and removes order blocks based on price interaction and time-based expiration
Structure Recognition System : Employs technical analysis algorithms to find significant swing points for accurate order block identification
Dual Directional Tracking : Simultaneously monitors both bullish and bearish order blocks for comprehensive market structure analysis
🔧 Core Components
Order Block Detection : Identifies institutional entry zones by analyzing price action before significant breaks of structure, capturing where smart money has likely positioned before moves.
Volume Filtering Algorithm : Calculates relative volume compared to a moving average to qualify only order blocks formed with significant market participation, eliminating noise.
Structure Break Recognition : Uses price action analysis to detect legitimate breaks of market structure, ensuring order blocks are identified only at significant market turning points.
Dynamic Block Management : Continuously monitors price interaction with existing blocks, extending, maintaining, or removing them based on current market behavior.
🔥 Key Features
Volume-Based Filtering : Filter out insignificant blocks by requiring a minimum volume threshold, focusing only on zones with likely institutional activity
Visual Block Highlighting : Color-coded boxes clearly mark bullish and bearish order blocks with customizable appearance
Flexible Mitigation Options : Choose between “Wick” or “Close” methods for determining when a block has been tested or mitigated
Scan Range Adjustment : Customize how far back the indicator looks for structure points to adapt to different market conditions and timeframes
Break Source Selection : Configure which price component (close, open, high, low) is used to determine structure breaks for precise block identification
🎨 Visualization
Bullish Order Blocks : Blue-colored rectangles highlighting zones where bullish institutional orders were likely placed before upward moves, representing potential support areas.
Bearish Order Blocks : Red-colored rectangles highlighting zones where bearish institutional orders were likely placed before downward moves, representing potential resistance areas.
Block Extension : Order blocks extend to the right of the chart, providing clear visualization of these significant zones as price continues to develop.
📖 Usage Guidelines
Order Block Settings
Scan Range : Default: 25. Defines how many bars the indicator scans to determine significant structure points for order block identification.
Bull Break Price Source : Default: Close. Determines which price component is used to detect bullish breaks of structure.
Bear Break Price Source : Default: Close. Determines which price component is used to detect bearish breaks of structure.
Visual Settings
Bullish Blocks Color : Default: Blue with 85% transparency. Controls the appearance of bullish order blocks.
Bearish Blocks Color : Default: Red with 85% transparency. Controls the appearance of bearish order blocks.
General Options
Block Mitigation Method : Default: Wick, Options: Wick, Close. Determines how block mitigation is calculated - “Wick” uses high/low values while “Close” uses close values for more conservative mitigation criteria.
Remove Filled Blocks : Default: Disabled. When enabled, order blocks are removed once they’ve been mitigated by price action.
Volume Filter
Volume Filter Enabled : Default: Enabled. When activated, only shows order blocks formed with significant volume relative to recent average.
Volume SMA Period : Default: 15, Range: 1-50. Number of periods used to calculate the average volume baseline.
Min. Volume Ratio : Default: 1.5, Range: 0.5-10.0. Minimum volume ratio compared to average required to display an order block; higher values filter out more blocks.
✅ Best Use Cases
Identifying high-probability support and resistance zones for trade entries and exits
Finding optimal stop-loss placement behind significant order blocks
Detecting potential reversal areas where price may react after extended moves
Confirming breakout trades when price clears major order blocks
Building a comprehensive market structure map for medium to long-term trading decisions
Pinpointing areas where smart money may have positioned before major market moves
⚠️ Limitations
Most effective on higher timeframes (1H and above) where institutional activity is more clearly defined
Can generate multiple signals in choppy market conditions, requiring additional filtering
Volume filtering relies on accurate volume data, which may be less reliable for some securities
Recent market structure changes may invalidate older order blocks not yet automatically removed
Block identification is based on historical price action and may not predict future behavior with certainty
💡 What Makes This Unique
Volume Intelligence : Unlike basic order block indicators, this script incorporates volume analysis to identify only the most significant institutional zones, focusing on quality over quantity.
Structural Precision : Uses sophisticated break of structure algorithms to identify true market turning points, going beyond simple price pattern recognition.
Dynamic Block Management : Implements automatic block tracking, extension, and cleanup to maintain a clean and relevant chart display without manual intervention.
Institutional Focus : Designed specifically to highlight areas where smart money has likely positioned, helping retail traders align with institutional perspectives rather than retail noise.
🔬 How It Works
1. Structure Identification Process :
The indicator continuously scans price action to identify significant swing points and structure levels within the specified range, establishing a foundation for order block recognition.
2. Break Detection :
When price breaks an established structure level (crossing below a significant low for bearish breaks or above a significant high for bullish breaks), the indicator marks this as a potential zone for order block formation.
3. Volume Qualification :
For each potential order block, the algorithm calculates the relative volume compared to the configured period average. Only blocks formed with volume exceeding the minimum ratio threshold are displayed.
4. Block Creation and Management :
Valid order blocks are created, tracked, and managed as price continues to develop. Blocks extend to the right of the chart until they are either mitigated by price action or expire after the designated timeframe.
5. Continuous Monitoring :
The indicator constantly evaluates price interaction with existing blocks, determining when blocks have been tested, mitigated, or invalidated, and updates the visual representation accordingly.
💡 Note:
Order Blocks represent areas where institutional traders have likely established positions and may defend these zones during future price visits. For optimal results, use this indicator in conjunction with other confluent factors such as key support/resistance levels, trendlines, or additional confirmation indicators. The most reliable signals typically occur on higher timeframes where institutional activity is most prominent. Start with the default settings and adjust parameters gradually to match your specific trading instrument and style.

RSI Support & Resistance Breakouts with OrderblocksThis tool is an overly simplified method of finding market squeeze and breakout completely based on a dynamic RSI calculation. It is designed to draw out areas of price levels where the market is pushing back against price action leaving behind instances of short term support and resistance levels you otherwise wouldn't see with the common RSI.
It uses the changes in market momentum to determine support and resistance levels in real time while offering price zone where order blocks exist in the short term.
In ranging markets we need to know a couple things.
1. External Zone - It's important to know where the highs and lows were left behind as they hold liquidity. Here you will have later price swings and more false breakouts.
2. Internal Zone - It's important to know where the highest and lowest closing values were so we can see the limitations of that squeeze. Here you will find the stronger cluster of orders often seen as orderblocks.
In this tool I've added a 200 period Smoothed Moving Average as a trend filter which causes the RSI calculation to change dynamically.
Regular Zones - without extending
The Zones draw out automatically but are often too small to work with.
To solve this problem, you can extend the zones into the future up to 40 bars.
This allows for more visibility against future price action.
--------------------------------------------
Two Types of Zones
External Zones - These zones give you positioning of the highest and lowest price traded within the ranging market. This is where liquidity will be swept and often is an ultimate breaking point for new price swings.
How to use them :
External Zones - External zones form at the top of a pullback. After this price should move back into its impulsive wave.
During the next corrective way, if price breaches the top of the previous External Zone, this is a sign of trend weakness. Expect a divergence and trend reversal.
Internal Zones - (OrderBlocks) Current price will move in relation to previous internal zones. The internal zone is where a majority of price action and trading took place. It's a stronger SQUEEZE area. Current price action will often have a hard time closing beyond the previous Internal Zones high or low. You can expect these zones to show you where the market will flip over. In these same internal zones you'll find large rejection candles.
**Important Note** Size Doesn't Matter
The size of the internal zone does not matter. It can be very small and still very powerful.
Once an internal zone has been hit a few times, its often not relevant any longer.
Order Block Zone Examples
In this image you can see the Internal Zone that was untouched had a STRONG price reaction later on.
Internal Zones that were touched multiple times had weak reactions later as price respected them less over time.
Zone Overlay Breakdown
The Zones form and update in real time until momentum has picked up and price begins to trend. However it leaves behind the elements of the inducement area and all the key levels you need to know about for future price action.
Resistance Fakeout : Later on after the zone has formed, price will return to this upper zone of price levels and cause fakeouts. A close above this zone implies the market moves long again.
Midline Equilibrium : This is simply the center of the strongest traded area. We can call this the Point of Control within the orderblock. If price expands through both extremes of this zone multiple times in the future, it eliminates the orderblock.
Support Fakeout : Just like its opposing brother, price will wick through this zone and rip back causing inducement to trap traders. You would need a clear close below this zone to be in a bearish trend.
BARCOLOR or Candle Color: (Optional)
Bars are colored under three conditions
Bullish Color = A confirmed bullish breakout of the range.
Bearish Color = A confirmed bearish breakout of the range.
Squeeze Color = Even if no box is formed a candle or candles can have a squeeze color. This means the ranging market happened within the high and low of that singular candle.

Order Block Indicator | DTDHello trader comuunity!
I'm uploading a basic script that I felt necessary to make to help me with some gaps in my day trading. I personally am a visual trader that benefits greatly from automating some the ideas I have in my head. There are awesome builders out there and me creating this script isn't a knock on what's currently available to us, but something I wanted to be able to manage. I am opening up what I've found extremely helpful to my own trading to the community.
Here we have a very simple ATR-based order block (OB) finder. It's not anything original, but I do find consistent opportunities when combined with other tools I use to measure the market. It takes into consideration the previous 25 candles to determine if the OB is significant enough to mark. I use the average of 25 because I simply like it. I use the 25 EMA as part of my "trending" templates and find it to be a hybrid timeframe of sorts. You can find macro and micro trade locations by switching timeframes.
The main elements of the script are:
1. ATR based tracking | A bullish OB is defined as a down close candle that is eclipsed by an up-close candle that closes above its high and sustained for 2 consecutive candles. Inversely, a bearish OB is defined by an up-close candle immediately followed by a down-close candle that closes below the low of the up-close candle and sustains for 2 consecutive candles.
2. Coloring the OB | Though up-close and down-close define bearish and bullish levels, with this script I basically make OBs to switch colors based on where price is relative to the block. So a bullish block can become bearish and bearish can become bullish. Each block also has a dashed midpoint.
3. Order Block Mitigation | When price retests an OB by closing inside of it and retracing back out, that is considered mitigation. You will see price tap into it, but continues to track as a valid block, it's because it didn't close inside the block. This is subject to change in the future, but it's how the script functions for now.
______________
There are nuances to the script that you will see as you use it. Sometimes mitigated OBs act as levels to consider as well. When multiple blocks overlap I consider that a high traffic area. I would never suggest to use an indicator by itself for trade ideas, but blocks that align on multiple timeframes are good to consider.
At the end of the day it's a support and resistance measure. I'll comment an update with a snapshot of the indicator with another proprietary indicator I've made that provides ample intraday trading opportunities.
Cheers,
DTD

Smart Money Breakout & Order Block StrategySmart Money Breakout & Order Block Strategy
Created by Shubham
This strategy was developed by Shubham, designed to provide traders with a structured approach to smart money trading by combining breakout entries and order block reversals. It focuses on liquidity zones, volatility filters, and ATR-based stop management to adapt to different market conditions.
🔹 Strategy Overview
The Smart Money Breakout & Order Block Strategy is built for traders who want to identify institutional moves while avoiding false breakouts. This non-repainting strategy helps traders detect:
✅ Momentum Breakouts – Price breaking key support & resistance levels.
✅ Order Block Reversals – Institutional buying & selling zones.
✅ Dynamic Stop Management – No fixed SL/TP; uses ATR-based trailing stops.
✅ Volatility Filtering – Avoids choppy market conditions.
🔹 Trading Logic
1️⃣ Breakout Trading (Momentum Entries)
Long Entry: When price breaks above resistance with high volatility.
Short Entry: When price breaks below support with high volatility.
2️⃣ Order Block Reversals (Liquidity Entries)
Bullish Order Block: A strong price rejection after consecutive bearish candles signals smart money accumulation, triggering a long trade.
Bearish Order Block: A strong price rejection after consecutive bullish candles signals smart money distribution, triggering a short trade.
3️⃣ Volatility Filter (False Signal Prevention)
Uses normalized volatility to ensure breakouts are backed by strong momentum.
Helps filter out low-volume, choppy market conditions.
4️⃣ ATR-Based Position Management (Dynamic Stops & Trailing Stop)
No fixed SL/TP → Uses ATR-based stop-loss to adapt to market volatility.
Implements a trailing stop for maximizing potential profits in trending markets.
🔹 Key Features
✔️ Developed by Shubham – Designed for precision trading with institutional techniques.
✔️ Smart Money Concept – Identifies liquidity zones, breakouts, and order blocks.
✔️ Volatility Filter – Prevents false breakouts by analyzing market momentum.
✔️ ATR-Based Dynamic Stops – No fixed SL/TP, making it more adaptive.
✔️ Trailing Stop Functionality – Allows profits to run while reducing risk.
✔️ Fully Automated Execution – Uses TradingView’s strategy functions for automatic trade placement and exits.
✔️ Commission-Adjusted Backtesting – Includes realistic commission settings to ensure accurate results.
📊 Backtesting & Realistic Expectations
✅ Best for Higher Timeframes (1H, 4H, Daily) – Avoids market noise.
✅ Most Effective in Trending & Volatile Markets – Crypto, forex, indices, and commodities.
✅ Performance Varies with Market Conditions – Works best in strong trends.
✅ No Unrealistic Promises – Strategy performance is dependent on market behavior and risk management.
📌 IMPORTANT DISCLAIMER:
This strategy is provided for educational purposes only and should not be considered financial advice. Past performance in backtesting does not guarantee future results. Users should conduct their own research before applying this strategy in live markets.
🚀 Developed by Shubham – Test it yourself and see how it performs! 🚀

Order Block Candle [TradeWithRon]Order Block Candle
This indicator is designed to help traders identify and visualize key movements within the market. These order blocks are areas where significant buying or selling has occurred, often leading to a strong price reaction. This script detects both bullish and bearish order blocks (with volume spike), marking them directly on your chart, and offers a variety of customization options to enhance your trading experience.
Features:
Bullish and Bearish Candles: Bullish Order Block: Identified when the current price creates a higher high and closes above the previous price, indicating a zone of potential buying activity by institutional traders.
Bearish Order Block: Identified when the current price creates a lower low and closes below the previous price, suggesting strong institutional selling.
Volume-Weighted Analysis: The indicator allows traders to incorporate volume into the order block detection. When a volume pivot (a significant change in volume) is detected, it strengthens the validity of the identified order block.
Customizable Visuals:
- Users can adjust the color and style of order block lines, including solid, dashed, or dotted styles, to suit personal preferences.
- Bullish Order Block Color: Choose from a range of colors to highlight bullish order blocks (default is green).
- Bearish Order Block Color: Choose a color for bearish order blocks (default is red).
- Users can also customize the color and style of the lines representing order blocks, helping traders visually track key levels.
Candle Body or. Wick: The indicator provides flexibility in defining the price range of the order block. Traders can choose whether to calculate the order block using the candle body (open and close) or the full wick (high and low) to suit their trading strategy.
Dynamic Line Extensions: Order block lines are dynamically extended to provide ongoing support and resistance levels. When a price breaks an order block line, the line changes to a dotted style, marking it as "broken." This allows traders to easily spot when the market invalidates an order block.
Alerts:
- Alert for Bullish Order Block: Get notified when a new bullish order block is detected.
- Alert for Bearish Order Block: Receive alerts when a bearish order block is identified.
- Alert for Broken Lines: Set up alerts to be notified when a bullish or bearish order block line is broken, giving traders a signal for potential market shifts.
Zone Management:
- The indicator tracks upper and lower zone information, marking significant price levels where institutional buying or selling might occur. Traders can adjust settings to define how many previous lines should be displayed on the chart for reference.
Optional Mitigated Order Blocks:
- A feature that highlights mitigated (neutralized) order blocks with a specific color and line style, offering additional insight into market behavior.
Input Settings:
- Length: The number of bars to the left and right of a pivot point for it to be considered a high or low.
- Candle Body: Option to use the candle body for calculations (as opposed to the wick).
- Bullish and Bearish Candle Color: Customizable colors for bullish and bearish order blocks.
- Open Line Style: Choose between solid, dashed, or dotted line styles for order block visualization.
- Removed Old Lines: Control the number of broken lines shown on the chart.
- Mitigated Line Style: Select line style for mitigated order blocks.
- Volume Use: Enable volume-based detection for stronger order block validation.
How to Use:
This indicator is ideal for traders looking to trade around institutional support and resistance levels. The bullish and bearish order blocks can serve as key entry or exit points, while broken lines offer dynamic support/resistance that adapt to market changes. Use the alerts to stay informed of critical market developments and adjust your trading strategy accordingly.
🔶 Disclaimer
Use with Caution: This indicator is provided for educational and informational purposes only and should not be considered as financial advice. Users should exercise caution and perform their own analysis before making trading decisions based on the indicator's signals.
Not Financial Advice: The information provided by this indicator does not constitute financial advice, and the creator (Tradewithron) shall not be held responsible for any trading losses incurred as a result of using this indicator.
Backtesting Recommended: Traders are encouraged to backtest the indicator thoroughly on historical data before using it in live trading to assess its performance and suitability for their trading strategies.
Risk Management: Trading involves inherent risks, and users should implement proper risk management strategies, including but not limited to stop-loss orders and position sizing, to mitigate potential losses.
No Guarantees: The accuracy and reliability of the indicator's signals cannot be guaranteed, as they are based on historical price data and past performance may not be indicative of future
Radi IQ [TradingIQ]Introducing "Radi IQ".
Radi IQ is a comprehensive market structure indicator designed to provide traders with a detailed view of key price levels and market behavior. It combines several analytical methods—including internal and external structure analysis, fair value gaps, order blocks, breaker blocks, rejection blocks, premium discount zones, equal levels, directional liquidity grabs, and trend meters —to help users better understand areas of support and resistance, potential turning points, and liquidity events in the market.
Key Components and Their Functions
Market Structure Analysis
Internal and External Structure : The indicator evaluates market structure on two levels. The internal analysis focuses on immediate price action (e.g., recent support/resistance and swing points), while the external analysis uses a higher timeframe to provide context. This dual approach helps to confirm the strength of key levels by comparing short-term moves with the broader market trend.
Break of Structure (BoS) and Change of Character (CHoCH) : These signals highlight moments when the market shifts its behavior. A BoS indicates that a previous level of support or resistance has been overcome, while a CHoCH signals a change in the market’s character. Both are marked clearly on the chart using distinct color codes.
Break of Structure + (BoS+) and Change of Character + (CHoCH+) : These signals highlight moments when the market shifts its behavior and is confirmed by prior price action. A BoS + indicates that a previous level of support or resistance has been overcome, while price action achieves higher highs and higher lows (resistance break) or lower highs and lower lows (support break). CHoCH + signals a change in the market’s character when supported by prior price action - lower highs for a support break and higher lows for a resistance break.
BoS and CHoCH
The image above shows BoS and CHoCH identified on the price chart, and explains what each signifies.
A Break Of Structure (BoS) occurs when price decisively moves beyond a previously established support or resistance level. It indicates that the current trend or market pattern is being challenged, and the market may be ready to change direction.
A Change of Character (CHoCH) describes a shift in how the market behaves. A CHoCH occurs when, in an uptrend, a previously established support level breaks, or in a downtrend, a previously established resistance level breaks.
This break indicates that the market's typical structure is shifting, suggesting that the current trend may be losing its strength and that a reversal or a new trend could be developing.
CHoCH+
The image above explains CHoCH+ and how it forms, while highlighting an instance where a downside CHoCH+ formed following lower highs.
A Change of Character + (CHoCH+) describes a shift in how the market behaves that is supported by prior price action. For support breaks, price must form lower highs before breaking support.
The image above explains CHoCH+ for resistance breaks, while highlighting an instance where a resistance point broke that was supported by prior price action.
BoS+
The image above explains BoS+ and how it forms, while highlighting an instance where an upside BoS+ formed following higher highs and higher lows.
A BoS+ resistance break requires higher highs and higher lows prior to the resistance point being closed over.
The image above explains BoS+ support break, while highlighting an instance where a downside BoS+ formed following lower highs and lower lows.
A BoS+ support break requires lower highs and lower lows prior to the support point being closed under.
Future BoS and CHoCH
Radi IQ also displays where the next BoS and CHoCH points are located.
The image above shows the feature in action. With this, traders will always know where the next key support/resistance breakpoints are before they actually occur.
Fair Value Gaps (FVG)
The indicator identifies gaps in the price where little or no trading occurred—known as fair value gaps. These gaps can act as temporary support or resistance and may indicate areas where the market is likely to correct. FVGs are displayed with clear color gradients that differentiate between upward and downward gaps.
The image above shows an identified upside FVG. In the image, the identified upside FVG acted as a support point for price.
The image above shows an identified downside FVG. In the image, the identified downside FVG acted as a resistance point for price.
Low Volume FVG
In addition to identifying trading FVGs - Radi IQ can also specifically detect low volume fair value gaps. Ideally, these fair value gaps will form inside a low volume node on a volume profile.
Low volume node FVGs are important because these are areas where very little trading occurred and is confirmable, indicating an imbalance in supply and demand. Since few trades took place there, the market often moves quickly through these zones when revisited, which can lead to rapid price changes. This "gap" in trading activity can serve as a signal for potential reversals or fast moves, offering opportunities to enter or exit positions based on expected market behavior.
The image above shows identified FVGs that formed on low volume.
Large Area FVGs
Radi IQ is also capable of filtering out “inconsequential” FVGs. With this, Radi IQ can be enabled to only mark FVGs that cover a wide price range.
The image above shows the feature enabled, and all identified FVGs formed with a wide price range.
Large Area FVGs and Low Volume FVGs Combined
Traders can also enable Radi IQ to only mark FVGs that form on low volume and have a wide price range - allowing traders to only identify the highest quality FVGs on the chart.
Order Blocks and Premium Discount Zones
Order Blocks: Radi IQ detects areas where large orders have previously been placed by institutional traders. These blocks can act as strong levels of support or resistance, and the indicator marks bullish and bearish order blocks with dedicated colors.
What is an order block?
Order blocks are clusters of orders that institutions have executed to enter or exit a market position. They typically form when there is a period of consolidation before a significant move. For example, the last bullish candle before a strong down move may indicate a supply order block, while the last bearish candle before a sharp rally might be considered a demand order block.
Why They Form:
Institutions don’t trade in small, sporadic amounts; they accumulate or distribute large volumes of an asset. To avoid slippage and minimize market impact, they execute these orders over a zone rather than at a single price point. This creates a recognizable “block” on the chart.
Order Block Identification Types
Strength Score
The “Strength Score” order block detection mode is a TradingIQ proprietary ranking system for identified order blocks.
Purpose
The purpose of the “Strength Score” ranking system is to determine the “strength” or significance of an order block and rate the zone’s likelihood to act as support/resistance when retested in the future.
The scoring system ranks from 0 - 10, with “0” indicating a “weak” score or low likelihood of acting as a key support/resistance level when retested in the future.
A rating of “5” indicates a “moderate” score, indicating that the order block has a moderate likelihood of acting as a key support/resistance level when retested in the future.
A rating of “10” indicates a “strong” score, indicating that the order block has a strong likelihood of acting as a key support/resistance level when retested in the future.
How It Works
The score is calculated by examining the price move following the formation of an order block. The stronger the price move after an order block forms - the higher the Strength Score.
The image above shows a bearish order block with a score of “5” identified on the chart. The order block successfully operates as a resistance point when retested.
The image above shows a bullish order block with a score of “5” identified on the chart. The order block successfully operates as a resistance point when retested.
Volume-Based
The volume-based order block detection method detects traditional order blocks, but goes one step further by identifying the highest concentration point of volume for the bar and drawing the order block around this concentration point.
Key features when using the volume-based order block detection method:
The top of the order block is anchored to the top of the highest volume concentration point of the bar
The bottom of the order block is anchored to the bottom of the highest volume concentration point of the bar
The total volume that went into creation of the order block is displayed on the chart
The total volume of the order block is recorded as a percentage relative to the total volume for all order blocks on the chart
The image above shows the detection method in action.
Breaker Blocks
A breaker block is a specific type of order block that gains significance when price breaks through it and then often retests the level as a new area of support or resistance. Essentially, it’s a zone where, after the initial break, the previous level (which once acted as strong support or resistance) flips roles. For example, in an uptrend, if the price falls below a key support level, that level can become a breaker block and act as resistance if the price tries to move back up. Conversely, in a downtrend, a broken resistance level can serve as new support. Traders monitor breaker blocks because they often mark a shift in market sentiment and can provide potential entry or exit points once the market re-engages with these levels.
The image above shows a breaker block above price acting as resistance.
The image above shows a breaker block below price acting as support.
Rejection Blocks
A rejection block is a price area where the market shows a strong unwillingness to move beyond a certain level. This typically happens when price approaches a specific level but then is quickly rejected, leading to a bounce in the opposite direction. In other words, a rejection block forms when traders' orders create a barrier, causing the price to reverse rather than break through. Traders watch these areas closely, as they often signal a strong concentration of supply or demand that could provide potential entry or exit points for trades.
The image above shows both a verified upside rejection block acting as resistance, and an untested downside rejection block.
Rejection blocks are expected to function as strong support/resistance points when retested in the future.
Premium Discount Zones
Premium Discount Zones : These zones reflect areas where price is trading above (premium) or below (discount) a fair value range. They help traders gauge whether the current market price is relatively high or low compared to historical averages.
Premium Discount Zones account for recent swing highs and lows to calculate a fair value along with discount and premium prices over an intermediate time window.
The image above shows the premium and discount price zones in action.
Equal Levels
The indicator also tracks and highlights equal levels, which occur when the market repeatedly tests the same price levels. Equal levels can reinforce the significance of a support or resistance area and are represented by their own set of color markers.
The image above shows Radi IQ distinguishing equal highs and equal lows.
Equal Highs
When you see two or more highs that are approximately the same, it suggests that the market is repeatedly rejecting attempts to push higher. This signals a strong resistance level where sellers (or stop-hunters) are active.
Equal Lows
Similarly, consecutive lows at the same level indicate strong support, where buyers step in consistently, preventing further decline.
Strong Highs and Lows
Strong High
A strong high is a price level where the market repeatedly fails to push higher. Typically, it’s characterized by:
Rejection: Price approaches the high but then reverses sharply, often leaving long upper wicks on the candlestick chart.
Consolidation: Multiple bars might show highs that are very close in value (often termed "equal highs"), indicating a well-established resistance zone.
Market Sentiment: This pattern suggests that sellers are actively defending that level, preventing further upward movement.
Strong Lows
Conversely, a strong low is a price level where the market repeatedly fails to break lower. It is identified by:
Bounce Back: Price touches the low and then rebounds sharply, often leaving long lower wicks.
Consistency: Multiple lows occur around the same level (sometimes referred to as "equal lows"), marking a solid support area.
Market Sentiment: This indicates that buyers are stepping in at that level, absorbing selling pressure and supporting the price.
The image above shows Radi IQ detecting both a strong high and strong low, while the detected strong low acts as support when retested.
Liquidity Grabs
Liquidity grabs occur when the market temporarily moves to absorb liquidity, often triggering stop-loss orders and leading to rapid price movements. Radi IQ flags these events by identifying conditions where price moves against recent pivots, helping traders spot potential liquidity-related reversals or breakouts.
The image above shows Radi IQ identifying both an upside liquidity grab and a downside liquidity grab.
Upside Liquidity Grab (Bearish)
An upside liquidity grab happens when the price moves above a well-known resistance area or recent high. This move is often short-lived.
Many traders place stop-loss orders or pending buy orders just above resistance levels. Institutional players may intentionally push price upward to trigger these orders, thereby “grabbing” the liquidity available at that level.
Downside Liquidity Grab (Bullish)
A downside liquidity grab is the mirror image: the price briefly dips below a key support level or recent low.
Traders often place stop-loss orders or pending sell orders just below support levels. An intentional drop below this support can trigger these stops, allowing institutional players to capture liquidity.
Multi-Timeframe Analysis and Swings
By using data from different timeframes, Radi IQ offers a broader perspective on market trends. It highlights significant swing highs and swing lows, providing visual cues that indicate the market’s directional bias. This feature assists traders in identifying both short-term opportunities and long-term trends.
The image above shows Radi IQ detecting higher swings and lower swings.
IQ Meters / Fibometer
IQ Meters (Fibometers) are a proprietary TradingIQ tool that allows traders to easily identify the highs and lows of the current trend and where current price is relative to these points.
The image above depicts the IQ Meters—an exclusive TradingIQ tool designed to help traders evaluate trend strength and retracement opportunities.
When the lower timeframe Zig Zag IQ and the higher timeframe Zig Zag IQ are out of sync (i.e., one is uptrending while the other is downtrending, with no active positions), the meters display a neutral color as shown in the image.
The key to using these meters is to identify trend unison and pinpoint key trend retracement entry opportunities. Fibonacci retracement levels for the current trend are interlaced along each meter, and the current price is converted to a retracement ratio of the trend.
These meters can mathematically determine where price stands relative to the larger and smaller trends, aiding in identifying entry opportunities.
The top of each meter indicates the highest price achieved during the current price move.
The bottom of each meter indicates the lowest price achieved during the current price move.
When both the larger and smaller trends are in sync and uptrending, or when a long position is active, the IQ meters turn green, indicating uptrend strength.
When both meters are green, it indicates uptrend strength as both the higher timeframe trend and lower timeframe trend are in unison. Look for price to retrace to key fibonacci retracement levels during this time period.
When both trends are in sync and downtrending, or when a short position is active, the IQ meters turn red, indicating downtrend strength.
When both meters are red, it indicates downtrend strength as both the higher timeframe trend and lower timeframe trend are in unison. Look for price to retrace to key fibonacci retracement levels during this time period.
Summary
Radi IQ serves as a robust, data-driven tool for traders who seek a deeper understanding of market structure. By integrating internal and external analysis, fair value gap detection, order block identification, premium discount zoning, equal level tracking, liquidity grabs and much more into one indicator, it offers a multi-layered view of the market. This helps traders not only recognize potential turning points and areas of market stress but also manage risk more effectively and plan their trades with greater precision. The indicator’s clear visual representation and dynamic updates make it a practical addition to any trader’s toolkit.
Script de pago
Volume Order Blocks [BigBeluga]Volume Order Blocks is a powerful indicator that identifies significant order blocks based on price structure, helping traders spot key supply and demand zones. The tool leverages EMA crossovers to determine the formation of bullish and bearish order blocks while visualizing their associated volume and relative strength.
🔵 Key Features:
Order Block Detection via EMA Crossovers:
Plots bullish order blocks at recent lows when the short EMA crosses above the long EMA.
Plots bearish order blocks at recent highs when the short EMA crosses below the long EMA.
Uses customizable sensitivity through the “Sensitivity Detection” setting to fine-tune block formation.
Volume Collection and Visualization:
Calculates the total volume between the EMA crossover bar and the corresponding high (bearish OB) or low (bullish OB).
Displays the absolute volume amount next to each order block for clear volume insights.
Percentage Volume Distribution:
Shows the percentage distribution of volume among bullish or bearish order blocks.
100% represents the cumulative volume of all OBs in the same category (bullish or bearish).
Order Block Removal Conditions:
Bullish order blocks are removed when the price closes below the bottom of the block.
Bearish order blocks are removed when the price closes above the top of the block.
Helps maintain chart clarity by only displaying relevant and active levels.
Midline Feature:
Dashed midline inside each order block indicates the midpoint between the upper and lower boundaries.
Traders can toggle the midline on or off through the settings.
Shadow Trend:
Shadow Trend dynamically visualizes trend strength and direction by adapting its color intensity based on price movement.
🔵 Usage:
Supply & Demand Zones: Use bullish and bearish order blocks to identify key market reversal or continuation points.
Volume Strength Analysis: Compare volume percentages to gauge which order blocks hold stronger market significance.
Breakout Confirmation: Monitor block removal conditions for potential breakout signals beyond support or resistance zones.
Trend Reversals: Combine EMA crossovers with order block formation for early trend reversal detection.
Risk Management: Use OB boundaries as potential stop-loss or entry points.
Volume Order Blocks is an essential tool for traders seeking to incorporate volume-based supply and demand analysis into their trading strategy. By combining price action, volume data, and EMA crossovers, it offers a comprehensive view of market structure and potential turning points.

Advanced Market Structure & Order Blocks (fadi)Advanced Market Structure & Order Blocks indicator provides a new approach to understanding price action using ICT (Inner Circle Trader) concepts related to candle blocks to analyze the market behavior and eliminate much of the noise created by the price action.
This indicator is not intended to provide trade signals, it is designed to provide the traders with to support their trading strategies and add clarity where possible.
There are currently three main elements to this indicator:
Market Structure
Order Blocks
Liquidity Voids
Market Structure
In trading, market structure is often identified by observing higher highs and higher lows. An uptrend is characterized by a series of higher highs, where each peak surpasses the previous one, and higher lows, where each trough is higher than the preceding one. Conversely, a downtrend is marked by lower highs and lower lows.
Other indicators usually determine these peaks by calculating the highest or lowest levels within a predefined number of candles. For example, identifying the highest price level within the last 15 candles and marking it as a higher high or a lower high. While this approach offers some structure to price action, it can be arbitrary and random due to price fluctuations and the lack of proper structure analysis beyond finding the highest peaks and valleys within candle ranges.
In his 2022 mentorship, episode 12, ICT introduced an alternative approach focusing on three-candle pivots called Short Term High and Low (STH/STL), which are then used to calculate the Intermediate Term High and Low (ITH/ITL), and in turn, the Long Term High and Low (LTH/LTL). ICT’s approach provides better structure than the traditional method mentioned above. However, it can be confusing and difficult to track. There are great indicators that track and label ICT’s levels, but traders still find it challenging to follow and understand.
The Advanced Market Structure indicator takes a unique approach by analyzing candle formations, using ICT concepts, to identify possible turning points that mimic a real trader’s analysis of price action as closely as possible. However, it should be expected that Market Makers may use market manipulation to induce traders to make failed trades, and no tooling can eliminate these situations.
Advanced Market Structure tracks true Peaks and Valleys as they form, confirms them, and marks the chart with corresponding labels using traditional labeling methods (HH/HL/LH/LL), as such labeling makes it easier for traders to follow and understand. The indicator also draws levels to help identify possible liquidity areas and trade targets.
The indicator uses different calculation methods for the different type of market structure length, however all calculations are based on the same ICT candle blocks concepts.
Market Structure Settings
Other than the display settings, there are four (4) settings, mainly under the Level Settings section.
Allow Nested Candles
This option is only available on the Short Market Structure due to the methods used in calculating highs and lows. When used, the indicator will attempt to detect smaller fluctuations in price by tracking smaller candle moves, if any.
Level Settings
Level Settings allows the trader to decide two main calculations:
1. A new pivot point will form when a candle’s is crossed by the following candle’s
2. For a liquidity sweep and marking a level as mitigated, a candle’s must cross that level
Order Blocks
ICT (Inner Circle Trader) defines an Order Block as the last down-closing candle, or series of candles, before a significant upward price move or the last up-closing candle, or series of candles, before a significant downward price move. These key price levels, marked by substantial buy or sell orders from institutional traders or "smart money," create a block or zone on the price chart. When the price revisits these levels, it often leads to a strong market reaction. Order Blocks can consist of one or multiple consecutive candles of the same color, signaling areas of significant buying or selling interest. ICT's approach to Order Blocks provides traders with a structured method to identify potential areas of support or resistance, where price movements are more likely to change direction. Although ICT has shared some criteria for identifying Order Blocks publicly, the full details are reserved for his upcoming books. This indicator leverages the publicly available information to provide traders with valuable insights into these crucial price levels.
The Advanced Market Structure indicator is designed to be highly flexible, allowing traders to define their own combination of rules for identifying Order Blocks, thus customizing it to fit their unique trading strategies.
Order Block Configuration
Can be nested
An Order Block is defined as the last down candle or candles before a strong move higher, and vice versa for bearish Order Blocks. However, larger-than-usual candles resulting from news events or price action may not qualify as Order Blocks and can mute any Order Block within their range.
The "Can be nested" flag ensures that each Order Block is treated as an independent entity, even if it appears within the body of another Order Block.
Forms at swing point
Order Blocks formed at swing points typically have higher probabilities but are less frequent, assuming the same rules are applied. Additionally, Order Blocks at swing points may become Breaker and Mitigation blocks if they fail, providing more trading opportunities.
Forms a simple pivot point
A simple pivot point corresponds to ICT Short Term High and Low (STH/STL). Order Blocks using simple pivot points can occur in the middle of a move, not just at swing points. These are useful for identifying IOFED setups and supporting blocks that can bolster the price move.
Causes Market Structure Shift
Order Blocks that result in a break above or below a short swing point can help narrow down target order blocks, but they are less frequent. An Order Block causing a break above or below a pivot point does not necessarily indicate a strong Order Block. For example, an Order Block formed at a Lower Low is more likely to fail in a downtrend.
A clean close above order block
When the first candle breaks above an Order Block and closes above its high, this indicates a stronger Order Block. On the other hand, if a candle merely wicks through the Order Block without a solid close above it, it suggests a weaker Order Block. This may indicate hesitation or an impending reversal, as the wick represents a temporary and unsustained price movement.
Has displacement more than X the body
While some traders may capitalize on the initial break above an Order Block's CISD level, others prefer to focus on the return to an Order Block after displacement. Displacement is determined by the body size of the Order Block, and an Order Block cannot be tested until this level has been achieved.
Has a Fair Value Gap
When an Order Block is combined with a Fair Value Gap (FVG), it signifies a strong Order Block. The Fair Value Gap indicates a strong price movement away from the Order Block.
Has a liquidity void
A Liquidity Void occurs when two consecutive candles of the same color do not overlap, creating a gap similar to a Fair Value Gap, but involving one or more middle candles. Liquidity Voids can be utilized in combination with, or as an alternative to, the displacement setting.
Maximum number of OBs
The maximum number of Order Blocks to display.
Mitigated at block’s
An Order Block is considered mitigated when price reaches one of the main Order Block levels.
Liquidity Void
Liquidity Void refers to areas on a price chart where there is one-sided trading activity. This phenomenon occurs when the price of an asset moves sharply in one direction, leaving gaps where two consecutive candles of the same color do not overlap. These gaps can comprise one or more middle candles and indicates a pronounced lack of trading within that price range. Liquidity Voids are important because they highlight areas of minimal resistance, where price is more likely to return to fill the void and balance the market.
Liquidity Void vs Fair Value Gap
While both concepts are related to gaps in price action, they are distinct. A Fair Value Gap is a specific three-candle pattern where the middle candle creates a gap between the first and third candles. In contrast, a Liquidity Void represents a broader area on the chart where there is little to no trading activity, often encompassing multiple candles and indicating a more pronounced imbalance between buy and sell orders.
A FVG can be part of a Liquidity Void, a Liquidity Void can exist without necessarily including an FVG. Both concepts highlight areas of minimal resistance and potential price movement, but they differ in their formation and implications.
Advanced Market Structure and Order Blocks indicator focus on liquidity voids since a liquidity void can substitute for a FVG and it is usually less addressed by other indicators.
