Apex Wallet - Ultimate Trend Meter: 9-in-1 Multi-Layer Momentum Overview The Apex Wallet Trend Meter is an advanced decision-making dashboard designed to provide a comprehensive view of market conditions without cluttering your main price chart. It synthesizes complex data from 9 different technical sources into a clean, horizontal visual grid, allowing traders to spot confluence at a single glance.
The Power of Confluence Instead of switching between multiple oscillators, this tool monitors:
Triple EMA Structure: Tracks Short, Medium, and Long-term trend directions.
Momentum Suite: Real-time status of RSI, Stochastic, and StochRSI.
Advanced Analyzers: Includes MACD (Line/Signal), TDI (Traders Dynamic Index), and the Andean Oscillator for trend exhaustion and volatility states.
Smart Delta Net: A sophisticated Volume Delta engine that filters market noise through customizable modes (Buy/Sell, Neutral, or Automatic).
Key Features:
Adaptive Trading Presets: One-click selection for Scalping, Day-Trading, or Swing-Trading. The script automatically recalibrates all 9 indicator periods to fit your timeframe.
Market Bias Filtering: Indicators are color-coded based on their alignment with the global market trend. Signals only turn Bullish or Bearish when they align with the master trend EMA.
Dynamic Delta Grid: Displays scaled net volume values directly inside the grid for precise institutional flow tracking.
Fully Customizable UI: Toggle any layer on/off and adjust the layout density to match your workspace.
How to use: Look for "Vertical Confluence." When multiple layers turn the same color simultaneously, it indicates a high-probability momentum shift.
ONE

Apex Wallet - Ultimate Trading Suite: All-In-One Overlay & SignaOverview The Apex Wallet All-In-One is a comprehensive professional trading toolkit designed to centralize every essential technical analysis tool directly onto your main price chart. Instead of cluttering your workspace with dozens of separate indicators, this script integrates trend analysis, volatility bands, automated chart patterns, and a multi-indicator signal engine into a single, cohesive interface.
Key Modular Features:
Trend Core: Features dynamic trend curves, cloud fills for momentum visualization, and a multi-timeframe dashboard (1m to 4h) to ensure you are always trading with the higher-timeframe bias.
Automated Chart Structures: Automatically detects and plots Support/Resistance levels, Standard Pivot Points, Market Gaps, and Fair Value Gaps (Imbalances).
Volatility & Volume: Includes professional-grade VWAP with standard deviation bands, Bollinger Bands, and a built-in Volume Delta (Raw/Net) tracker.
Signal Engine: A powerful cross-logic system that generates entry signals based on RSI (QQE), MACD (Zero-cross & Relance), Stochastic, TDI, and the Andean Oscillator.
Predictive Projections: A unique feature that projects current indicator slopes into future candles to help anticipate potential trend continuations or reversals.
Adaptability The script includes three core presets—Scalping, Day-Trading, and Swing-Trading—which automatically adjust all internal periods (Moving Averages, Bollinger, RSI, etc.) to match your specific market speed.
Visual Cleanliness Every feature is toggleable. You can display a "clean" chart with just the Trend Cloud or a "complete" workstation with signals, patterns (Doji, Engulfing), and pivot levels

Total Info Indicator by MikePenzin
Install & Add to Chart
• Copy the script into Pine Editor → click Add to Chart .
• Open the ⚙️ Settings → Inputs to customize.
What It Does
• Displays key info in a floating table — trend, volume, ATR, RSI, stop loss, and more.
• Detects breakouts , smart SELL signals , and opening strength .
• Uses emojis and colours to make trends easy to read: 🟢 good, 🟡 neutral, 🔴 risky.
For Swing Traders
• Works best on Daily or 4H charts.
• Watch for 🟢 Uptrend + ⚡BUY / 🔥BUY breakout signals.
• Use ATR-based Stop Loss (shown in table).
• Avoid new entries a few days before earnings.
Suggested Setup
• 20/50/150 MA Lines: ON
• 200 MA Line: optional
• ATR Multiplier: 1.3
• Breakout Detection: ON (Volume + RSI + Trend filters)
• Smart SELLs: ON (RSI 70, EMA 20)
• Pivots: ON for quick swing levels
How to Read
• MA Row: 🟢 = price above MA (bullish).
• ATR/Stop Loss: Suggests where to place protective stop.
• Volume Info: Today’s vs 20-day average, plus pace.
• RSI & CCI: Shows momentum and overbought/oversold levels.
• Breakouts: ⚡BUY (early), 🔥BUY (confirmed).
• Smart SELLs: RSI🔴 / DIV🟣 / EMA🔵 mean potential exit zones.
Example Use
1️⃣ Find stocks with Uptrend 🟢 , rising volume, and ⚡BUY signal.
2️⃣ Enter near breakout; set Stop = shown level.
3️⃣ Take profits or trail when Smart SELLs appear or RSI peaks.
Tips
• Choose table corner under “Table Visualization.”
• Reduce clutter on small timeframes (turn off Pivots/200 MA).
• Use “Volume speed” to spot surging interest before breakouts.
• Compatible with most equities and ETFs.
Disclaimer
This script is for education & analysis only .
Not financial advice — always manage your own risk.

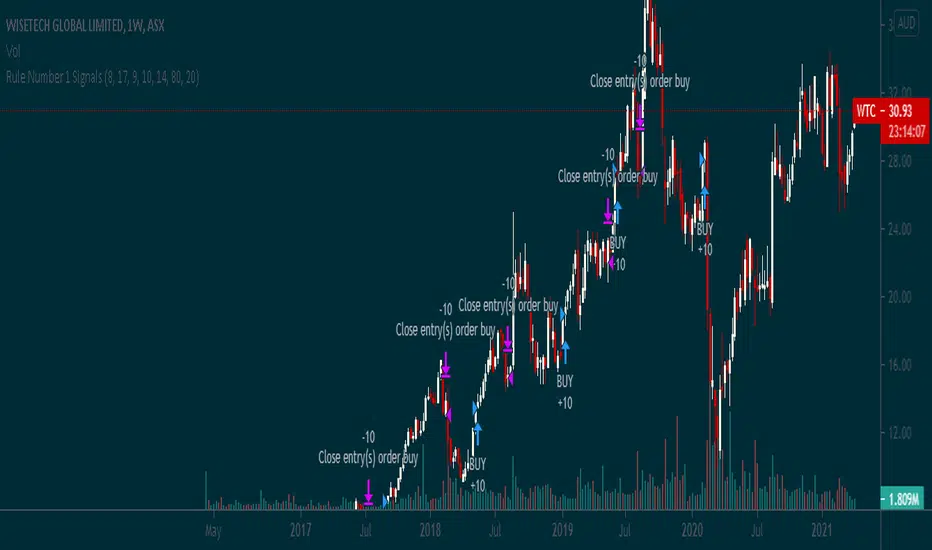
Rule Number 1 Signals [ALERTS]Alerts version of rule number 1 signals, a long-only strategy for long term investors to help them enter positions more optimally

One-Stop Trading SetupOne-Stop Trading Setup:
This script designed to identify up, down, and sideways trends. 200 HMA, 9 EMA, PSAR, and ATR are used to identify the strength of any instrument.
Candle Colors - Simpler approach to follow:
Green color indicates for up side trade signals
Red color indicates for down side trade signals
Yellow color can be interpreted for stop, sideways, and counter trade trade signals
Multiple Trade Setups:
Green Zone - Trading green candles within green zone has better odds of long trades
Red Zone - Trading red candles within red zone has better odds of short trades
200 HMA - Candles above 200 HMA mostly for long trades. Candles below 200 HMA usually for short trades. But the zone also very important to consider
9 EMA - Cross over above 200 HMA in Green zone, look for long trades. Cross over below 200 HMA in red zone, look for short trades
PSAR - This can be used as potential initial warning sign. Also can be used to exit partial or wait for it goes to opposite side for taking trade decisions
Candle Above all - If Green candle and above all the indicators, then very good sign of long side. If red candle and below all indicators, then very good sign of short side.
Multiple Time Frame:
This works very well with any instrument and on any time frame. Always its better to do analysis on multi time frame before entry, exit, and trade execution. Back test it with this setup and also observe it on live market. That will give edge in taking trade decisions. All the best and happy trading.
Disclaimer:
This script and setup is written with the sole purpose of identifying the strength of any instrument. Interpretation, trade decisions, and changing inputs are up to each individual users/trades.
All-In-One EMA Boll Cross SignalsThis one combines many commonly used indicators and signals into one.
1. EMA lines
2. SMA lines
3. Bolling Bands (EMA based)
4. Ichimoku cloud
5. 3/8, 10/20 EMA crosses
6. 5/10 SMA crosses
7. MACD crosses

Rule Number 1 SignalsThis script takes the Rule #1 3 tools and plots them on the graph, to provide an additional level of indication for when to sell and when to buy.