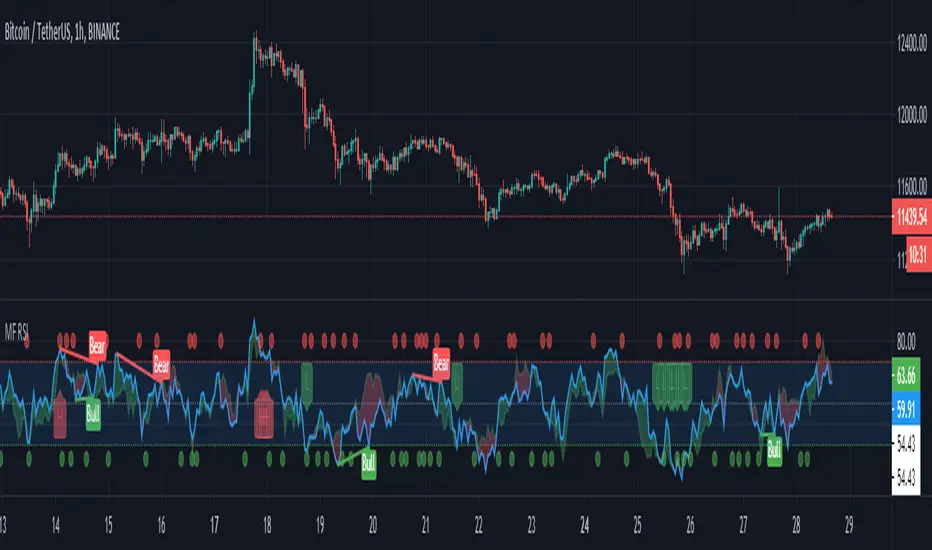
MFI + RSI + MOM With Bull & Bear Trend LabelMOMENTUM + MONEY FLOW INDEX + RELATIVE STRENGTH INDEX WITH BULL & BEAR LABELS
This is a combination of 3 popular indicators. Momentum(MOM), Money Flow Index(MFI) and Relative Strength Index(RSI) along with color changing labels that tell you each indicator's current trend.
The middle white line shows the level that each indicator needs to stay above to be bullish and below for bearish. Watch for all three indicators to cross and hold above or below the mid line for big moves.
It is important to note that these indicators do not need to be going up to be bullish or down to be bearish. They just need to hold above or below the mid line to understand the overall trend.
The momentum indicator is the most relevant in my opinion. If it is holding above the mid line steadily, usually the overall trend will continue upwards so look to buy the dips if the momentum cloud is staying above the white line and vice versa.
It is also important to note that the default settings for this indicator are the 100 period as I find it to be super relevant across most charts but these numbers can be changed in the indicator settings.
Since momentum swings wildly past the normal 0-100 range, it is important to note that the momentum line has been “normalized” to stay within this same range as the rsi and mfi. So if you look at a normal momentum indicator side by side with this indicator it will not look the same however, I find it to be a very good indicator of overall direction so I know the current market sentiment even when price is diverging from the indicator directions.
All of the colors, sources and lengths can be easily customized in the indicator settings input tab.
***HOW TO USE***
When Momentum is above the mid line, it is bullish. When Momentum is below the mid line, it is bearish.
A label on the right side will update in real time to tell you if momentum is Bullish or Bearish for faster recognition of the trend.
When RSI is above the mid line, it is bullish. When Momentum is below the mid line it is bearish.
A label on the right side will update in real time to tell you if RSI is Bullish or Bearish for faster recognition of the trend.
When MFI is above the mid line, it is bullish. When MFI is below the mid line it is bearish.
A label on the right side will update in real time to tell you if MFI is Bullish or Bearish for faster recognition of the trend.
This indicator was built to help you quickly identify the Bullish or Bearish nature of the current trend with a live color changing label so you can glance at the label and understand it's direction without analyzing the indicator data.
***MARKETS***
This indicator can be used as a signal on all markets, including stocks, crypto, futures and forex.
***TIMEFRAMES***
This mom + mfi + rsi indicator can be used on all timeframes.
***TIPS***
Try using numerous indicators of ours on your chart so you can instantly see the bullish or bearish trend of multiple indicators in real time without having to analyze the data. Some of our favorites are our Auto Fibonacci, Directional Movement Index, Volume Profile, Auto Support And Resistance and Money Flow Index in combination with this indicator. They all have real time Bullish and Bearish labels as well so you can immediately understand each indicator's trend.
Índice de flujo monetario (MFI)

Money Flow Index With Bullish & Bearish SignalsMONEY FLOW INDEX WITH BULLISH AND BEARISH SIGNALS
Money Flow Index shows whether money is coming into the market or going out of the market. This can be used to gauge market sentiment and whether people are buying or selling at the current price.
***HOW TO USE***
If the MFI line is green, it is above the 50 line and in a bullish trend.
If the MFI line is red, it is below the 50 line and in a bearish trend.
If the background color is green, Money Flow is in a bullish trend, holding above the 50 line.
If the background color is red, Money Flow is in a bearish trend, holding below the 50 line.
If the MFI is above the 75 level it indicates a possible top or overbought conditions.
If the MFI is below the 25 level it indicates a possible bottom or oversold conditions.
***BULLISH/BEARISH LABELS***
There is also a label on the right side that tells you whether the overall trend is bullish or bearish, if there is a possible bottom or top and if the current money flow index is going up or down. This table updates in real time and changes colors so you can get an easy, quick interpretation of the current money flow without having to look at the data so you can make faster decisions on whether to enter or exit a trade. The flashing from red to green or the opposite also grabs your attention so you know immediately if there is a change in trend. The table changes colors in sync with the MFI line and it's trends and bottom/top areas. Green means money is coming in. Red means money is going out. Blue means a neutral amount of money flow.
***MARKETS***
This indicator can be used as a signal on all markets, including stocks, crypto, futures and forex.
***TIMEFRAMES***
This Money Flow Index indicator can be used on all timeframes.
***TIPS***
Try using numerous indicators of ours on your chart so you can instantly see the bullish or bearish trend of multiple indicators in real time without having to analyze the data. Some of our favorites are our Auto Fibonacci, DMI, Momentum, Auto Support And Resistance and Volume Profile in combination with this Money Flow Index. They all have real time Bullish and Bearish labels as well so you can immediately understand each indicator's trend.

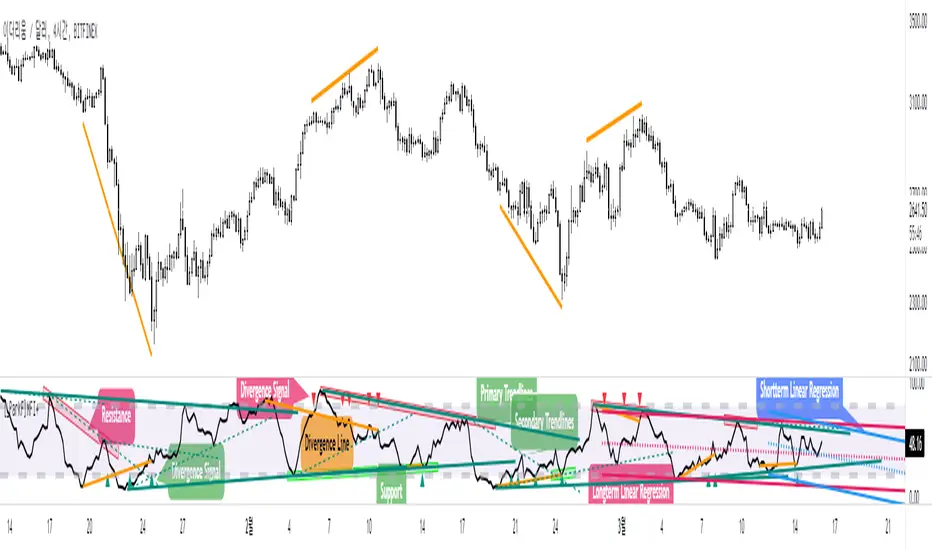
[_ParkF]MFI+Added the Moneyflow Index indicator.
Divergence signals and diversion lines are drawn.
Support and resistance were also confirmed when linear regression and trend lines were used for the Moneyflow Index.
Two linear regression and two trend lines are drawn.
Because the two linear regression values are different, you can see the support and resistance of long-term and short-term linear regression.
Since the periodic values of the two trend lines are also different, support and resistance that could not be identified in linear regression can be identified.
Each linear regression line and trend line can be turned on or off.
In addition, each linear regression line and trend line can arbitrarily modify period values and deviation values.
I hope it will help you trade.
-------------------------------------------------------------------------------------------------------------------------------------------------------------------------------------------
머니플로우인덱스 지표를 추가하였습니다.
다이버전스 신호와 다이버전스 라인이 그려집니다.
머니플로우인덱스에도 선형회귀와 추세선을 이용했을 때 지지와 저항이 확인이 되었습니다.
2개의 선형회귀와 2개의 추세선이 그려지고
두 선형 회귀 값은 서로 다르기 때문에 장기 및 단기 선형 회귀의 지지 및 저항을 확인할 수 있습니다.
두 추세선의 주기 값도 다르므로 선형 회귀 분석에서 확인할 수 없었던 지지 및 저항을 확인할 수 있습니다.
각 선형 회귀선 및 추세선은 켜거나 끌 수 있습니다.
또한 각 선형 회귀선 및 추세선은 주기 값과 편차 값을 임의로 수정할 수 있습니다.
당신의 트레이딩에 도움이 되었으면 합니다.
-------------------------------------------------------------------------------------------------------------------------------------------------------------------------------------------
* I would like to express my gratitude to zdmre for revealing the linear regression source.
* I would like to express my gratitude to aaahopper for revealing the trendlines source.
Measure Volume, Momentum, Trend, VolatilityThis script displays the following indicators in one pane to quickly determine several important factors regarding price action. It allows the user to quickly see all of most important factors surrounding price action in one pane with one quick glance. This should be incredibly helpful and allow things like double divergence and trend confirmation to be spotted much more quickly. I personally use the data in this indicator to replace four separate indicators and it has brought my win rate and profit factor significantly higher. I hadn't seen any place where all of the best J. Welles Wilder indicators such as RSI, Parabolic SAR, and DMI/ADX were brought into one easy to use interface. This is my attempt at fixing that gap. For a much deeper understanding of how to use these indicators, I recommend reading New Concepts in Technical Trading Systems written by J. Welles Wilder.
Momentum via RSI (Relative Strength Index)
Volume via MFI (Money Flow Index)
Volatility via DMI/ADX (Direction Movement Index/Average Directional Index)
Trend via Parabolic SAR (Parabolic Stop and Reverse)
It is worth noting that DMI/ADX and Parabolic SAR can both help determine trend strength and volatility.
The Volatility mechanism is measured by DMI and ADX and displayed at the top of the pane using circles. The top, tiny circles reflect if show if positive DI or negative DI has a higher value. The small circles directly underneath indicate whether or not the ADX is above 20 (configurable, some may choose to increase this to 25 or even 30).
The Momentum mechanism is shown as standard RSI with the default being a white line and default period of 14, which is all configurable.
The Volume mechanism is shown as standard MFI with the default being a fuchsia line and default period of 14, which is also configurable.
The momentum and volume oscillators should be used in conjunction to help spot whether the trend is strong or weak using divergences and the middle, overbought, and oversold levels. These levels are also configurable.
The Trend mechanism is measured by Parabolic SAR and displayed at the bottom of the pane using diamonds. The default is red diamonds when in a bear trend, green when in an uptrend which is configurable. When price is above the Parabolic SAR, it is considered to be an uptrend. When price is below the Parabolic SAR, it is considered to be a downtrend. The way price is measured is also configurable (i.e. open, close, ohlc4, hlc3, etc.). When price crossed above or below the Parabolic SAR, the diamonds will change colors.
All the indicators displayed should be used in a well rounded strategy. For instance, I only trade when ADX is above 20 and rarely trade against the trend shown via PSAR. When trend shifts and divergences helped indicate a trend shift would occur using the RSI and MFI, it can be a great spot to take an entry. RSI/MFI can also confirm the trend is strong when they are not showing divergences and inline with price action. All of this data should be used in conjunction with good fundamental data and technical levels. Divergences with RSI and MFI on double tops or bottoms can also be incredibly powerful. There is no right or wrong way to use all the data displayed in this indicator, however using all four pillars of trading (Momentum, Volume, Trend, Volatility) will help ensure only the best trades are taken.

Oversold / OverboughtMy first script. Based on RSI , CCI , RVI, and MFI . You can customize overbought or oversold thresholds for any indicator.
If you have any ideas - welcome.
Disclaimer
This is not financial advice. Trade on your own risk.

NVTNetwork Value to Transactions Ratio (NVT) is defined as the ratio of market capitalization divided by transacted volume.
NVT Ratio can be thought of as an indicator that measures whether the blockchain network is overvalued or not.
If it is upper than red line, it means overvalued.
NVT Golden Cross targets to generate short or long signals by comparing the short-term trend of NVT and the long-term trend of NVT. If the short-term trend is way greater than the long-term trend is, the network can be interpreted as overpriced and will soon revert to mean value, meaning short signal. Similarly, the opposite case may imply a long signal.
Over the red line is short signal and under the green line is long signal.
You can find divergence in this indicator.
There are two sources
cryptocap
glassnode

+ Breadth & Volumenote* If you've used my "+ Rate of Change Indicator", I am updating that without the OBV, which has been moved here. Just an FYI.
This "indicator" is basically a variety of indicators that measure volume, or accumulation/distribution. There's a bit of a story about how this came about but
it's not that interesting, so I'll spare you.
Indicators from which you may choose here are On Balance Volume (OBV), Money Flow Index (MFI), Chaikin Money Flow (CMF), Chaikin Oscillator, and Positive & Negative Net Volume.
I'll give a brief overview of these below, and if you want to educate yourself further on them you may. There are many web resources for that.
Most people are probably familiar with OBV. It's one of the more commonly used volume indicators, especially in the crypto crowd (at least amongst those traders I follow). It's basically a cumulative (doesn't oscillate around a midpoint) momentum indicator that measures volume of the current period versus volume of the previous period and adds it if price closed higher, but subtracts it if price closes lower. It's another way of using volume to confirm trend.
The MFI is a momentum indicator that measures the flow of money into and out of an asset over some period of time (user input). It's calculated using the RSI, so it can be used similarly to RSI (divergences, overbought, oversold, etc.), but of course unlike the RSI it's calculated primarily using volume and comparing the most recent candle close to the previous one (similar to OBV).
CMF is a volume-weighted average of accumulation and distribution over a some period of time (typically 21). It's a way of measuring accumulation versus
distribution in an asset, and oscillates around a zero line. You would use it similarly to any other oscillator, in that you can look for divergences, and general positive or negative momentum.
Chaikin Oscillator is basically a MACD (without signal line) of the accumulation and distribution index (or line--which is somehow different than simply accumulation and distribution). I haven't looked into these differences deeply, but if you look below at the calculations, and substituted 'ad' for 'accdist' you get very different readings. I actually did that, and what it looks like it would do is turn the actual Oscillator into a MACD signal line. So, by substituting 'ad' for 'accdist' (or the accumulation/distribution index) you produce a signal line of the Chaikin Oscillator.
Anyway, all that confusion out of the way, as I said, it's a MACD on the accumulation and distribution index, therefore it is another zero line oscillator, and similarly to CMF, it's a way of measuring price movements in the chart versus a/d. The zero line isn't just any old zero line, however, it is actually the accumulation distribution line. I've made an OBV version of this by substituting the OBV for AD, so if you prefer OBV maybe you will like that.
Pos. & Neg Net Volume is actually an indicator I had seen made by RafaelZioni. It basically takes net volume, calculates a cumulative of that, then subtracts a moving average of some period from the cumulative net volume in order to create a volume oscillator. Use it like the other oscillators!
Added Donchian Channels, moving averages, Bollinger Bands, colored everything, and alerts.
Enjoy!
Below I will post images with the different indicators, everything on default settings (except for lookback period, which I have adjusted to my personal preferences).
Above is an image with the MFI being compared to the RSI since they are very similar (MFI being basically a volume derivative of the RSI).
Chaikin Money Flow set to lookback of 13. You could probably extend that a bit if you wanted to smooth the line more.
Chaikin Oscillator and Chaikin Oscillator of OBV, with a zoomed in look below, to see the differences more clearly.
CO and COBV closer look.
Positive & Negative Net Volume.

Trend Strength Directional IndicatorThis study was inspired by two famous Trading View contributors. Shout out to Lazy Bear and Crypto Face!
In this study you have a live view of the strength of direction the market is heading. The indicator that looks like a black wave is showing us the momentum of price action. When a green dot appears under the lower level it is a indication that we should consider buying, and if the red dot appears over the upper level we should sell. The custom MFI indicator determines how much money is flowing into the market. If it is green that means money is flowing into the market and if it shows red it means that money is flowing out of the market.

CM_Twiggs Money FlowFull Credit goes to LazyBear for publishing Original Code.
I added:
Threshold lines that changes the color of Histogram based on if it exceeds Threshold lines. Ability to turn off and on.
Ability to Turn Histogram Off/On
Ability to turn Twiggs Money Flow Line Off/On

MFI Waves w LevelsThis is a Money Flow Index oscillating wave indicator that also has preset levels that can be adjusted by the user in the settings. The levels indicate how deep or high the waves are moving to
i use this indicator when scalping and on all time frame charts, i like to watch for certain patterns forming either at the lower levels for longs or at the higher levels for shorts.
This indicator is smoothed for Heikin Ashi candles, and does RSI in the calculation. MFI uses volume and price change.
Stochastic MFIDue to some similarity of the Relative Strength Index(RSI) and Money Flow Index(MFI), I thought of creating a Stoch MFI inspired by the Stoch RSI.
- can be used similar to the Stoch RSI
- useful for pullback during trending markets and for S&R trading during ranging markets
TAYOR!

+ Accumulation/DistributionThis is an updated version (with lots of extras added) of the Accumulation/Distribution indicator coded by @Cl8DH.
You can read about what he says about his indicator, and how to use it, here:
So, from that, what have I done?
I added a moving average (of which there are many types to choose from) so that you can use this as a "two lines cross" indicator, as well as a "mid-line cross" indicator.
I added Bollinger Bands (primarily for when "range" is turned off, but if you want to use the Bands with it in fixed range mode too, that's fine. You do you.).
I added candle coloring for both ways of using this indicator:
In rangebound mode there is overbought and oversold coloring, as well as bullish (ADP above the MA and median) and bearish (ADP below the MA and median), and neutral (ADP is above the MA but below the median, or below the MA and above the median). With range turned off there is no overbought or oversold of course. Above the MA and median is bullish, below both is bearish, and neutral covers that grey area where it's neither one nor the other.
The indicator itself is also colored in the same way the candles are. The MA and BBands are biased colored as well (green/red).
Alerts for pretty much every condition imaginable.
Please note in the image above the indicator is pretty gaudy. I don't use it like that, and you can turn a lot of that stuff off (lines, shading, etc.). That is just the default settings.
Like I said, I think Bollinger Bands make most sense if you have it set to range off, but they could be useful either way. Depends on you, the trader.
The candle color is 100% based on the moving average, so if you are using the BBands, set your MA to the default 20 SMA because that's what BBands use for the basis. If you just turn off the MA, whatever it is set to the indicator will still see that and use it (unless you turn off candle colors) to color the candles.
Above is the same image, but just with range turned off, and the Bollinger Bands turned off.
That's all. Hope you like this! It's becoming a favorite of mine, and a lot of what I've implemented here will be added to my previously released indicators, as well as any new ones.

Dziwne MFI Overlay (with highlight)It is simply your traditional MFI , except that your 50 line became the actual price.
Why and how could it be useful? This indicator helps to spot more easily and efficiently divergences .
You could also use it for trend reversals as you usually do with your 50 line, but I would suggest to set a higher length for the MFI, like 155 or something like that.

ArtY Money Flow IndexThis is modification of built-in Money Flow Index with painting of oversold and overbought areas.

GOD's EYEGet to know when to accumulate when biggies are buying and when to stay away from the stock

Money Flow Index (MFI)User request. A tuned version of the built-in True Strength Index (TSI) indicator with the following options included:
MFI - Signal Histogram
MFI/Signal Crossovers
MFI/Signal Ribbon
Bands breakouts highlighting
Middle line crossovers background

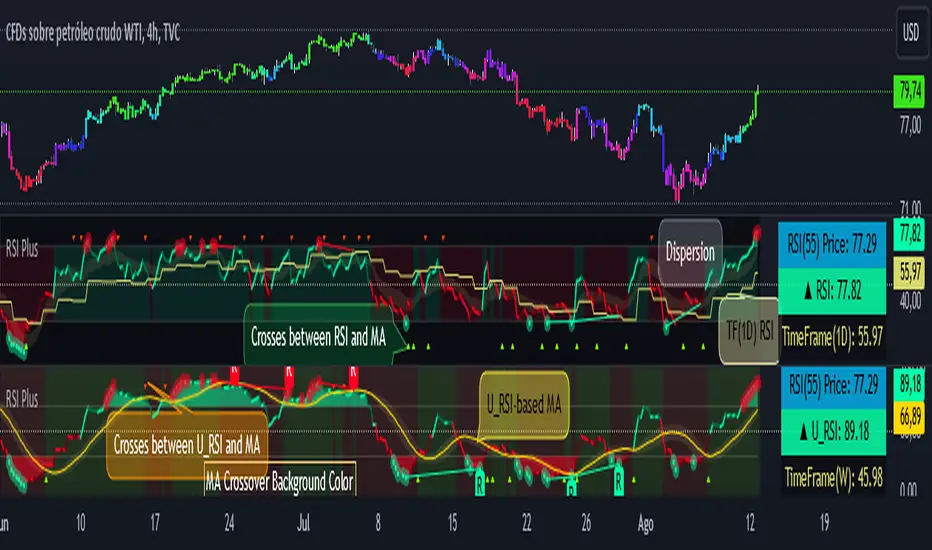
RSI PlusRSI Plus:
☑️ Show the divergences.
☑️ Shows the approximate price of an RSI level (by default it is level 55 but it can be changed for any other level).
☑️ Shows the bulls and bears zones, in green when crossing level 50 up and red when crossing down.
☑️ Circle the highest and lowest levels as possible purchases and sales.
☑️ Includes a smoothed RSI.
RSI Plus:
☑️ Muestra las divergencias.
☑️ Muestra el precio aproximado de un nivel del RSI (por defecto viene el nivel 55 pero se lo puede cambiar por cualquier otro nivel).
☑️ Muestra la zonas de toros y osos, en verde cuando cruza hacia arriba el nivel 50 y rojo cuando cruza hacia abajo.
☑️ Marca con un circulo los niveles mas alto y mas bajos como posibles compras y ventas.
☑️ Incluye un RSI suavizado.
Griffin Money Flow IndexThis is a modification of the commonly used money flow index. The major change is to the way the average price is calculated. Typically this is done with a hlc3 method,
meaning the average of the period high, low, and closing prices. This calculation infers that volume is evenly distributed between those three points. Generally this is not the case.
My version calculates the average price by including the open price and making the assumption that the majority of the volume occurs within the body of the candle, between
the open and close. I calculate a weighted average that places more significance on the close and open, then an equal weighting on the high and low.
In general this will result in a trend that does not differ greatly from the regular MFI calculation however there may be subtle changes.

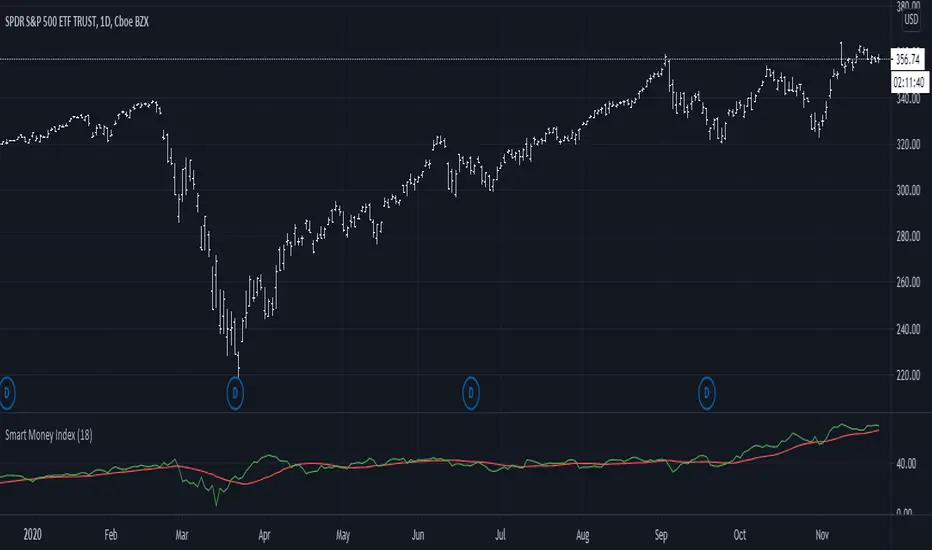
Smart Money Index (SMI)It came to my attention that one very common implementation of SMI was incorrect; rather than subtracting the first hour delta and adding the last hour delta it subtracts the whole day delta and adds the last 30m delta. While this indicator might have had some use, it is not what I understand to be the actual Smart Money Index and so I post this as a correction for use in other scripts.
MFI & EMA & Bollinger BandsIn this script
I combined the various of the oscillator
MFI ( Money Flow Index ) with BB ( Bollinger Bands ).
As the MFI crosses the BB base, a green / red point is formed accordingly.
As a sign it is possible to continue up / down.
I added EMA8 to MFI (style circles)
When the oscillator is above the EMA - it is possible that this is a clear sign of an increase.
Band 50 was also added to facilitate the calculations.

DAX Money FlowMoney Flow (MFL of MFI) indicator for the DAX index, which works on the hourly timeframe.
In order for this indicator to work for you, you must have access to the Xetra (XETR:DAX) tickers, where the underlying stocks of DAX are trading.
For some reason Xetra does NOT provide hourly volume so you can't see the money flow using the built-in TradingView indicator. But now, with this indicator, you can! :)

MF RSIUsing built-in code from Divergence Indicator I've created the MF RSI indicator.
A great way to combine two great indicators and divergence.
A alert condition is available on a potential reversal MFI crosses RSI on overbought or oversold.