GKD-C Blau Composite High-Low Momentum [Loxx]Giga Kaleidoscope GKD-C Blau Composite High-Low Momentum is a Confirmation module included in Loxx's "Giga Kaleidoscope Modularized Trading System".
█ Giga Kaleidoscope Modularized Trading System
What is Loxx's "Giga Kaleidoscope Modularized Trading System"?
The Giga Kaleidoscope Modularized Trading System is a trading system built on the philosophy of the NNFX (No Nonsense Forex) algorithmic trading.
What is the NNFX algorithmic trading strategy?
The NNFX (No-Nonsense Forex) trading system is a comprehensive approach to Forex trading that is designed to simplify the process and remove the confusion and complexity that often surrounds trading. The system was developed by a Forex trader who goes by the pseudonym "VP" and has gained a significant following in the Forex community.
The NNFX trading system is based on a set of rules and guidelines that help traders make objective and informed decisions. These rules cover all aspects of trading, including market analysis, trade entry, stop loss placement, and trade management.
Here are the main components of the NNFX trading system:
1. Trading Philosophy: The NNFX trading system is based on the idea that successful trading requires a comprehensive understanding of the market, objective analysis, and strict risk management. The system aims to remove subjective elements from trading and focuses on objective rules and guidelines.
2. Technical Analysis: The NNFX trading system relies heavily on technical analysis and uses a range of indicators to identify high-probability trading opportunities. The system uses a combination of trend-following and mean-reverting strategies to identify trades.
3. Market Structure: The NNFX trading system emphasizes the importance of understanding the market structure, including price action, support and resistance levels, and market cycles. The system uses a range of tools to identify the market structure, including trend lines, channels, and moving averages.
4. Trade Entry: The NNFX trading system has strict rules for trade entry. The system uses a combination of technical indicators to identify high-probability trades, and traders must meet specific criteria to enter a trade.
5. Stop Loss Placement: The NNFX trading system places a significant emphasis on risk management and requires traders to place a stop loss order on every trade. The system uses a combination of technical analysis and market structure to determine the appropriate stop loss level.
6. Trade Management: The NNFX trading system has specific rules for managing open trades. The system aims to minimize risk and maximize profit by using a combination of trailing stops, take profit levels, and position sizing.
Overall, the NNFX trading system is designed to be a straightforward and easy-to-follow approach to Forex trading that can be applied by traders of all skill levels.
Core components of an NNFX algorithmic trading strategy
The NNFX algorithm is built on the principles of trend, momentum, and volatility. There are six core components in the NNFX trading algorithm:
1. Volatility - price volatility; e.g., Average True Range, True Range Double, Close-to-Close, etc.
2. Baseline - a moving average to identify price trend
3. Confirmation 1 - a technical indicator used to identify trends
4. Confirmation 2 - a technical indicator used to identify trends
5. Continuation - a technical indicator used to identify trends
6. Volatility/Volume - a technical indicator used to identify volatility/volume breakouts/breakdown
7. Exit - a technical indicator used to determine when a trend is exhausted
What is Volatility in the NNFX trading system?
In the NNFX (No Nonsense Forex) trading system, ATR (Average True Range) is typically used to measure the volatility of an asset. It is used as a part of the system to help determine the appropriate stop loss and take profit levels for a trade. ATR is calculated by taking the average of the true range values over a specified period.
True range is calculated as the maximum of the following values:
-Current high minus the current low
-Absolute value of the current high minus the previous close
-Absolute value of the current low minus the previous close
ATR is a dynamic indicator that changes with changes in volatility. As volatility increases, the value of ATR increases, and as volatility decreases, the value of ATR decreases. By using ATR in NNFX system, traders can adjust their stop loss and take profit levels according to the volatility of the asset being traded. This helps to ensure that the trade is given enough room to move, while also minimizing potential losses.
Other types of volatility include True Range Double (TRD), Close-to-Close, and Garman-Klass
What is a Baseline indicator?
The baseline is essentially a moving average, and is used to determine the overall direction of the market.
The baseline in the NNFX system is used to filter out trades that are not in line with the long-term trend of the market. The baseline is plotted on the chart along with other indicators, such as the Moving Average (MA), the Relative Strength Index (RSI), and the Average True Range (ATR).
Trades are only taken when the price is in the same direction as the baseline. For example, if the baseline is sloping upwards, only long trades are taken, and if the baseline is sloping downwards, only short trades are taken. This approach helps to ensure that trades are in line with the overall trend of the market, and reduces the risk of entering trades that are likely to fail.
By using a baseline in the NNFX system, traders can have a clear reference point for determining the overall trend of the market, and can make more informed trading decisions. The baseline helps to filter out noise and false signals, and ensures that trades are taken in the direction of the long-term trend.
What is a Confirmation indicator?
Confirmation indicators are technical indicators that are used to confirm the signals generated by primary indicators. Primary indicators are the core indicators used in the NNFX system, such as the Average True Range (ATR), the Moving Average (MA), and the Relative Strength Index (RSI).
The purpose of the confirmation indicators is to reduce false signals and improve the accuracy of the trading system. They are designed to confirm the signals generated by the primary indicators by providing additional information about the strength and direction of the trend.
Some examples of confirmation indicators that may be used in the NNFX system include the Bollinger Bands, the MACD (Moving Average Convergence Divergence), and the MACD Oscillator. These indicators can provide information about the volatility, momentum, and trend strength of the market, and can be used to confirm the signals generated by the primary indicators.
In the NNFX system, confirmation indicators are used in combination with primary indicators and other filters to create a trading system that is robust and reliable. By using multiple indicators to confirm trading signals, the system aims to reduce the risk of false signals and improve the overall profitability of the trades.
What is a Continuation indicator?
In the NNFX (No Nonsense Forex) trading system, a continuation indicator is a technical indicator that is used to confirm a current trend and predict that the trend is likely to continue in the same direction. A continuation indicator is typically used in conjunction with other indicators in the system, such as a baseline indicator, to provide a comprehensive trading strategy.
What is a Volatility/Volume indicator?
Volume indicators, such as the On Balance Volume (OBV), the Chaikin Money Flow (CMF), or the Volume Price Trend (VPT), are used to measure the amount of buying and selling activity in a market. They are based on the trading volume of the market, and can provide information about the strength of the trend. In the NNFX system, volume indicators are used to confirm trading signals generated by the Moving Average and the Relative Strength Index. Volatility indicators include Average Direction Index, Waddah Attar, and Volatility Ratio. In the NNFX trading system, volatility is a proxy for volume and vice versa.
By using volume indicators as confirmation tools, the NNFX trading system aims to reduce the risk of false signals and improve the overall profitability of trades. These indicators can provide additional information about the market that is not captured by the primary indicators, and can help traders to make more informed trading decisions. In addition, volume indicators can be used to identify potential changes in market trends and to confirm the strength of price movements.
What is an Exit indicator?
The exit indicator is used in conjunction with other indicators in the system, such as the Moving Average (MA), the Relative Strength Index (RSI), and the Average True Range (ATR), to provide a comprehensive trading strategy.
The exit indicator in the NNFX system can be any technical indicator that is deemed effective at identifying optimal exit points. Examples of exit indicators that are commonly used include the Parabolic SAR, the Average Directional Index (ADX), and the Chandelier Exit.
The purpose of the exit indicator is to identify when a trend is likely to reverse or when the market conditions have changed, signaling the need to exit a trade. By using an exit indicator, traders can manage their risk and prevent significant losses.
In the NNFX system, the exit indicator is used in conjunction with a stop loss and a take profit order to maximize profits and minimize losses. The stop loss order is used to limit the amount of loss that can be incurred if the trade goes against the trader, while the take profit order is used to lock in profits when the trade is moving in the trader's favor.
Overall, the use of an exit indicator in the NNFX trading system is an important component of a comprehensive trading strategy. It allows traders to manage their risk effectively and improve the profitability of their trades by exiting at the right time.
How does Loxx's GKD (Giga Kaleidoscope Modularized Trading System) implement the NNFX algorithm outlined above?
Loxx's GKD v1.0 system has five types of modules (indicators/strategies). These modules are:
1. GKD-BT - Backtesting module (Volatility, Number 1 in the NNFX algorithm)
2. GKD-B - Baseline module (Baseline and Volatility/Volume, Numbers 1 and 2 in the NNFX algorithm)
3. GKD-C - Confirmation 1/2 and Continuation module (Confirmation 1/2 and Continuation, Numbers 3, 4, and 5 in the NNFX algorithm)
4. GKD-V - Volatility/Volume module (Confirmation 1/2, Number 6 in the NNFX algorithm)
5. GKD-E - Exit module (Exit, Number 7 in the NNFX algorithm)
(additional module types will added in future releases)
Each module interacts with every module by passing data between modules. Data is passed between each module as described below:
GKD-B => GKD-V => GKD-C(1) => GKD-C(2) => GKD-C(Continuation) => GKD-E => GKD-BT
That is, the Baseline indicator passes its data to Volatility/Volume. The Volatility/Volume indicator passes its values to the Confirmation 1 indicator. The Confirmation 1 indicator passes its values to the Confirmation 2 indicator. The Confirmation 2 indicator passes its values to the Continuation indicator. The Continuation indicator passes its values to the Exit indicator, and finally, the Exit indicator passes its values to the Backtest strategy.
This chaining of indicators requires that each module conform to Loxx's GKD protocol, therefore allowing for the testing of every possible combination of technical indicators that make up the six components of the NNFX algorithm.
What does the application of the GKD trading system look like?
Example trading system:
Backtest: Strategy with 1-3 take profits, trailing stop loss, multiple types of PnL volatility, and 2 backtesting styles
Baseline: Hull Moving Average
Volatility/Volume: Hurst Exponent
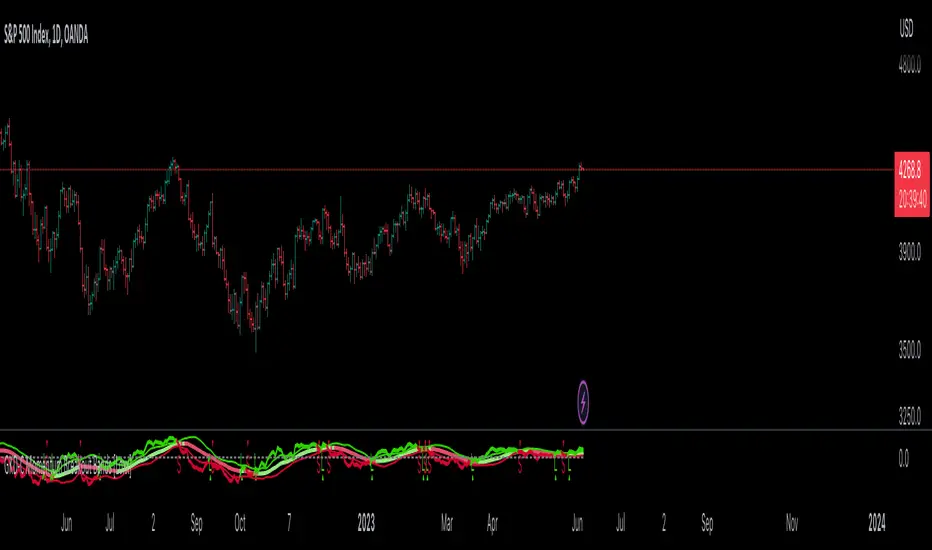
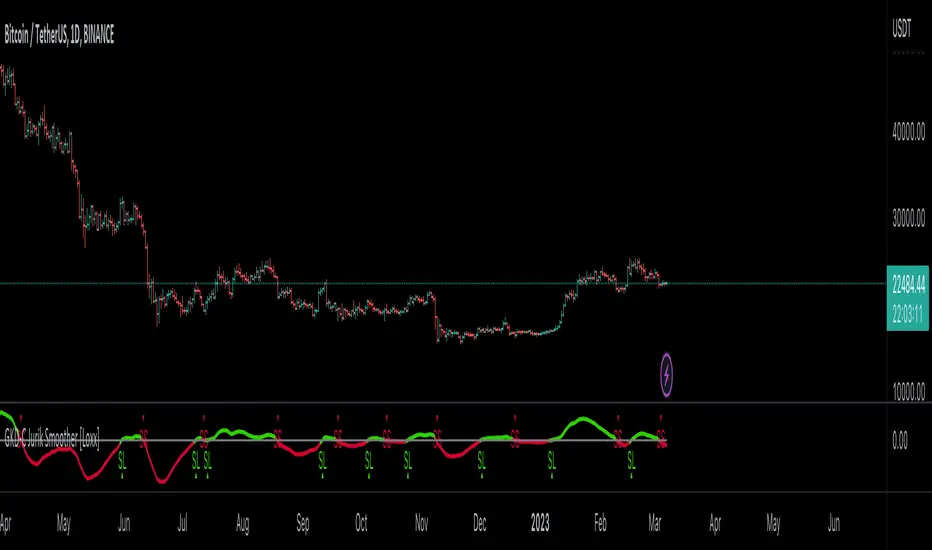
Confirmation 1: Blau Composite High-Low Momentum as shown on the chart above
Confirmation 2: Williams Percent Range
Continuation: Fisher Transform
Exit: Rex Oscillator
Each GKD indicator is denoted with a module identifier of either: GKD-BT, GKD-B, GKD-C, GKD-V, or GKD-E. This allows traders to understand to which module each indicator belongs and where each indicator fits into the GKD protocol chain.
Giga Kaleidoscope Modularized Trading System Signals (based on the NNFX algorithm)
Standard Entry
1. GKD-C Confirmation 1 Signal
2. GKD-B Baseline agrees
3. Price is within a range of 0.2x Volatility and 1.0x Volatility of the Goldie Locks Mean
4. GKD-C Confirmation 2 agrees
5. GKD-V Volatility/Volume agrees
Baseline Entry
1. GKD-B Baseline signal
2. GKD-C Confirmation 1 agrees
3. Price is within a range of 0.2x Volatility and 1.0x Volatility of the Goldie Locks Mean
4. GKD-C Confirmation 2 agrees
5. GKD-V Volatility/Volume agrees
6. GKD-C Confirmation 1 signal was less than 7 candles prior
Continuation Entry
1. Standard Entry, Baseline Entry, or Pullback; entry triggered previously
2. GKD-B Baseline hasn't crossed since entry signal trigger
3. GKD-C Confirmation Continuation Indicator signals
4. GKD-C Confirmation 1 agrees
5. GKD-B Baseline agrees
6. GKD-C Confirmation 2 agrees
1-Candle Rule Standard Entry
1. GKD-C Confirmation 1 signal
2. GKD-B Baseline agrees
3. Price is within a range of 0.2x Volatility and 1.0x Volatility of the Goldie Locks Mean
Next Candle:
1. Price retraced (Long: close < close or Short: close > close )
2. GKD-B Baseline agrees
3. GKD-C Confirmation 1 agrees
4. GKD-C Confirmation 2 agrees
5. GKD-V Volatility/Volume agrees
1-Candle Rule Baseline Entry
1. GKD-B Baseline signal
2. GKD-C Confirmation 1 agrees
3. Price is within a range of 0.2x Volatility and 1.0x Volatility of the Goldie Locks Mean
4. GKD-C Confirmation 1 signal was less than 7 candles prior
Next Candle:
1. Price retraced (Long: close < close or Short: close > close )
2. GKD-B Baseline agrees
3. GKD-C Confirmation 1 agrees
4. GKD-C Confirmation 2 agrees
5. GKD-V Volatility/Volume Agrees
PullBack Entry
1. GKD-B Baseline signal
2. GKD-C Confirmation 1 agrees
3. Price is beyond 1.0x Volatility of Baseline
Next Candle:
1. Price is within a range of 0.2x Volatility and 1.0x Volatility of the Goldie Locks Mean
3. GKD-C Confirmation 1 agrees
4. GKD-C Confirmation 2 agrees
5. GKD-V Volatility/Volume Agrees
█ GKD-C Blau Composite High-Low Momentum
What is the Blau Composite High-Low Momentum?
The Composite High/Low Momentum (HLM) Blau HLM is a technical analysis tool that is used to analyze the momentum of a financial instrument. Developed by William Blau, the HLM is a unique indicator that combines both price and volume data to provide a comprehensive picture of market trends and momentum.
The HLM is based on the concept of price momentum, which is the tendency of a financial instrument to continue moving in the same direction that it has been moving. Momentum is a key indicator for traders, as it can help to identify trends and potential changes in trend.
The HLM is calculated by comparing the current price of a financial instrument to its highest and lowest prices over a specified period of time. This calculation is then combined with a measure of volume, which is used to provide additional insight into market trends and momentum.
The HLM is designed to be highly responsive to changes in market conditions, providing traders with a more accurate and timely picture of market trends. The indicator is also highly customizable, allowing traders to adjust the parameters to suit their individual trading styles and preferences.
One of the key benefits of the HLM is its ability to provide early warning signs of potential trend changes. By analyzing both price and volume data, the HLM is able to identify shifts in market momentum that may indicate a potential reversal in trend.
Overall, the Composite High/Low Momentum Blau HLM is a powerful technical analysis tool that can provide traders with valuable insights into market trends and momentum. While it may require some knowledge of technical analysis to use effectively, the HLM can be a valuable tool for traders looking to make informed trading decisions.
Requirements
Inputs
Confirmation 1 and Solo Confirmation: GKD-V Volatility / Volume indicator
Confirmation 2: GKD-C Confirmation indicator
Outputs
Confirmation 2 and Solo Confirmation Complex: GKD-E Exit indicator
Confirmation 1: GKD-C Confirmation indicator
Continuation: GKD-E Exit indicator
Solo Confirmation Simple: GKD-BT Backtest strategy
Additional features will be added in future releases.
Indicador momentum (MOM)

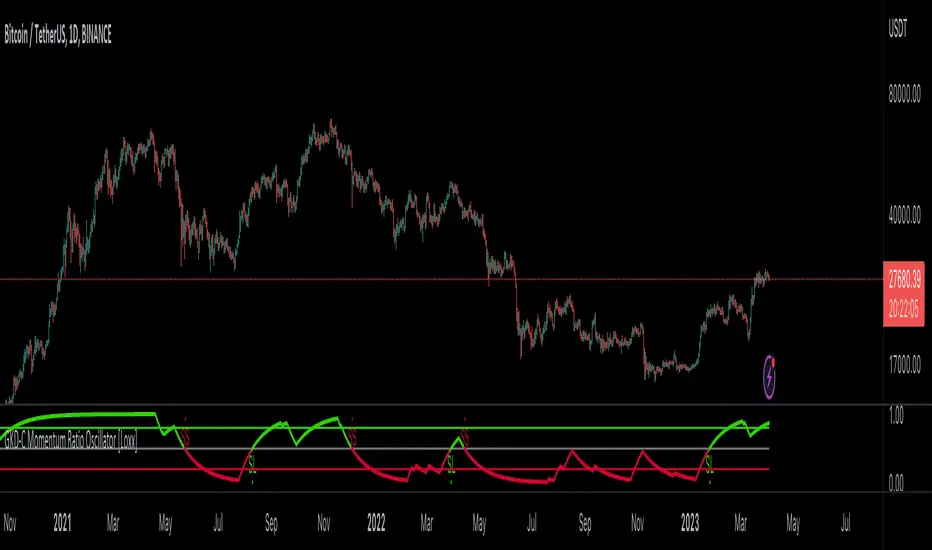
GKD-C Momentum Ratio Oscillator [Loxx]Giga Kaleidoscope GKD-C Momentum Ratio Oscillator is a Confirmation module included in Loxx's "Giga Kaleidoscope Modularized Trading System".
█ Giga Kaleidoscope Modularized Trading System
What is Loxx's "Giga Kaleidoscope Modularized Trading System"?
The Giga Kaleidoscope Modularized Trading System is a trading system built on the philosophy of the NNFX (No Nonsense Forex) algorithmic trading.
What is the NNFX algorithmic trading strategy?
The NNFX (No-Nonsense Forex) trading system is a comprehensive approach to Forex trading that is designed to simplify the process and remove the confusion and complexity that often surrounds trading. The system was developed by a Forex trader who goes by the pseudonym "VP" and has gained a significant following in the Forex community.
The NNFX trading system is based on a set of rules and guidelines that help traders make objective and informed decisions. These rules cover all aspects of trading, including market analysis, trade entry, stop loss placement, and trade management.
Here are the main components of the NNFX trading system:
1. Trading Philosophy: The NNFX trading system is based on the idea that successful trading requires a comprehensive understanding of the market, objective analysis, and strict risk management. The system aims to remove subjective elements from trading and focuses on objective rules and guidelines.
2. Technical Analysis: The NNFX trading system relies heavily on technical analysis and uses a range of indicators to identify high-probability trading opportunities. The system uses a combination of trend-following and mean-reverting strategies to identify trades.
3. Market Structure: The NNFX trading system emphasizes the importance of understanding the market structure, including price action, support and resistance levels, and market cycles. The system uses a range of tools to identify the market structure, including trend lines, channels, and moving averages.
4. Trade Entry: The NNFX trading system has strict rules for trade entry. The system uses a combination of technical indicators to identify high-probability trades, and traders must meet specific criteria to enter a trade.
5. Stop Loss Placement: The NNFX trading system places a significant emphasis on risk management and requires traders to place a stop loss order on every trade. The system uses a combination of technical analysis and market structure to determine the appropriate stop loss level.
6. Trade Management: The NNFX trading system has specific rules for managing open trades. The system aims to minimize risk and maximize profit by using a combination of trailing stops, take profit levels, and position sizing.
Overall, the NNFX trading system is designed to be a straightforward and easy-to-follow approach to Forex trading that can be applied by traders of all skill levels.
Core components of an NNFX algorithmic trading strategy
The NNFX algorithm is built on the principles of trend, momentum, and volatility. There are six core components in the NNFX trading algorithm:
1. Volatility - price volatility; e.g., Average True Range, True Range Double, Close-to-Close, etc.
2. Baseline - a moving average to identify price trend
3. Confirmation 1 - a technical indicator used to identify trends
4. Confirmation 2 - a technical indicator used to identify trends
5. Continuation - a technical indicator used to identify trends
6. Volatility/Volume - a technical indicator used to identify volatility/volume breakouts/breakdown
7. Exit - a technical indicator used to determine when a trend is exhausted
What is Volatility in the NNFX trading system?
In the NNFX (No Nonsense Forex) trading system, ATR (Average True Range) is typically used to measure the volatility of an asset. It is used as a part of the system to help determine the appropriate stop loss and take profit levels for a trade. ATR is calculated by taking the average of the true range values over a specified period.
True range is calculated as the maximum of the following values:
-Current high minus the current low
-Absolute value of the current high minus the previous close
-Absolute value of the current low minus the previous close
ATR is a dynamic indicator that changes with changes in volatility. As volatility increases, the value of ATR increases, and as volatility decreases, the value of ATR decreases. By using ATR in NNFX system, traders can adjust their stop loss and take profit levels according to the volatility of the asset being traded. This helps to ensure that the trade is given enough room to move, while also minimizing potential losses.
Other types of volatility include True Range Double (TRD), Close-to-Close, and Garman-Klass
What is a Baseline indicator?
The baseline is essentially a moving average, and is used to determine the overall direction of the market.
The baseline in the NNFX system is used to filter out trades that are not in line with the long-term trend of the market. The baseline is plotted on the chart along with other indicators, such as the Moving Average (MA), the Relative Strength Index (RSI), and the Average True Range (ATR).
Trades are only taken when the price is in the same direction as the baseline. For example, if the baseline is sloping upwards, only long trades are taken, and if the baseline is sloping downwards, only short trades are taken. This approach helps to ensure that trades are in line with the overall trend of the market, and reduces the risk of entering trades that are likely to fail.
By using a baseline in the NNFX system, traders can have a clear reference point for determining the overall trend of the market, and can make more informed trading decisions. The baseline helps to filter out noise and false signals, and ensures that trades are taken in the direction of the long-term trend.
What is a Confirmation indicator?
Confirmation indicators are technical indicators that are used to confirm the signals generated by primary indicators. Primary indicators are the core indicators used in the NNFX system, such as the Average True Range (ATR), the Moving Average (MA), and the Relative Strength Index (RSI).
The purpose of the confirmation indicators is to reduce false signals and improve the accuracy of the trading system. They are designed to confirm the signals generated by the primary indicators by providing additional information about the strength and direction of the trend.
Some examples of confirmation indicators that may be used in the NNFX system include the Bollinger Bands, the MACD (Moving Average Convergence Divergence), and the MACD Oscillator. These indicators can provide information about the volatility, momentum, and trend strength of the market, and can be used to confirm the signals generated by the primary indicators.
In the NNFX system, confirmation indicators are used in combination with primary indicators and other filters to create a trading system that is robust and reliable. By using multiple indicators to confirm trading signals, the system aims to reduce the risk of false signals and improve the overall profitability of the trades.
What is a Continuation indicator?
In the NNFX (No Nonsense Forex) trading system, a continuation indicator is a technical indicator that is used to confirm a current trend and predict that the trend is likely to continue in the same direction. A continuation indicator is typically used in conjunction with other indicators in the system, such as a baseline indicator, to provide a comprehensive trading strategy.
What is a Volatility/Volume indicator?
Volume indicators, such as the On Balance Volume (OBV), the Chaikin Money Flow (CMF), or the Volume Price Trend (VPT), are used to measure the amount of buying and selling activity in a market. They are based on the trading volume of the market, and can provide information about the strength of the trend. In the NNFX system, volume indicators are used to confirm trading signals generated by the Moving Average and the Relative Strength Index. Volatility indicators include Average Direction Index, Waddah Attar, and Volatility Ratio. In the NNFX trading system, volatility is a proxy for volume and vice versa.
By using volume indicators as confirmation tools, the NNFX trading system aims to reduce the risk of false signals and improve the overall profitability of trades. These indicators can provide additional information about the market that is not captured by the primary indicators, and can help traders to make more informed trading decisions. In addition, volume indicators can be used to identify potential changes in market trends and to confirm the strength of price movements.
What is an Exit indicator?
The exit indicator is used in conjunction with other indicators in the system, such as the Moving Average (MA), the Relative Strength Index (RSI), and the Average True Range (ATR), to provide a comprehensive trading strategy.
The exit indicator in the NNFX system can be any technical indicator that is deemed effective at identifying optimal exit points. Examples of exit indicators that are commonly used include the Parabolic SAR, the Average Directional Index (ADX), and the Chandelier Exit.
The purpose of the exit indicator is to identify when a trend is likely to reverse or when the market conditions have changed, signaling the need to exit a trade. By using an exit indicator, traders can manage their risk and prevent significant losses.
In the NNFX system, the exit indicator is used in conjunction with a stop loss and a take profit order to maximize profits and minimize losses. The stop loss order is used to limit the amount of loss that can be incurred if the trade goes against the trader, while the take profit order is used to lock in profits when the trade is moving in the trader's favor.
Overall, the use of an exit indicator in the NNFX trading system is an important component of a comprehensive trading strategy. It allows traders to manage their risk effectively and improve the profitability of their trades by exiting at the right time.
How does Loxx's GKD (Giga Kaleidoscope Modularized Trading System) implement the NNFX algorithm outlined above?
Loxx's GKD v1.0 system has five types of modules (indicators/strategies). These modules are:
1. GKD-BT - Backtesting module (Volatility, Number 1 in the NNFX algorithm)
2. GKD-B - Baseline module (Baseline and Volatility/Volume, Numbers 1 and 2 in the NNFX algorithm)
3. GKD-C - Confirmation 1/2 and Continuation module (Confirmation 1/2 and Continuation, Numbers 3, 4, and 5 in the NNFX algorithm)
4. GKD-V - Volatility/Volume module (Confirmation 1/2, Number 6 in the NNFX algorithm)
5. GKD-E - Exit module (Exit, Number 7 in the NNFX algorithm)
(additional module types will added in future releases)
Each module interacts with every module by passing data between modules. Data is passed between each module as described below:
GKD-B => GKD-V => GKD-C(1) => GKD-C(2) => GKD-C(Continuation) => GKD-E => GKD-BT
That is, the Baseline indicator passes its data to Volatility/Volume. The Volatility/Volume indicator passes its values to the Confirmation 1 indicator. The Confirmation 1 indicator passes its values to the Confirmation 2 indicator. The Confirmation 2 indicator passes its values to the Continuation indicator. The Continuation indicator passes its values to the Exit indicator, and finally, the Exit indicator passes its values to the Backtest strategy.
This chaining of indicators requires that each module conform to Loxx's GKD protocol, therefore allowing for the testing of every possible combination of technical indicators that make up the six components of the NNFX algorithm.
What does the application of the GKD trading system look like?
Example trading system:
Backtest: Strategy with 1-3 take profits, trailing stop loss, multiple types of PnL volatility, and 2 backtesting styles
Baseline: Hull Moving Average
Volatility/Volume: Hurst Exponent
Confirmation 1: Momentum Ratio Oscillator as shown on the chart above
Confirmation 2: Williams Percent Range
Continuation: Fisher Transform
Exit: Rex Oscillator
Each GKD indicator is denoted with a module identifier of either: GKD-BT, GKD-B, GKD-C, GKD-V, or GKD-E. This allows traders to understand to which module each indicator belongs and where each indicator fits into the GKD protocol chain.
Giga Kaleidoscope Modularized Trading System Signals (based on the NNFX algorithm)
Standard Entry
1. GKD-C Confirmation 1 Signal
2. GKD-B Baseline agrees
3. Price is within a range of 0.2x Volatility and 1.0x Volatility of the Goldie Locks Mean
4. GKD-C Confirmation 2 agrees
5. GKD-V Volatility/Volume agrees
Baseline Entry
1. GKD-B Baseline signal
2. GKD-C Confirmation 1 agrees
3. Price is within a range of 0.2x Volatility and 1.0x Volatility of the Goldie Locks Mean
4. GKD-C Confirmation 2 agrees
5. GKD-V Volatility/Volume agrees
6. GKD-C Confirmation 1 signal was less than 7 candles prior
Continuation Entry
1. Standard Entry, Baseline Entry, or Pullback; entry triggered previously
2. GKD-B Baseline hasn't crossed since entry signal trigger
3. GKD-C Confirmation Continuation Indicator signals
4. GKD-C Confirmation 1 agrees
5. GKD-B Baseline agrees
6. GKD-C Confirmation 2 agrees
1-Candle Rule Standard Entry
1. GKD-C Confirmation 1 signal
2. GKD-B Baseline agrees
3. Price is within a range of 0.2x Volatility and 1.0x Volatility of the Goldie Locks Mean
Next Candle:
1. Price retraced (Long: close < close or Short: close > close )
2. GKD-B Baseline agrees
3. GKD-C Confirmation 1 agrees
4. GKD-C Confirmation 2 agrees
5. GKD-V Volatility/Volume agrees
1-Candle Rule Baseline Entry
1. GKD-B Baseline signal
2. GKD-C Confirmation 1 agrees
3. Price is within a range of 0.2x Volatility and 1.0x Volatility of the Goldie Locks Mean
4. GKD-C Confirmation 1 signal was less than 7 candles prior
Next Candle:
1. Price retraced (Long: close < close or Short: close > close )
2. GKD-B Baseline agrees
3. GKD-C Confirmation 1 agrees
4. GKD-C Confirmation 2 agrees
5. GKD-V Volatility/Volume Agrees
PullBack Entry
1. GKD-B Baseline signal
2. GKD-C Confirmation 1 agrees
3. Price is beyond 1.0x Volatility of Baseline
Next Candle:
1. Price is within a range of 0.2x Volatility and 1.0x Volatility of the Goldie Locks Mean
3. GKD-C Confirmation 1 agrees
4. GKD-C Confirmation 2 agrees
5. GKD-V Volatility/Volume Agrees
█ GKD-C Momentum Ratio Oscillator
What is an EMA?
EMA stands for Exponential Moving Average , which is a type of moving average that is commonly used in technical analysis to smooth out price data and identify trends.
In a simple moving average ( SMA ), each data point is given equal weight when calculating the average. For example, if you are calculating the 10-day SMA , you would add up the prices for the past 10 days and divide by 10 to get the average. In contrast, in an EMA , more weight is given to recent prices, while older prices are given less weight.
The formula for calculating an EMA involves using a smoothing factor that is multiplied by the difference between the current price and the previous EMA value, and then adding this to the previous EMA value. The smoothing factor is typically calculated based on the length of the EMA being used. For example, a 10-day EMA might use a smoothing factor of 2/(10+1) or 0.1818.
The result of using an EMA is that the line produced is more responsive to recent price changes than a simple moving average . This makes it useful for identifying short-term trends and potential trend reversals. However, it can also be more volatile and prone to whipsaws, so it is often used in combination with other indicators to confirm signals.
Overall, the EMA is a widely used and versatile tool in technical analysis , and its effectiveness depends on the specific context in which it is applied.
What is Momentum?
In technical analysis , momentum refers to the rate of change of an asset's price over a certain period of time. It is often used to identify trends and potential trend reversals in financial markets.
Momentum is calculated by subtracting the closing price of an asset X days ago from its current closing price, where X is the number of days being used for the calculation. The result is the momentum value for that particular day. A positive momentum value suggests that prices are increasing, while a negative value indicates that prices are decreasing.
Traders use momentum in a variety of ways. One common approach is to look for divergences between the momentum indicator and the price of the asset being traded. For example, if an asset's price is trending upwards but its momentum is trending downwards, this could be a sign of a potential trend reversal.
Another popular strategy is to use momentum to identify overbought and oversold conditions in the market. When an asset's price has been rising rapidly and its momentum is high, it may be considered overbought and due for a correction. Conversely, when an asset's price has been falling rapidly and its momentum is low, it may be considered oversold and due for a bounce back up.
Momentum is also often used in conjunction with other technical indicators, such as moving averages or Bollinger Bands , to confirm signals and improve the accuracy of trading decisions.
Overall, momentum is a useful tool for traders and investors to analyze price movements and identify potential trading opportunities. However, like all technical indicators, it should be used in conjunction with other forms of analysis and with consideration of the broader market context.
What is Momentum Ratio Oscillator?
The theory behind this indicator involves utilizing a sequence of exponential moving average ( EMA ) calculations to achieve a smoother value of momentum ratio, which compares the current value to the previous one. Although this results in an outcome similar to that of some pre-existing indicators (such as volume zone or price zone oscillators), the use of EMA for smoothing is what sets it apart. EMA produces a smooth step-like output when values undergo sudden changes, whereas the mathematics used for those other indicators are completely distinct. This is a concept by the beloved Mladen of FX forums.
To utilize this version of the indicator, you have the option of using either levels, middle, or signal crosses for signals. The indicator is range bound from 0 to 1.
Requirements
Inputs
Confirmation 1 and Solo Confirmation: GKD-V Volatility / Volume indicator
Confirmation 2: GKD-C Confirmation indicator
Outputs
Confirmation 2 and Solo Confirmation Complex: GKD-E Exit indicator
Confirmation 1: GKD-C Confirmation indicator
Continuation: GKD-E Exit indicator
Solo Confirmation Simple: GKD-BT Backtest strategy
Additional features will be added in future releases.
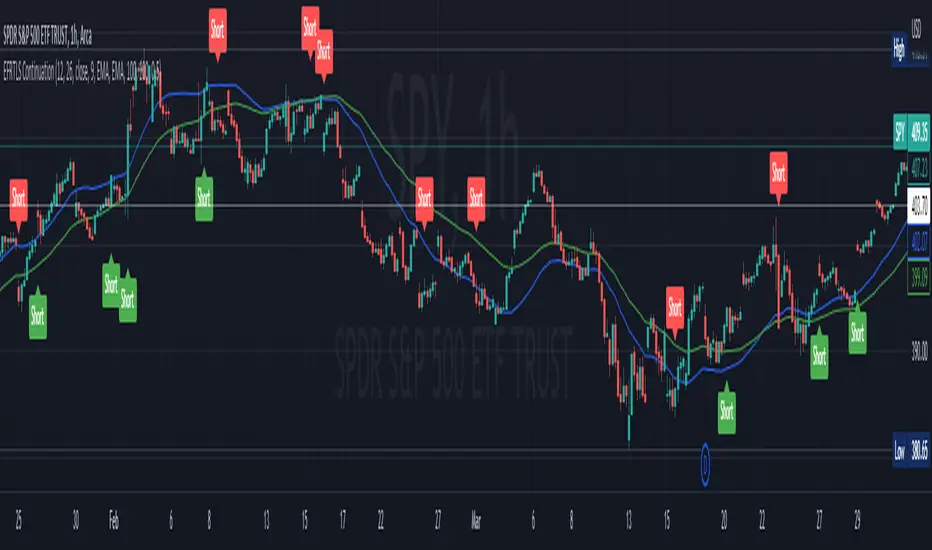
Effortless ContinuationIntroduction:
The Effortless Continuation Indicator is a technical analysis tool designed for traders to identify potential buy and sell signals in the market. This indicator combines three popular technical indicators - Moving Average Convergence Divergence (MACD), Triple Exponential Moving Average (TEMA), and Double Exponential Moving Average (DEMA) - to generate buy and sell signals. It is suitable for use on any time frame, from intraday trading to swing trading and longer-term investing.
Indicator Components:
The indicator comprises of three main components: MACD, TEMA, and DEMA.
Moving Average Convergence Divergence (MACD):
The MACD is a momentum indicator that measures the difference between two moving averages of the price of an asset. It is calculated by subtracting the 26-period Exponential Moving Average (EMA) from the 12-period EMA. The MACD line is used to identify changes in momentum, trends, and potential buy and sell signals.
Triple Exponential Moving Average (TEMA):
The TEMA is a type of Moving Average that takes multiple EMA values and applies a triple smoothing to them. This allows the TEMA to react more quickly to changes in price trends than traditional moving averages. The TEMA line is used as an additional confirmation for potential buy and sell signals.
Double Exponential Moving Average (DEMA):
The DEMA is similar to the TEMA but applies double smoothing to the EMA values. It is used as a signal line to confirm buy and sell signals generated by the MACD and TEMA.
Signal Generation:
The Effortless Continuation Indicator generates buy and sell signals based on the crossover and crossunder of the MACD and DEMA lines, as well as the price being above or below the TEMA line. Long signals are generated when the MACD crosses above the DEMA and the price is above the TEMA. Short signals are generated when the MACD crosses below the DEMA and the price is below the TEMA.
Chop Sensitivity:
The indicator has a user-adjustable "Chop Sensitivity" setting, which allows traders to adjust the ATR sensitivity for long and short signals. ATR is a volatility indicator that measures the average range of price movements over a given period of time. The default value is set to 0.5 ATR, which means that long and short signals will not be generated if the price is within 0.5 ATR of the TEMA.
Alerts:
The Effortless Continuation Indicator has built-in alerts for both long and short signals. It also includes a single alert that will trigger for both long and short signals. This allows traders to stay informed of potential trading opportunities even when they are not actively monitoring the markets.
Conclusion:
The Effortless Continuation Indicator is a powerful technical analysis tool that can help traders identify potential buy and sell signals in the market. It is easy to use and can be customized to suit individual trading styles and preferences. It is important to note that this indicator does not predict the market, but rather provides potential signals that should be confirmed with additional technical and fundamental analysis. With its advanced signal generation and alert features, the Effortless Continuation Indicator can be a valuable addition to any trader's toolbox.
Momentum Ratio Oscillator [Loxx]What is Momentum Ratio Oscillator?
The theory behind this indicator involves utilizing a sequence of exponential moving average (EMA) calculations to achieve a smoother value of momentum ratio, which compares the current value to the previous one. Although this results in an outcome similar to that of some pre-existing indicators (such as volume zone or price zone oscillators), the use of EMA for smoothing is what sets it apart. EMA produces a smooth step-like output when values undergo sudden changes, whereas the mathematics used for those other indicators are completely distinct. This is a concept by the beloved Mladen of FX forums.
To utilize this version of the indicator, you have the option of using either levels, middle, or signal crosses for signals. The indicator is range bound from 0 to 1.
What is an EMA?
EMA stands for Exponential Moving Average, which is a type of moving average that is commonly used in technical analysis to smooth out price data and identify trends.
In a simple moving average (SMA), each data point is given equal weight when calculating the average. For example, if you are calculating the 10-day SMA, you would add up the prices for the past 10 days and divide by 10 to get the average. In contrast, in an EMA, more weight is given to recent prices, while older prices are given less weight.
The formula for calculating an EMA involves using a smoothing factor that is multiplied by the difference between the current price and the previous EMA value, and then adding this to the previous EMA value. The smoothing factor is typically calculated based on the length of the EMA being used. For example, a 10-day EMA might use a smoothing factor of 2/(10+1) or 0.1818.
The result of using an EMA is that the line produced is more responsive to recent price changes than a simple moving average. This makes it useful for identifying short-term trends and potential trend reversals. However, it can also be more volatile and prone to whipsaws, so it is often used in combination with other indicators to confirm signals.
Overall, the EMA is a widely used and versatile tool in technical analysis, and its effectiveness depends on the specific context in which it is applied.
What is Momentum?
In technical analysis, momentum refers to the rate of change of an asset's price over a certain period of time. It is often used to identify trends and potential trend reversals in financial markets.
Momentum is calculated by subtracting the closing price of an asset X days ago from its current closing price, where X is the number of days being used for the calculation. The result is the momentum value for that particular day. A positive momentum value suggests that prices are increasing, while a negative value indicates that prices are decreasing.
Traders use momentum in a variety of ways. One common approach is to look for divergences between the momentum indicator and the price of the asset being traded. For example, if an asset's price is trending upwards but its momentum is trending downwards, this could be a sign of a potential trend reversal.
Another popular strategy is to use momentum to identify overbought and oversold conditions in the market. When an asset's price has been rising rapidly and its momentum is high, it may be considered overbought and due for a correction. Conversely, when an asset's price has been falling rapidly and its momentum is low, it may be considered oversold and due for a bounce back up.
Momentum is also often used in conjunction with other technical indicators, such as moving averages or Bollinger Bands, to confirm signals and improve the accuracy of trading decisions.
Overall, momentum is a useful tool for traders and investors to analyze price movements and identify potential trading opportunities. However, like all technical indicators, it should be used in conjunction with other forms of analysis and with consideration of the broader market context.
Extras
Alerts
Signals
Loxx's Expanded Source Types, see here for details

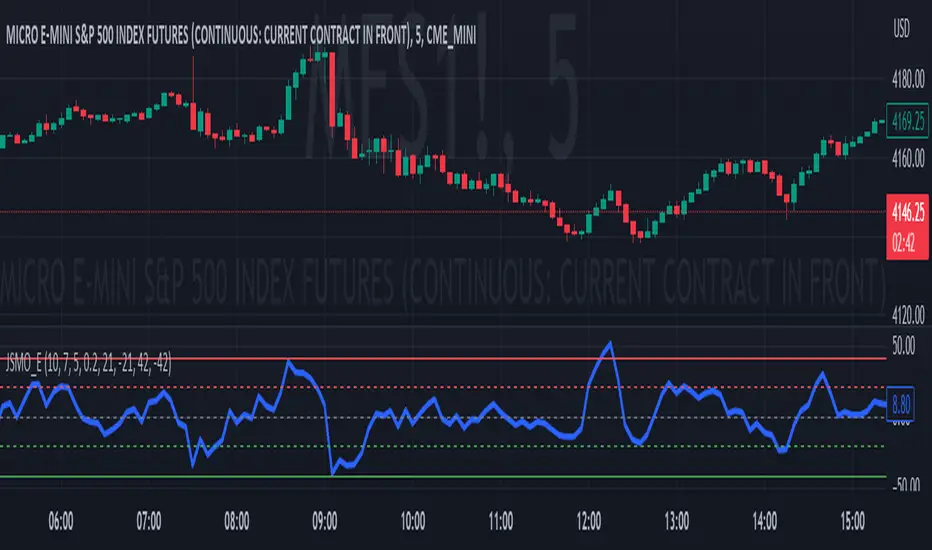
Jdawg Sentiment Momentum Oscillator EnhancedThe Jdawg Sentiment Momentum Oscillator Enhanced (JSMO_E) is a versatile technical analysis indicator designed to provide traders with insights into potential trend changes and overbought or oversold market conditions. JSMO_E combines the principles of the Relative Strength Index (RSI), the Simple Moving Average (SMA), and the Rate of Change (ROC) to create a comprehensive tool for assessing market sentiment and momentum.
The uniqueness of JSMO_E lies in its ability to integrate the RSI, SMA of RSI, and ROC of RSI, while also allowing users to customize the weight of the ROC component. This combination of features is not commonly found in other indicators, which increases its distinctiveness.
To effectively use JSMO_E, follow these steps:
Apply the JSMO_E indicator to the price chart of the asset you are analyzing.
Observe the plotted JSMO_E line in relation to the zero line, overbought, and oversold levels.
When the JSMO_E line crosses above the zero line, it may signal the beginning of an uptrend or bullish momentum. Conversely, when the JSMO_E line crosses below the zero line, it may indicate the start of a downtrend or bearish momentum.
Overbought and oversold levels, marked by the red and green dashed lines, respectively, can serve as a warning that a trend reversal may be imminent. When the JSMO_E line reaches or surpasses the overbought level, it might indicate that the asset is overvalued and could experience a price decline. Conversely, when the JSMO_E line reaches or goes below the oversold level, it can signal that the asset is undervalued and may experience a price increase.
Adjust the input parameters (RSI Period, SMA Period, ROC Period, and ROC Weight) as needed to optimize the indicator for the specific market and time frame you are analyzing.
The JSMO_E indicator is suitable for various markets, including stocks, forex, commodities, and cryptocurrencies. However, its effectiveness may vary depending on the market conditions and time frames used. It is recommended to use JSMO_E in conjunction with other technical analysis tools and methods to confirm potential trade setups and improve overall trading performance. Always conduct thorough backtesting and forward-testing before employing any indicator in a live trading environment.
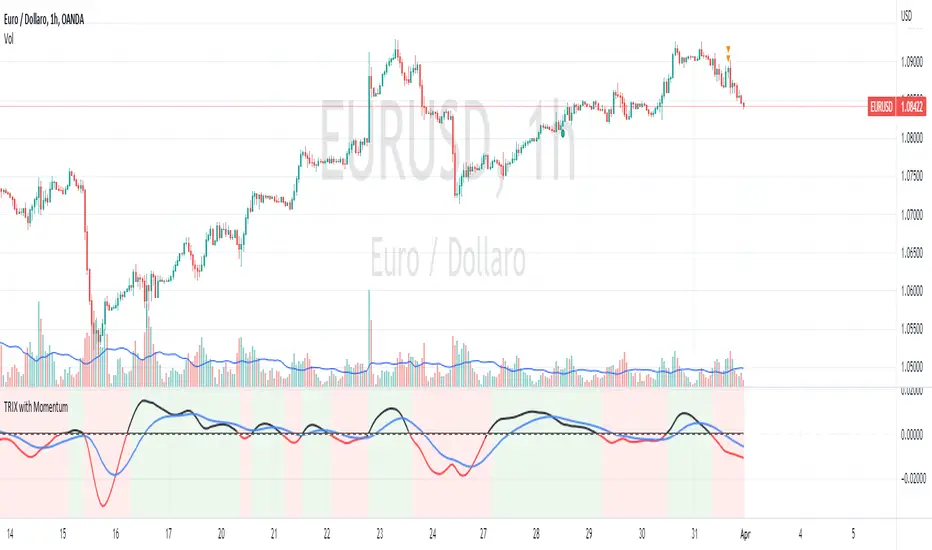
TRIX with Momentum----------- ENGLISH --------------
This indicator is called "TRIX with Momentum" and is used to analyze the momentum of an asset's price and predict potential trend reversals. The logic of operation is based on the combination of two indicators: the Triple Exponential Moving Average (TRIX) and the momentum oscillator.
The TRIX is calculated using three exponential moving averages (EMA) of the asset's closing price, with a user-defined length (set to 14 by default). The TRIX is then normalized and centered around 0 to facilitate analysis of its relationship with the momentum oscillator.
The momentum oscillator is calculated using the EMA of the normalized TRIX with a user-defined length (set to 14 by default).
The indicator plots the normalized TRIX and the momentum oscillator on a chart, using different colors to indicate whether the TRIX is above or below 0. Additionally, the color of the y-axis label changes based on the position of the oscillator, while the color of the x-axis label remains gray.
The indicator uses a weighted average between the normalized TRIX and the momentum oscillator to create a colored background of the chart, which changes based on the weighted average. If the weighted average is positive, the chart's background is green, otherwise it is red. Finally, a horizontal line is drawn at point 0 to facilitate visual analysis of the chart.
------------ ITALIANO -------------
Questo indicatore è chiamato "TRIX with Momentum" ed è utilizzato per analizzare il momentum del prezzo di un asset e prevedere eventuali inversioni di trend. La logica di funzionamento è basata sulla combinazione di due indicatori: il TRIX (Indicatori di media mobile Tripla Esponenziale) e l'oscillatore momentum.
L'indicatore consente all'utente di impostare la lunghezza del TRIX e dell'oscillatore momentum come input personalizzato. Il TRIX viene calcolato utilizzando tre medie mobili esponenziali (EMA) della chiusura dei prezzi dell'asset, mentre l'oscillatore momentum viene calcolato utilizzando l'EMA del TRIX normalizzato.
Il TRIX normalizzato viene centrato intorno allo 0 per facilitare l'analisi della sua relazione con l'oscillatore momentum. L'indicatore plotta il TRIX normalizzato e l'oscillatore momentum su un grafico, utilizzando diversi colori per indicare se il TRIX è sopra o sotto lo 0.
L'indicatore utilizza una media pesata tra il TRIX normalizzato e l'oscillatore momentum per creare uno sfondo colorato del grafico, che cambia in base alla media pesata. L'utente può impostare il peso da dare al TRIX e all'oscillatore momentum come input personalizzato, e il peso dell'oscillatore momentum verrà automaticamente impostato come complementare al peso del TRIX.
Se la media pesata è positiva, lo sfondo del grafico è verde, altrimenti è rosso. Viene tracciata anche una linea orizzontale al punto 0 per facilitare l'analisi visiva del grafico.
Infine, il colore dell'etichetta dell'asse y cambia in base alla posizione dell'oscillatore, mentre il colore dell'etichetta dell'asse x rimane sempre grigio.
Bulls v BearsThis script helps you identify the relative strength of bulls and bears in the market. It calculates the difference between the high and the moving average for bulls, and the difference between the moving average and the low for bears. Then it normalizes the values between -100 and 100 using the highest and lowest values of the last "bars back" periods. This allows you to compare the current strength of bulls and bears relative to their historical strength.
The output of the script is a colored column chart that represents the difference between the normalized bulls and bears values. If the chart is mostly green, it means the bulls are currently stronger than the bears, and vice versa for a mostly red chart. Additionally, the script provides bullish and bearish signals based on when the normalized bulls cross above or below the user-defined "Line Height" value.
You can use this script to help you identify potential trend changes in the market, as well as to confirm existing trends.

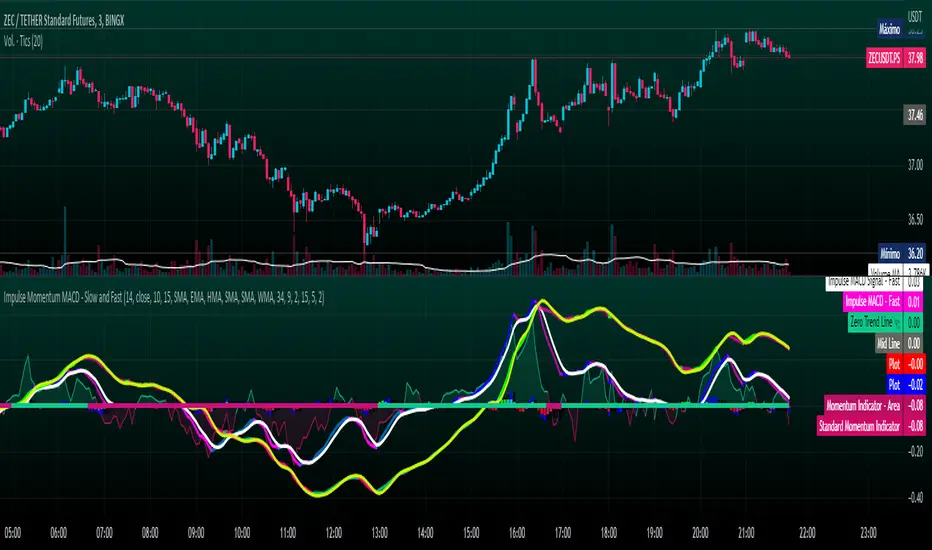
Impulse Momentum MACD - Slow and FastImpulse Momentum MACD - Slow and Fast
The Momentum indicator is a technical indicator that measures the speed and strength of the price movement of a financial asset. This indicator is used to identify the underlying strength of a trend and predict potential changes in price direction, when the indicator crosses the zero line, it can signal a change of direction in the price trend.
On the other hand, the MACD is an indicator used to identify the trend and strength of the market and shows the difference between two exponential moving averages ( EMA ) of different periods. The MACD is commonly used to determine the direction of an asset's price trend.
COPOSITION AND USE OF THE INDICATOR
This script is an implementation of the Impulse Momentum MACD indicator with two variations: slow and fast. It uses a combination of the Momentum indicator and the Moving Average Convergence/Divergence (MACD) indicator to identify trend reversals and momentum changes in an asset's price.
The combination of both indicators can help traders identify market entry and exit opportunities. The Impulse Momentum MACD is a Modified MACD, it is formed by filtering the values in a range of Modifiable Moving Averages by calculating their high and low ranges,This indicator has two parts: a slow part and a fast part. The slow part uses input values for the lengths of the moving averages and the length of the signal for the MACD indicator. The fast part uses different input values for the lengths of the moving averages. Also, each part has its own set of line colors and histogram colors for easy visualization.
The script also includes inputs to choose the type of moving average to use (SMA, EMA, etc.), the lookback period, the colors for the histogram lines and bars, and a zero trend line (also known as a horizontal trend line). ).
* Highest performing custom settings for the zero trend line. For Operations of:
- One Minute: Trend Line Time Frame = Five Minutes.
- Three Minutes: Trend Line Time Frame = Fifteen Minutes.
- Five Minutes: Trend Line Time Frame = Thirty Minutes.
- Fifteen Minutes: Trend Line Time Frame = Sixty Minutes.
Rules For Trading
🔹 Bullish:
* The Zero Horizontal Trend Line should be in Green Color.
* The Slow Histogram Bar should be in Green Color.
* The Fast Histogram Bar must be in Blue or Black Color or No Bar Appears.
* The Momentum Line or Momentum Area must be in Green Color.
crosses:
- When the Impulse Momentum MACD Slow line crosses the Impulse Momentum MACD Slow signal line upwards.
- When the Impulse Momentum MACD Fast line crosses the Impulse Momentum MACD Fast signal line upwards.
- Note 1: A Position is Opened when the condition of any of the aforementioned crossovers is met.
- Note 2: If the two aforementioned crossings anticipate the condition of the Zero Horizontal Tendency Line because it is in Red; A position is only opened immediately when the Zero Horizontal Trend line turns Green.
🔹 Bearish:
* The Zero Horizontal Trend Line should be in Red Color.
* The Slow Histogram Bar should be in Red Color.
* The Fast Histogram Bar must be in Blue or Black Color or No Bar Appears.
* The Momentum Line or Momentum Area must be in Red Color.
crosses:
- When the Impulse Momentum MACD Slow line crosses the Impulse Momentum MACD Slow signal line downwards.
- When the Impulse Momentum MACD Fast line crosses the Impulse Momentum MACD Fast signal line downwards.
- Note 1: A Position is Opened when the condition of any of the aforementioned crossovers is met.
- Note 2: If the two aforementioned crossings anticipate the condition of the Zero Horizontal Tendency Line because it is Green, an immediate position is only opened when the Zero Horizontal Tendency line turns Red.
This script can be used in different markets such as forex, indices and cryptocurrencies for analysis and trading. However, it is important to note that no trading strategy is guaranteed to be profitable, and traders should always conduct their own research and risk management.
Colorful Moving Averageswhat is Colorful Moving Averages?
This indicator allows you to use your favorite moving averages in their advanced form.
what it does?
It gives you easy access to the following information with a single indicator: the direction and momentum of the price,
rate of change of momentum (acceleration),
time-dependent change in momentum,
and all the other information a moving average provides.
it paints the selected moving average type according to the momentum it has, and also shows the momentum and acceleration values in a table. colors are interpreted as follows: the color of the moving average is red, the momentum is negative; A green color means the momentum is positive, and a yellow color means the momentum is 0. As the momentum changes, the moving average takes on different shades of these 3 colors. how it actually works can be easily understood at a glance.
"Δ" sign indicates momentum compressed between 100 and -100.
"Γ" sign indicates the momentum of the momentum, that is the acceleration. its values are compressed between 100 and -100.
how it does it?
it uses this formulas:
how to use it?
First, select the moving average type you want to use. then set the length and source. Now, with a single indicator, you can observe both the distance of the price from the mean, its instantaneous momentum relative to the last candle by looking at the symbol "Δ", the current change of momentum by looking at the symbol "Γ", and the time-dependent change in its momentum by looking at the colors. you can also see the maximum and minimum points where the momentum is equal to 0.

FOREX Master Pattern Trend Finder by nnamdertWhat does this Indicator do?
This indicator works by identifying Trends and "potential" shifts in trends before they happen. It is technically a momentum indicator that watches for specific Bullish or Bearish momentum (i.e. Bull Runs, and Crashes).
How does it do this?
It uses a custom script that takes into account extremes in price and certain moving averages and other accurate forward looking indicators. Once it finds a Bull run, signals are triggered in the form of PLUS signs. It does the same for strong Bearish trends. Based on how the script is configured, the Indicator is able to spot (in advance) unique movement in the trend that can predict a change in momentum prior to the change occurring.
These momentum changes can be configured as alerts.
As seen in the screenshot below the indicator triggers "early warning" signals when it detects a specific movement that is indicative of a potential change in momentum or trend. It does this IN ADVANCE of any change - it is ONLY A PREDICTION but allows the trader to look at the asset to determine if the potential change in trend is valid and gives the trader enough time to set up a trade and stop-loss.
As seen in the screenshot below color-coded candles allow the trader to visually SEE the change on the chart making it easier to get a quick glance at the current trend. In addition, Green and Red Crosses were added to the oscillator to help easily identify trends if the color coded candle feature is turned OFF. These Red and Green Crosses are not located at every highlighted bar location, rather, at the first bar that the alert was triggered on. If there was a gap in the trend, the alert triggers, and plots again when a new trend starts.
As seen in the screenshot below, when a strong trend is present in either direction, small red or green dots are plotted on the oscillator. This makes spotting past and current trends much easier. Even if the price is not moving up or down, this indicates strong underlying buying or selling pressure.
Some traders like using indicators as a reversal finder. Although this indicator is NOT A REVERSAL INDICATOR, I added a signal that can be used as a "potential" reversal finder. You can see this in the screenshot below.
These "reversal" signals typically appear prior to a move in the opposite direction (but not always). A stop-loss can be set at the high or low of the previous bar depending on direction.
At times, multiple "conflicting" warning signals appear back-to-back. This is indicative of a "crab" in the market. Basically, indecision is present in the market. These "early warning" signals are smaller and either BLUE or ORANGE . Once a trend is recognized, the signal will be either RED or GREEN and a bit larger.
Viewing a higher timeframe will allow Forex Master Pattern traders to easily spot contraction zones. I manually draw the lines in at these zones. These "Value Lines" are typically respected in the future. As shown in the screenshot below, the level acted as support in the future and a newer value line was created at a "higher level" - this indicates a Bullish momentum in price as buyers and sellers have agreed upon the higher price as a true value area.
As seen in the screenshot below, multiple potential reversal signals plotted on the chart indicate a "weakening' in the strength of the current trend. This allows the trader to strategically move their stop-loss or simply take some profits off the table at this level.
This Indicator does NOT overlay on the current chart but allows the trader to see color coded bars. Simply double clicking within the indicator will expand the indicator to full screen, and double clicking within the chart itself will hide the secondary pane but keep the candles visible on the chart.
Happy Trading and GOOD LUCK!
Momentum Composite Indicator@CRYPTOSLIFE
This script creates a Momentum Composite Indicator (MCI) that combines four different momentum indicators: RSI, MACD, Stochastic Oscillator, and Rate of Change (ROC). Each of these indicators is calculated, normalized, and then combined with equal weights (25% each) to create the composite indicator. The script also includes a color change based on the change in the composite indicator's value.
Here's a brief explanation of the indicator:
Parameters: The script takes one input parameter, 'length,' which is used as the length for RSI, Stochastic Oscillator, and ROC calculations.
RSI: The Relative Strength Index (RSI) is calculated using the 'length' input parameter. The RSI is then normalized to range between 0 and 1.
MACD: The Moving Average Convergence Divergence (MACD) is calculated using the default lengths of 12, 26, and 9. The histogram is then computed as the difference between the MACD line and the signal line. The MACD histogram is normalized to range between 0 and 1.
Stochastic Oscillator: The Stochastic Oscillator is calculated using the 'length' input parameter, taking the lowest low and highest high over the specified period. The oscillator is then normalized to range between 0 and 1.
Rate of Change (ROC): The Rate of Change (ROC) is calculated using the 'length' input parameter. The ROC is then normalized to range between 0 and 1.
Composite Indicator: The normalized values of RSI, MACD, Stochastic Oscillator, and ROC are combined with equal weights to create the composite indicator.
Color Change: The line color changes based on the change in the composite indicator's value. If the value increases, the line color is green; if it decreases, the line color is red.
Plotting: The composite indicator is plotted on the chart with a linewidth of 5.
This Momentum Composite Indicator can help traders assess the overall momentum in the price movement of a financial instrument by combining the information from four popular momentum indicators.

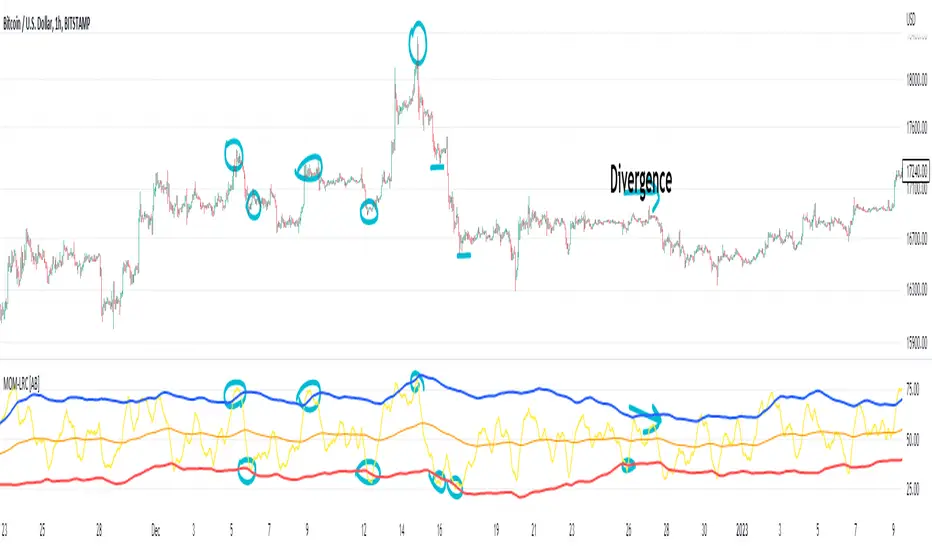
(Very promising) [Abdullah Ahmed] Momentum indicator V.1Description: MOM-LRC is a powerful technical analysis indicator designed to provide traders with signals based on the momentum of an asset's price and its deviation from its mean value. The indicator calculates the exponential RSI and uses a custom function to determine the percentage change from the mean. The upper and lower bands of the momentum channel are then calculated using linear regression of the rate of change from the mean. The channel multiplier can be adjusted to increase or decrease the sensitivity of the indicator.
How to use :
1 - Using MOM-LRC , look for buy signals when the price of the asset is below the lower border of the channel and retracing up. The opposite is true in the case of sell signals.
2 - It is also used in the case of negative and positive divergences, just as you use RSI
The indicator can be used on any time frame and any asset, making it a versatile tool for traders of all levels.
features:
Calculates exponential RSI and percentage change from the mean
Uses linear regression to calculate upper and lower bands of momentum channel
Adjustable channel multiplier for increased sensitivity
Suitable for any time frame and any asset
Happy trading!
Trend Reversal PredictorThis is a predictive indicator which count bars upon rules and tries to predict the price reversals...
Numbers occuring above the bars tells you:
Green Numbers from 1 to 9 tells us there would be a possible SELL signal after the number 9 and if it's M9 that signal could be a stronger one.
1 from 9 must count consecutively and controls the situation that current bar's close is bigger than 4 bars before. Counting will be terminated if any of the bars don't comply this rule. The process must be consecutive and interruption of it starts over the bar counting process.
Red Numbers from 1 to 9 tells us there would be a possible BUY signal after the number 9 and if it's M9 that signal could be a stronger one.
1 from 9 must count consecutively and controls the situation that current bar's close is smaller than 4 bars before. Counting will be terminated if any of the bars don't comply this rule. The process must be consecutive and interruption of it starts over the bar counting process.
Support And Resistance Levels:
Support And Resistance Levels occur after counting from 1 to 9 completed.
Green 9's become much more reliable SELL signals as long as they occur much closer to the resistance lines.
Red 9's become much more reliable BUY signals as long as they occur much closer to the support lines.
Numbers occuring below the bars tells you:
Green Numbers from 1 to 13 starts to count after a Green 9 or M9 and tells us there would be a possible SELL signal after the number 13.
1 from 13 may be interrupted and can continue later on. After occurance of Green 13 one would predict that uptrend might weaken.
This process controls the situation that current bar's close is bigger than or equal to the highest price of 2 bars earlier. Counting will be paused if any of the bars don't comply this rule. The process doesn't have to be consecutive bu it will be terminated if RED 9 occurs above bars or breaks down the relevant support level.
Red Numbers from 1 to 13 starts to count after a Red 9 or M9 and tells us there would be a possible BUY signal after the number 13.
1 from 13 may be interrupted and can continue later on. After occurance of Red 13 one would predict that downtrend might weaken.
This process controls the situation that current bar's close is smaller than or equal to the lowest price of 2 bars earlier. Counting will be paused if any of the bars don't comply this rule. The process doesn't have to be consecutive bu it will be terminated if GREEN 9 occurs above bars or breaks up the relevant support level.
Support And Resistance Levels:
Support And Resistance Levels occur after counting from 1 to 13 completed.
Green 13's become much more reliable SELL signals as long as they occur much closer to the resistance lines.
Red 13's become much more reliable BUY signals as long as they occur much closer to the support lines.

GKD-C Jurik Smoother [Loxx]Giga Kaleidoscope GKD-V Jurik Smoother is a Confirmation module included in Loxx's "Giga Kaleidoscope Modularized Trading System".
█ Giga Kaleidoscope Modularized Trading System
What is Loxx's "Giga Kaleidoscope Modularized Trading System"?
The Giga Kaleidoscope Modularized Trading System is a trading system built on the philosophy of the NNFX (No Nonsense Forex) algorithmic trading.
What is the NNFX algorithmic trading strategy?
The NNFX (No-Nonsense Forex) trading system is a comprehensive approach to Forex trading that is designed to simplify the process and remove the confusion and complexity that often surrounds trading. The system was developed by a Forex trader who goes by the pseudonym "VP" and has gained a significant following in the Forex community.
The NNFX trading system is based on a set of rules and guidelines that help traders make objective and informed decisions. These rules cover all aspects of trading, including market analysis, trade entry, stop loss placement, and trade management.
Here are the main components of the NNFX trading system:
1. Trading Philosophy: The NNFX trading system is based on the idea that successful trading requires a comprehensive understanding of the market, objective analysis, and strict risk management. The system aims to remove subjective elements from trading and focuses on objective rules and guidelines.
2. Technical Analysis: The NNFX trading system relies heavily on technical analysis and uses a range of indicators to identify high-probability trading opportunities. The system uses a combination of trend-following and mean-reverting strategies to identify trades.
3. Market Structure: The NNFX trading system emphasizes the importance of understanding the market structure, including price action, support and resistance levels, and market cycles. The system uses a range of tools to identify the market structure, including trend lines, channels, and moving averages.
4. Trade Entry: The NNFX trading system has strict rules for trade entry. The system uses a combination of technical indicators to identify high-probability trades, and traders must meet specific criteria to enter a trade.
5. Stop Loss Placement: The NNFX trading system places a significant emphasis on risk management and requires traders to place a stop loss order on every trade. The system uses a combination of technical analysis and market structure to determine the appropriate stop loss level.
6. Trade Management: The NNFX trading system has specific rules for managing open trades. The system aims to minimize risk and maximize profit by using a combination of trailing stops, take profit levels, and position sizing.
Overall, the NNFX trading system is designed to be a straightforward and easy-to-follow approach to Forex trading that can be applied by traders of all skill levels.
Core components of an NNFX algorithmic trading strategy
The NNFX algorithm is built on the principles of trend, momentum, and volatility. There are six core components in the NNFX trading algorithm:
1. Volatility - price volatility; e.g., Average True Range, True Range Double, Close-to-Close, etc.
2. Baseline - a moving average to identify price trend
3. Confirmation 1 - a technical indicator used to identify trends
4. Confirmation 2 - a technical indicator used to identify trends
5. Continuation - a technical indicator used to identify trends
6. Volatility/Volume - a technical indicator used to identify volatility/volume breakouts/breakdown
7. Exit - a technical indicator used to determine when a trend is exhausted
How does Loxx's GKD (Giga Kaleidoscope Modularized Trading System) implement the NNFX algorithm outlined above?
Loxx's GKD v1.0 system has five types of modules (indicators/strategies). These modules are:
1. GKD-BT - Backtesting module (Volatility, Number 1 in the NNFX algorithm)
2. GKD-B - Baseline module (Baseline and Volatility/Volume, Numbers 1 and 2 in the NNFX algorithm)
3. GKD-C - Confirmation 1/2 and Continuation module (Confirmation 1/2 and Continuation, Numbers 3, 4, and 5 in the NNFX algorithm)
4. GKD-V - Volatility/Volume module (Confirmation 1/2, Number 6 in the NNFX algorithm)
5. GKD-E - Exit module (Exit, Number 7 in the NNFX algorithm)
(additional module types will added in future releases)
Each module interacts with every module by passing data between modules. Data is passed between each module as described below:
GKD-B => GKD-V => GKD-C(1) => GKD-C(2) => GKD-C(Continuation) => GKD-E => GKD-BT
That is, the Baseline indicator passes its data to Volatility/Volume. The Volatility/Volume indicator passes its values to the Confirmation 1 indicator. The Confirmation 1 indicator passes its values to the Confirmation 2 indicator. The Confirmation 2 indicator passes its values to the Continuation indicator. The Continuation indicator passes its values to the Exit indicator, and finally, the Exit indicator passes its values to the Backtest strategy.
This chaining of indicators requires that each module conform to Loxx's GKD protocol, therefore allowing for the testing of every possible combination of technical indicators that make up the six components of the NNFX algorithm.
What does the application of the GKD trading system look like?
Example trading system:
Backtest: Strategy with 1-3 take profits, trailing stop loss, multiple types of PnL volatility, and 2 backtesting styles
Baseline: Hull Moving Average
Volatility/Volume: Volatility Ratio
Confirmation 1: GKD-V Jurik Smoother as shown on the chart above
Confirmation 2: Williams Percent Range
Continuation: Fisher Transform
Exit: Rex Oscillator
Each GKD indicator is denoted with a module identifier of either: GKD-BT, GKD-B, GKD-C, GKD-V, or GKD-E. This allows traders to understand to which module each indicator belongs and where each indicator fits into the GKD protocol chain.
Giga Kaleidoscope Modularized Trading System Signals (based on the NNFX algorithm)
Standard Entry
1. GKD-C Confirmation 1 Signal
2. GKD-B Baseline agrees
3. Price is within a range of 0.2x Volatility and 1.0x Volatility of the Goldie Locks Mean
4. GKD-C Confirmation 2 agrees
5. GKD-V Volatility/Volume agrees
Baseline Entry
1. GKD-B Baseline signal
2. GKD-C Confirmation 1 agrees
3. Price is within a range of 0.2x Volatility and 1.0x Volatility of the Goldie Locks Mean
4. GKD-C Confirmation 2 agrees
5. GKD-V Volatility/Volume agrees
6. GKD-C Confirmation 1 signal was less than 7 candles prior
Continuation Entry
1. Standard Entry, Baseline Entry, or Pullback; entry triggered previously
2. GKD-B Baseline hasn't crossed since entry signal trigger
3. GKD-C Confirmation Continuation Indicator signals
4. GKD-C Confirmation 1 agrees
5. GKD-B Baseline agrees
6. GKD-C Confirmation 2 agrees
1-Candle Rule Standard Entry
1. GKD-C Confirmation 1 signal
2. GKD-B Baseline agrees
3. Price is within a range of 0.2x Volatility and 1.0x Volatility of the Goldie Locks Mean
Next Candle:
1. Price retraced (Long: close < close or Short: close > close )
2. GKD-B Baseline agrees
3. GKD-C Confirmation 1 agrees
4. GKD-C Confirmation 2 agrees
5. GKD-V Volatility/Volume agrees
1-Candle Rule Baseline Entry
1. GKD-B Baseline signal
2. GKD-C Confirmation 1 agrees
3. Price is within a range of 0.2x Volatility and 1.0x Volatility of the Goldie Locks Mean
4. GKD-C Confirmation 1 signal was less than 7 candles prior
Next Candle:
1. Price retraced (Long: close < close or Short: close > close )
2. GKD-B Baseline agrees
3. GKD-C Confirmation 1 agrees
4. GKD-C Confirmation 2 agrees
5. GKD-V Volatility/Volume Agrees
PullBack Entry
1. GKD-B Baseline signal
2. GKD-C Confirmation 1 agrees
3. Price is beyond 1.0x Volatility of Baseline
Next Candle:
1. Price is within a range of 0.2x Volatility and 1.0x Volatility of the Goldie Locks Mean
3. GKD-C Confirmation 1 agrees
4. GKD-C Confirmation 2 agrees
5. GKD-V Volatility/Volume Agrees
█ GKD-V Jurik Smoother
Jurik Smoother (JS) is a smoothing function that reduces noise and false signals in price data. It is based on a weighted moving average that assigns more weight to recent data points and less weight to older data points. This helps to eliminate sudden price spikes and gaps in the data, making it easier to identify trends and patterns.
Jurik Smoother (JS) is a type of oscillator that was developed by Mark Jurik to reduce the noise and false signals that can be present in financial data. It is designed to be more responsive to changes in price trends than traditional oscillators, while also being less susceptible to whipsaw signals.
The Jurik Smoother is calculated using a weighted moving average that assigns more weight to recent data points and less weight to older data points. This means that it places greater emphasis on current price action, while smoothing out any erratic movements that could be caused by random fluctuations in the data.
One of the key features of the Jurik Smoother is its ability to adapt to changing market conditions. Unlike traditional oscillators, which use a fixed number of data points in their calculation, the Jurik Smoother adjusts its length based on the current volatility of the market. This helps to reduce lag time and increase the accuracy of the indicator in identifying trends.
The Jurik Smoother can be used in a variety of ways, including identifying trends, support and resistance levels, and potential entry and exit points for trades. It is particularly useful in markets that are prone to sudden price spikes and gaps, such as cryptocurrency and forex markets.
Requirements
Inputs
Confirmation 1 and Solo Confirmation: GKD-V Volatility / Volume indicator
Confirmation 2: GKD-C Confirmation indicator
Outputs
Confirmation 2 and Solo Confirmation Complex: GKD-E Exit indicator
Confirmation 1: GKD-C Confirmation indicator
Continuation: GKD-E Exit indicator
Solo Confirmation Simple: GKD-BT Backtest strategy
Additional features will be added in future releases.
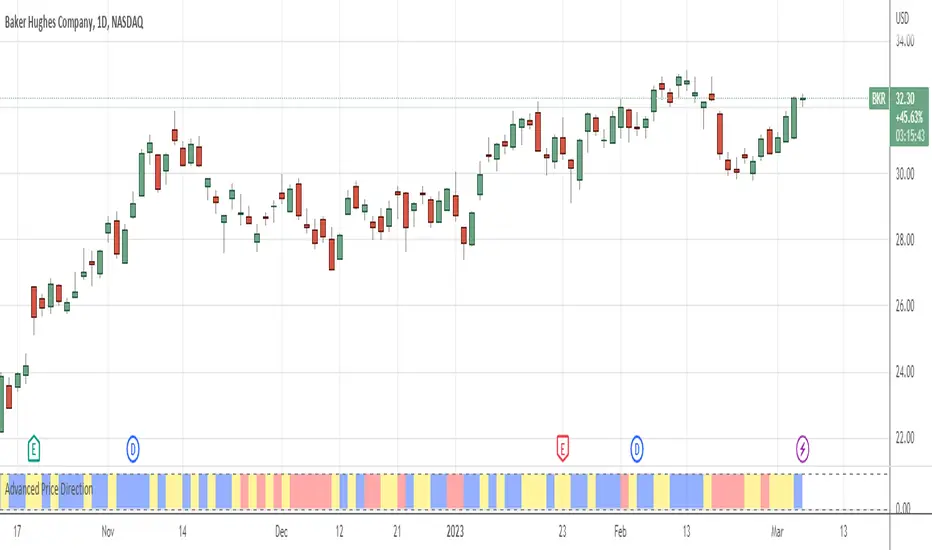
Advanced Price Direction AlgorithmPrices can go up or down or falter in their movement.
This code evaluates this by looking at two consecutive bars or sets of bars.
If you put the set size to 1, the current and previous bar is evaluated.
If put to 2, the last2 and the 2 before these are evaluated.
Default is 12 because this seems to coincide with trend changes.
This code provides an advanced way to evaluate what the price does in a sort of three-value Boolean with the values up, down or falter.
I use this code in indicators I develop where price direction is taken into account.
The simple output makes it possible to use it as an indicator on its own.
8 Day Run - Momentum StrategyInspired by Linda Bradford Raschke.
Entry criteria:
This strategy is used to capture momentum effects on the daily periodicities. Once prices have had a run of 8 or more consecutive closes above or below the 5-period simple moving average the strategy is primed to trade.
It will then enter a short on the first close above the 5sma after a run of 8 or more closes below the 5sma (it will enter a long when the price closes below the 5sma after a run of 8 or more closes above the 5sma).
Exit criteria:
All trades are exited on the first close back above/ below the 5sma.

Multiple Standard MomentumMultiple Standard Momentum
The momentum indicator is a technical indicator that measures the speed and strength of the price movement of a financial asset. This indicator is used to identify the underlying strength of a trend and predict potential changes in price direction.
The calculation of the momentum indicator is based on the difference between the current price and the price of a previous period. The result is displayed on a chart, which can be positive or negative, depending on whether the current price is higher or lower than the price of the previous period. The indicator can be used on any time frame, but is generally used on short-term charts.
To use the momentum indicator , you look for two types of signals:
🔹 Crossover Signal – When the indicator crosses the zero line, it can signal a change of direction in the price trend.
🔹 Divergence – When the asset price moves in one direction and the indicator moves in the opposite direction, a divergence can be identified. This divergence may indicate a possible trend reversal.
COMPOSITION AND MODE OF USE OF THE INDICATOR
🔹 This indicator displays multiple Momentum levels on a single chart, allowing you to view multiple Momentum lines. Each level is represented on the chart where it can be hidden or shown as desired for better market analysis.
🔹 In addition, a zero trend line (also known as a horizontal trend line) has been added. The zero trend line is a horizontal line that indicates the point at which the current price equals the opening price, which allows users to draw a custom zero trend line on the chart using different colors and time periods of calculation.
* Highest performing custom setup for the Zero Trend Line. For Operations of:
- One Minute: Trend Line Time Frame = Five Minutes.
- Three Minutes: Trend Line Time Frame = Fifteen Minutes.
- Five Minutes: Trend Line Time Frame = Thirty Minutes.
- Fifteen Minutes: Trend Line Time Frame = Sixty Minutes.
Rules For Trading
🔹 Bullish:
* The Zero Trend Line must be in Green Color.
* When the Momentum Line Crosses the Zero Line from Bottom to Top.
🔹 Bearish:
* The Zero Trend Line must be in Red Color.
* When the Momentum Line Crosses the Zero Line from Top to Bottom.
In addition, parameters were defined to activate or deactivate the graphic signal taking into account the previous requirement (Bullish and Bearish):
🔹 Long or Buy = ▲
🔹 Short or Sell = ▼
This script can be used in different markets such as forex, indices, and cryptocurrencies for analysis and trading. However, it is important to note that no trading strategy is guaranteed to be profitable, and traders should always conduct their own research and risk management.
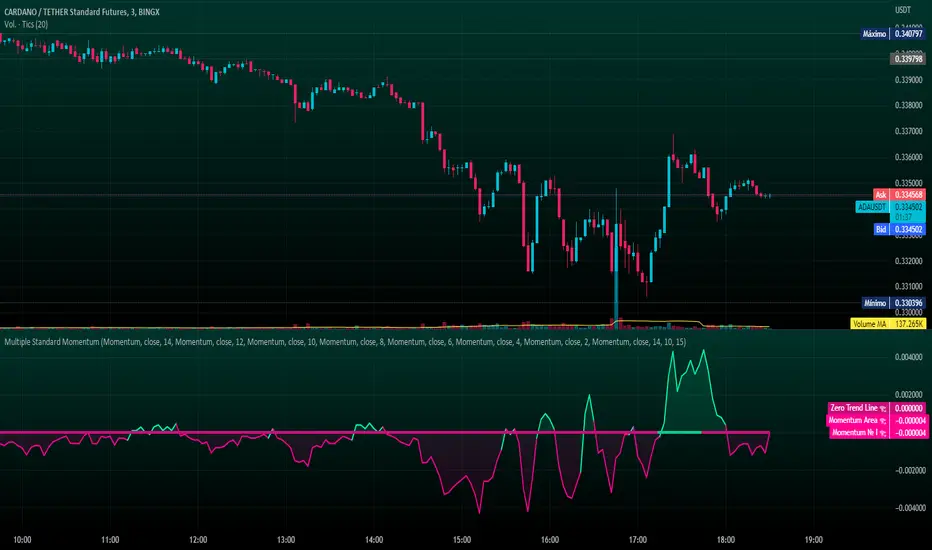
Energy_Arrows[Salty]This script quantifies the energy in a price move by comparing the relationship of 3 configurable exponential moving averages present on a slightly higher timeframe (chosen automatically based on the charts current period). It uses the closing price by default, but this is also configurable using the Source input. There are a few ways to use the information in this indicator. One is to use the values above zero (colored green) to provide a bullish bias for future price, and values below zero (colored red) indicating a bearish bias for future prices. This bias can be shown to be increasing or decreasing base on the upward or downward slope of the indicator. The green and red arrows can be enabled to show if the bias is strengthening or weakening based on the direction they are pointing. Finally, the height changes in the peaks of the indicator can be used to show divergence in the strength of extreme price moves to show when a pull back or reversal may occur.
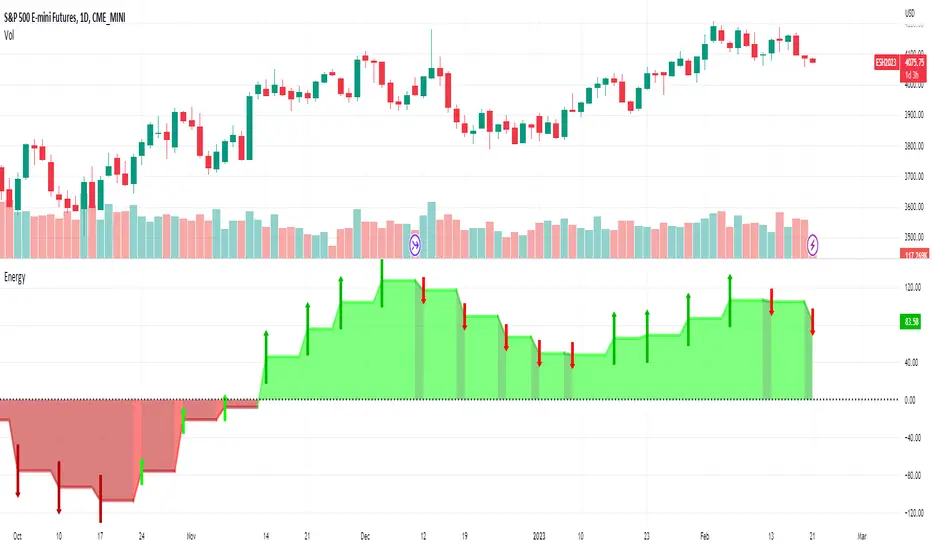
Broadview Economic StudioThank you for taking the time to read this description. We'll be taking a look at the Broadview Economic Studio. This has been a work-in-progress for years and is a very powerful tool for planning trades with complex volume scaling strategies. We will be talking about many indicators and types of indicators used in the public domain, but it is NOT recommended to reverse engineer our scripts as there is quite a bit of logic in the code that works to make each common approach entirely unique. So although you may understand quite a bit about oscillators, the way they work with the rest of the logic within the script may change the way you know them to work from elsewhere.
In the chart snapshot above you'll see a mild configuration where I only had to tweak a few settings. Commissions are set to 0.1%, starting capital is set to $10,000, and slippage is off. In my tests orders came through less than a penny off. Generally speaking, there are really only two situations in which you should be concerned about slippage. The first is if you trade really low timeframe charts like the 1 second. This tool, while it works for any timeframe, is programmed on the 45 minute timeframe and works best there. The other situation in which you should be prepared for slippage is if you're using extremely high volume trades in the hundreds of thousands or millions depending on the market cap and liquidity of the asset you're studying. Large orders like that have to be split up among several deals and that can cause slippage.
There are 31 primary inputs for users to tweak. Each input is grouped within a module called a Suite. Each suite has a focus like filtering signals or strategically allocating volume according to your strategy. Everything starts with the Origin Suite. The Origin Suite is a group of inputs that generates Tops & Bottoms from price action. It uses math like Rate of Change, where one can specify a required rate of change before an Origin signal can be made, and users can specify how much lower in price a bar must be compared to previous bars. So with the Origin Suite, users can control how often they want to see originating signals and under what conditions they can appear.
We used to use WVF and CVI to produce top and bottom signals, but our Origin Suite works much better for systematically generating profitable configurations.
The triangles you see on the chart represent markers, potential signals, or Prop Signals as they're referred to within the script. The blue arrows represent trades where Prop Signals were allowed to pass as true long signals. There are two ways to ignore Prop Signals. You can filter the markers entirely, or you can reduce their volume scaling to the minimum which is usually $10 for most exchanges. We're first going to be talking about some of the primary DCA inputs before we talk about the technology we use to filter and overload signals.
Here are some important features found within the script:
Base Orders
Safety Orders
Take Profits
Change-Based Volume Scaling
Ignoring Low or Medium Changes
Overloading
Filtering
Alert Messages w/ Volume Scaling
Let's walk through each of these features in more depth.
The Base Order is the initial Long position within a series. It comes in first and is followed by all of its Safety Orders. The Base Order is set to $25 within the script by default. Keeping the base order low allows one to reserve more of their capital for Safety Orders that are lower within a dip, and thus, lower the user's Position Average. The primary feature of this script is to help users plan their volume scaling strategically, and this is where we start. It's this kind of due diligence and effort in protecting trades that makes this script unique.
So we start with a low Base Order. Then, we follow with a lot of Safety Orders. Typically in DCA this is done in consistent time intervals and in consistent amounts. So in regular DCA one may invest the same amount bi-weekly on pay day. They use the financial instrument as a sort of savings and average their position over their consistent investments. This is not where the bleeding edge of DCA is today though. In modern Doller Cost Averaging, I would expect to see signals and volume scaling based on logic.. as opposed to being consistent intervals.
This sets up the explanation of the primary means of volume scaling within the script. Mathematically, we start with the net balance. This is your specified starting balance plus any wins or losses. Users specify what % of their Available Balance they would like to start with when volume scaling. This percent of capital is then multiplied by a Safety Order Multiplier. The safety order multiplier is made up of a number specified by the user, multiplied by the number of the Safety Order you're on. So user's can control this equation/algorithm and scale their investments as the number of Safety Orders increases and drops in price become more opportune.
The Take Profit within the script lets users specify their desired ROI from a series. So if a user sets a 60% take profit, the script will set a price from the position average that when reached will give the user a 60% ROI for the series including its Base Order and all its Safety Orders.
Before moving on, let's talk about the amazing internal reporting found in the script. When you zoom in on the blue arrows, you can see each trade is accompanied by some extremely helpful information. This is just another feature that makes this script unique, it is the feature that gives us accurate reporting and ultimately allows us to connect with TradingView's Strategy Tester in a way that provides instant backtests with good merit. With this reporting not only can users get reports and information on trades made on different assets with different configurations, but user's can perform a deep dive on each configuration and know exactly what was going on for each trade. The first number is the number of the safety order the script is on. Remember, this is used in the primary volume scaling math. The second number is the amount the script spent on the current trade. The third number denotes the cumulative spending for the series. The final number displays the script's available balance at that time. With these numbers, the TradingView Strategy Tester, and the List of Trades feature, users can practice as much due diligence as they need during their studies.
Let's move on to talking about my favorite suite within the script, the Volume Scaling Suite. Here there are two primary means of controlling volume scaling. Although, in the near future there will be more.
In this suite you'll find Change-Based Volume Scaling and Position Average Volume Scaling. Position Average Volume Scaling is quite easy to explain. This feature only allows signals to pass if they are lower in price than your base order. In this way, users can apply most of their capital to trades that lower their position average. Simply having the money in the market can boost profits, but having a lower Position Average is the entire reason we DCA. Change-Based Volume Scaling is quite a bit more complex.
In theory, one could argue that every moment is a great moment to buy. It's just that some moments are more opportune than others. So it's not about perfect signals as much as it's about proper volume scaling.
Change-Based Volume Scaling allows us to set rules that dictate how much volume scaling is used based on the asset's current delta, or Rate of Change.
Using CBVS, one can downscale capital applied to signals with a low ROC, or simply ignore them. So if a signal comes in and the price hasn't changed very much then you can automatically use less volume for the trade. One can do the same thing for medium changes, and the user can specify what quantifies as a low or medium change. Users can give extra volume to signals with a greater rate of change, or overload signals with a high rate of change! So the CBVS feature gives users the ability to allocate volume based on logic rooted in the asset's rate of change. If a signal has dropped a lot in price, then generally, it is deserving of more capital and that's what makes this feature unique and so powerful.
There are two kinds of Overloading found in the script. There's overloading from CBVS, and then overloading from the 4 signal filtering suites. There's an important difference to note before we move on. Overloading performed by CBVS is based on ignored signals. So if you ignore low or medium change signals, and you have CBVS Overloading on, the script will allocate more capital to High Change signals. When signals are ignored, they are downscaled to $10. Whereas with the filtering suites, if a signal is filtered the Prop Signal triangle marker is removed entirely. The overloading in that scenario is simply applied to signals that aren't filtered. The reason it's done this way is because allowing ignored signals to still come in, with the lowest volume scaling possible, keeps the Safety Order count rising which works in the volume scaling math. This math is intrinsic to getting capital deep within dips and crashes.
So in future versions we may allow ignored signals to be filtered out entirely but for the time being, simply scaling them down to the lowest possible amount is what produces the best and most consistent configurations.
Let's talk about filtering signals, and the overloading provided within each filtering suite.
Here you can see our Overbought & Oversold Heatmap V3. This is a unique indicator that takes 15 common oscillators and visualizes them in a way that clearly denotes confluence. Looking at this indicator makes it easer to read cycles and trends. It is quite common for investors to base their entire scripts on one or more of the oscillators found within the OBOS Heatmap V3. So the OBOS Heatmap V3 is an awesome way to ensure your signals follow an oversold trend! The orange represents an oscillator being oversold, while the yellow represents it being overbought. Generally, when an asset is oversold it is a better time to buy. One can filter signals based on this information and use the Heatmap's unique ability to quantify confluences. In this script users can set a sensitivity and that sets the number of oscillators that must be in agreement before a signal is allowed to pass.
Here are the oscillators found within the OBOS Heatmap:
*Please keep in mind that although some of these oscillators may have big names, the code and math in the script may work differently than you're used to. This is because the code and math is changed quite a bit, and the overall intended functionality of the OBOS Heatmap has a larger scope than any one indicator. It's also important to note that the lengths for these oscillators are set low and are meant to classify the individual signal as either overbought or oversold, and not the entire period. So while the OBOS Heatmap is awesome for trends and cycles, it's ultimately meant to classify individual price bars as either overbought or oversold according to a consensus.*
Relative Strength Index
Money Flow Index
Commodity Channel Index
Aroon Oscillator
Relative Volatility Index
Fast Stochastic Detrended Price Oscillator
Fast Stochastic Elders Force Index
Fast Stochastic Relative Strength Index
Fast Stochastic Relative Vigor Index
Fast Stochastic Klinger Oscillator
Fast Stochastic Awesome Oscillator
Fast Stochastic Ultimate Oscillator
Fast Stochastic Chande Momentum Oscillator
Fast Stochastic On Balance Volume Oscillator
Fast Stochastic Moving Average Convergence/Divergence
Each band of the Overbought & Oversold Heatmap represents an oscillator. When it's orange it's said to be oversold. When it's yellow it's said to be overbought. The indicator turns purple during trends and reversals where it is neither overbought nor oversold. It can differentiate between uptrends and downtrends with differing colors of purple, but the OBOS Heatmap is not used for trends or cycles in this script. It is used to quantify oversold confluence.
Let's talk about the Dominance Suite.
First note in the top portion of the screenshot above, you will see various colors in the script. It replaces the price line with something we call Price Flow bars. So when you add the script it's best to make the stock price line invisible in TV settings. The Price Flow Bars use a preset EMA to color price action as being in either a downward momentum or upward momentum. The triangular signals represent dark teal for the initial long marker within a series, dark green for long orders and long signals that convert into safety orders, and light green for safety orders. This is more logic that makes this script really unique. The dark green initial long marker signals are rarely seen. You can find them at the beginning of a new series of signals and they work to establish when a new series of signals should begin. The dark green signals actually denote a long base order opportunity, but if a series has already started then these signals are converted into Safety Orders. The Safety Orders then come in light green, and red for Prop Shorts. Prop Shorts work with Initial Longs to establish the start of a new series. More on that math I cannot tell.
In the bottom half of the screenshot is the Dominance Suite itself. It's another one of the four filtering suites found in the script. It is made up of 7 oscillators that work to classify a price bar as being controlled by either the bears or the bulls. If a price bar is controlled by the bears it is said to be a better investment. The Dominance Suite works by applying a moving average to the balance of power. This is the way TradingView has intended the balance of power to be used, and works quite nicely in classifying individual price bars as either bearish or bullish. It's not an overall trend indicator as much as it states whether a bar is mostly controlled by the bears or the bulls.
Here are the oscillators found within the Dominance Suite:
SMA of BOP
EMA of BOP
HMA of BOP
WMA of BOP
VWMA of BOP
TEMA of BOP
LSMA of BOP
Within the script, there is an input for a negative threshold. When each of these 7 oscillators is in confluence and below this set threshold, the Prop Long will be allowed to pass as a real trade.
Keep in mind that each filtering suite also has the option to overload signals.
So not only can you filter signals based on these suites but you can also apply additional volume scaling to signals that don't get filtered.
Here we have the True Oscillator. The True Oscillator is a brand new oscillator. It's similar to things like the RSI or DPO, but technically speaking it considers many more factors into its average than other oscillators. It considers balance of power, sentiment, volume, momentum, gravity, and places special-strategic weighting on price data based on whether it's opening, closing, high, or low. If you stack the True Oscillator up with the RSI you'll notice right away they look similar, but each movement is quite different. Overall the movements are more balanced, the individual bars are more consistent with price data, and the swings are more clearly pronounced while simultaneously having a better register of strength in momentum. We use this indicator to filter and overload signals, to trade according to momentum, and to provide a 16th independent oscillator that can check the OBOS Heatmap without having to be confluent.
The final filtering suite is based on Net Volume. It classifies signals as oversold when there is a significant negative trend in net volume. If Net Volume is under 0, and trends downward for either 3, 4, or 5 bars in a row then it will mark a signal as oversold and allow it to pass. Then, if overloading for this suite is turned on it will allocate more volume to signals it does not filter out.
There is a lot that can be said about this strategy. The primary takeaway though is that it's not just one strategy. It's a tool for everyone, to help them plan their approach to different assets in different market climates. This tool can help you study current market conditions. It can allow you to plan a strategic approach to market segments, and see how your strategy would fare if new market data performed similarly. It's not just one strategy, but more of a strategy printer.
The Origin Suite allows users to plan the positioning of their signals. The Overbought & Oversold Suite allows users to filter their signals based on whether or not they are oversold. The Dominance Suite allows users to filter signals based on whether the market is being controlled by the bears or the bulls. The True Oscillator gives users the ability to filter signals based on a deep and powerful momentum oscillator. The Net Volume Suite lets users filter signals based on volume trends. When signals are filtered, signals that pass, can be overloaded with additional volume scaling. Features like Change-Based Volume Scaling and Position Average Volume Scaling give users plenty of inputs to create complex volume scaling strategies. Common-sense DCA inputs allow users to scale into markets the way pros do.
The Broadview Economic Studio is a powerful tool for planning trades with complex volume scaling strategies.
Users can plan their approach to different kinds of markets. They can link the script with their bot or broker like 3Commas, and the script will automatically send the correct volume scaling through to the bot.
Thank you for your time, and for reading the description of the Broadview Economic Studio.

True Range MomentumThe indicator calculates the momentum of bullish and bearish based on the average true range and the highest highs and lowest lows of the historical price.
The indicator displays the strength for either taking a long position, or a short position.
The simplest way to use the indicator is to take a long position when the M+ line crosses above the 0 line. Similarly, to short, the M- line should cross above the 0 line. The exit would be when the respective line crosses below the 0 line.
The contrarian traders should wait for the lines to start rising towards the 0 line and taking an exit. In essence, the line should be going from negative to 0.
The greater the divergence between the M+ and M-, the stronger the trend.
The small table of Long and Short suggests what is in strength. A 100 will show a strong trend in the respective direction. It will be 50-50 when there is no clear direction, ideally identifying a consolidation range.
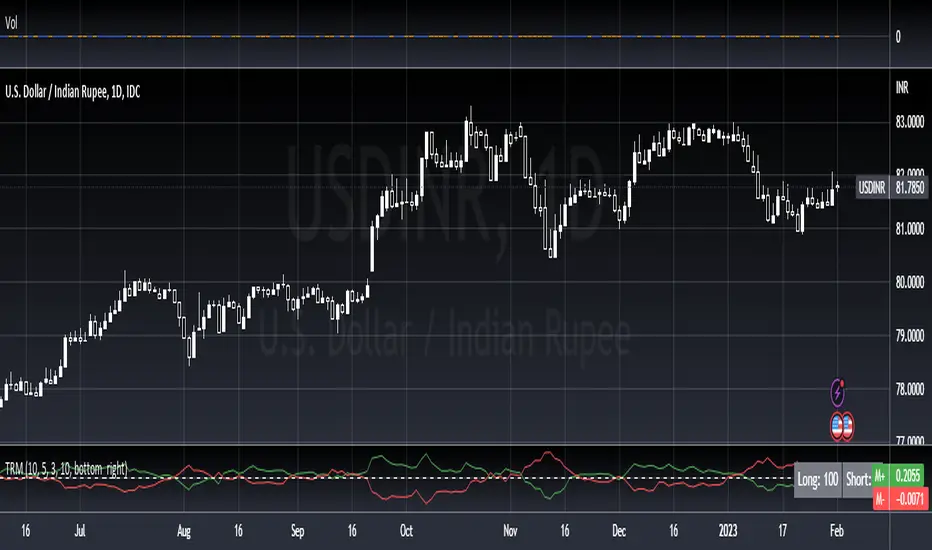
Strategy Myth-Busting #11 - TrendMagic+SqzMom+CDV - [MYN]This is part of a new series we are calling "Strategy Myth-Busting" where we take open public manual trading strategies and automate them. The goal is to not only validate the authenticity of the claims but to provide an automated version for traders who wish to trade autonomously.
Our 11th one is an automated version of the "Magic Trading Strategy : Most Profitable Indicator : 1 Minute Scalping Strategy Crypto" strategy from "Fx MENTOR US" who doesn't make any official claims but given the indicators he was using, it looked like on the surface that this might actually work. The strategy author uses this on the 1 minute and 3 minute timeframes on mostly FOREX and Heiken Ashi candles but as the title of his strategy indicates is designed for Crypto. So who knows..
To backtest this accurately and get a better picture we resolved the Heiken Ashi bars to standard candlesticks . Even so, I was unable to sustain any consistency in my results on either the 1 or 3 min time frames and both FOREX and Crypto. 10000% Busted.
This strategy uses a combination of 3 open-source public indicators:
Trend Magic by KivancOzbilgic
Squeeze Momentum by LazyBear
Cumulative Delta Volume by LonesomeTheBlue
Trend Magic consists of two main indicators to validate momentum and volatility. It uses an ATR like a trailing Stop to determine the overarching momentum and CCI as a means to validate volatility. Together these are used as the primary indicator in this strategy. When the CCI is above 0 this is confirmation of a volatility event is occurring with affirmation based upon current momentum (ATR).
The CCI volatility indicator gets confirmation by the the Cumulative Delta Volume indicator which calculates the difference between buying and selling pressure. Volume Delta is calculated by taking the difference of the volume that traded at the offer price and the volume that traded at the bid price. The more volume that is traded at the bid price, the more likely there is momentum in the market.
And lastly the Squeeze Momentum indicator which uses a combination of Bollinger Bands, Keltner Channels and Momentum are used to again confirm momentum and volatility. During periods of low volatility, Bollinger bands narrow and trade inside Keltner channels. They can only contract so much before it can’t contain the energy it’s been building. When the Bollinger bands come back out, it explodes higher. When we see the histogram bar exploding into green above 0 that is a clear confirmation of increased momentum and volatile. The opposite (red) below 0 is true when there are low periods. This indicator is used as a means to really determine when there is premium selling plays going on leading to big directional movements again confirming the positive or negative momentum and volatility direction.
If you know of or have a strategy you want to see myth-busted or just have an idea for one, please feel free to message me.
Trading Rules
1 - 3 min candles
FOREX or Crypto
Stop loss at swing high/low | 1.5 risk/ratio
Long Condition
Trend Magic line is Blue ( CCI is above 0) and above the current close on the bar
Squeeze Momentum's histogram bar is green/lime
Cumulative Delta Volume line is green
Short Condition
Trend Magic line is Red ( CCI is below 0) and below the current close on the bar
Squeeze Momentum's histogram bar is red/maroon
Cumulative Delta Volume line is peach

Arron Meter With Alerts [Skiploss]Arron Meter With Alerts is an indicator to identify the trend, and a meter shows the percentage of AroonUP and AroonDown.
Alert Settings
It will be part of a display of bullish and bearish signals by using the condition of the upper line cross lower line and HMA 200 cross under/over EMA 12, and also upper/lower line must be higher than 70%
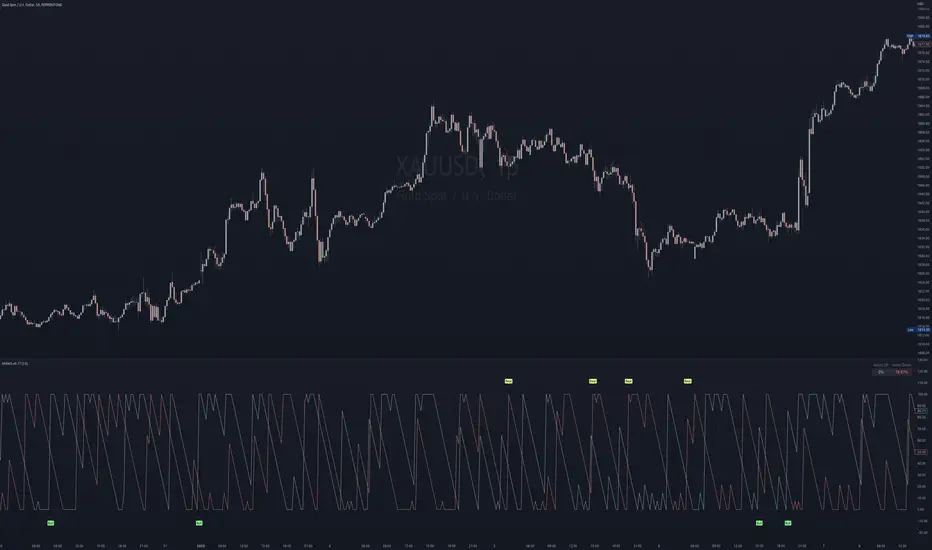
GKD-C Momentum Breakout Bands [Loxx]Giga Kaleidoscope Momentum Breakout Bands is a Confirmation module included in Loxx's "Giga Kaleidoscope Modularized Trading System".
█ Giga Kaleidoscope Modularized Trading System
What is Loxx's "Giga Kaleidoscope Modularized Trading System"?
The Giga Kaleidoscope Modularized Trading System is a trading system built on the philosophy of the NNFX (No Nonsense Forex) algorithmic trading.
What is an NNFX algorithmic trading strategy?
The NNFX algorithm is built on the principles of trend, momentum, and volatility. There are six core components in the NNFX trading algorithm:
1. Volatility - price volatility; e.g., Average True Range, True Range Double, Close-to-Close, etc.
2. Baseline - a moving average to identify price trend
3. Confirmation 1 - a technical indicator used to identify trends
4. Confirmation 2 - a technical indicator used to identify trends
5. Continuation - a technical indicator used to identify trends
6. Volatility/Volume - a technical indicator used to identify volatility/volume breakouts/breakdown
7. Exit - a technical indicator used to determine when a trend is exhausted
How does Loxx's GKD (Giga Kaleidoscope Modularized Trading System) implement the NNFX algorithm outlined above?
Loxx's GKD v1.0 system has five types of modules (indicators/strategies). These modules are:
1. GKD-BT - Backtesting module (Volatility, Number 1 in the NNFX algorithm)
2. GKD-B - Baseline module (Baseline and Volatility/Volume, Numbers 1 and 2 in the NNFX algorithm)
3. GKD-C - Confirmation 1/2 and Continuation module (Confirmation 1/2 and Continuation, Numbers 3, 4, and 5 in the NNFX algorithm)
4. GKD-V - Volatility/Volume module (Confirmation 1/2, Number 6 in the NNFX algorithm)
5. GKD-E - Exit module (Exit, Number 7 in the NNFX algorithm)
(additional module types will added in future releases)
Each module interacts with every module by passing data between modules. Data is passed between each module as described below:
GKD-B => GKD-V => GKD-C(1) => GKD-C(2) => GKD-C(Continuation) => GKD-E => GKD-BT
That is, the Baseline indicator passes its data to Volatility/Volume. The Volatility/Volume indicator passes its values to the Confirmation 1 indicator. The Confirmation 1 indicator passes its values to the Confirmation 2 indicator. The Confirmation 2 indicator passes its values to the Continuation indicator. The Continuation indicator passes its values to the Exit indicator, and finally, the Exit indicator passes its values to the Backtest strategy.
This chaining of indicators requires that each module conform to Loxx's GKD protocol, therefore allowing for the testing of every possible combination of technical indicators that make up the six components of the NNFX algorithm.
What does the application of the GKD trading system look like?
Example trading system:
Backtest: Strategy with 1-3 take profits, trailing stop loss, multiple types of PnL volatility, and 2 backtesting styles
Baseline: Hull Moving Average as shown on the chart above
Volatility/Volume: Volatility Ratio as shown on the chart above
Confirmation 1: Momentum Breakout Bands as shown on the chart above
Confirmation 2: Williams Percent Range
Continuation: Fisher Transform
Exit: Rex Oscillator
Each GKD indicator is denoted with a module identifier of either: GKD-BT, GKD-B, GKD-C, GKD-V, or GKD-E. This allows traders to understand to which module each indicator belongs and where each indicator fits into the GKD protocol chain.
Giga Kaleidoscope Modularized Trading System Signals (based on the NNFX algorithm)
Standard Entry
1. GKD-C Confirmation 1 Signal
2. GKD-B Baseline agrees
3. Price is within a range of 0.2x Volatility and 1.0x Volatility of the Goldie Locks Mean
4. GKD-C Confirmation 2 agrees
5. GKD-V Volatility/Volume agrees
Baseline Entry
1. GKD-B Baseline signal
2. GKD-C Confirmation 1 agrees
3. Price is within a range of 0.2x Volatility and 1.0x Volatility of the Goldie Locks Mean
4. GKD-C Confirmation 2 agrees
5. GKD-V Volatility/Volume agrees
6. GKD-C Confirmation 1 signal was less than 7 candles prior
Continuation Entry
1. Standard Entry, Baseline Entry, or Pullback; entry triggered previously
2. GKD-B Baseline hasn't crossed since entry signal trigger
3. GKD-C Confirmation Continuation Indicator signals
4. GKD-C Confirmation 1 agrees
5. GKD-B Baseline agrees
6. GKD-C Confirmation 2 agrees
1-Candle Rule Standard Entry
1. GKD-C Confirmation 1 signal
2. GKD-B Baseline agrees
3. Price is within a range of 0.2x Volatility and 1.0x Volatility of the Goldie Locks Mean
Next Candle:
1. Price retraced (Long: close < close or Short: close > close )
2. GKD-B Baseline agrees
3. GKD-C Confirmation 1 agrees
4. GKD-C Confirmation 2 agrees
5. GKD-V Volatility/Volume agrees
1-Candle Rule Baseline Entry
1. GKD-B Baseline signal
2. GKD-C Confirmation 1 agrees
3. Price is within a range of 0.2x Volatility and 1.0x Volatility of the Goldie Locks Mean
4. GKD-C Confirmation 1 signal was less than 7 candles prior
Next Candle:
1. Price retraced (Long: close < close or Short: close > close )
2. GKD-B Baseline agrees
3. GKD-C Confirmation 1 agrees
4. GKD-C Confirmation 2 agrees
5. GKD-V Volatility/Volume Agrees
PullBack Entry
1. GKD-B Baseline signal
2. GKD-C Confirmation 1 agrees
3. Price is beyond 1.0x Volatility of Baseline
Next Candle:
1. Price is within a range of 0.2x Volatility and 1.0x Volatility of the Goldie Locks Mean
3. GKD-C Confirmation 1 agrees
4. GKD-C Confirmation 2 agrees
5. GKD-V Volatility/Volume Agrees
█ Momentum Breakout Bands
What is Momentum Breakout Bands?
Momentum Breakout Bands is a momentum oscillator with Bollinger Bands to filter noise by standard deviation. This is used for breakout trading and can be used on lower timeframes.
Requirements
Inputs
Confirmation 1 and Solo Confirmation: GKD-V Volatility / Volume indicator
Confirmation 2: GKD-C Confirmation indicator
Outputs
Confirmation 2 and Solo Confirmation: GKD-E Exit indicator
Confirmation 1: GKD-C Confirmation indicator
Continuation: GKD-E Exit indicator
Additional features will be added in future releases.