SuperTrend Confluence Signals [AlgoAlpha]OVERVIEW
This script enhances the classic SuperTrend indicator by integrating volume dynamics, retracement detection, and a multi-asset trend matrix—alongside an automatic mitigation-level drawing system. It's designed for traders who want to see not just trend direction, but the confluence of trend strength, volatility-adjusted retracements, and capital flow through volume pressure. It visually maps key transitions in market structure while offering a clean, color-coded overview of multiple symbols and timeframes in a single chart.
CONCEPTS
At the core is the traditional SuperTrend , which determines directional bias using Average True Range (ATR) with a volatility multiplier. This script overlays that with a dynamic volume histogram that scales relative to recent volume standard deviation, coloring volume bursts within the trend. Retracement signals are triggered when price pulls back toward the SuperTrend level but respects it—quantified through normalized distance sensitivity. On top of that, the indicator automatically draws and manages horizontal support/resistance zones that appear at key trend shifts. These levels persist and are cleared based on configurable rules such as wick/body sweeps or consecutive candle closes. A multi-asset, multi-timeframe table then gives an instant snapshot of trend status across five user-defined symbols and timeframes.
FEATURES
SuperTrend : Configurable ATR length and multiplier for flexible trend sensitivity.
Volumetric Histogram : Gradient-filled candles anchored to SuperTrend bands, scaled by relative volume to indicate activity intensity during trends.
Retracement Arrows : Signals printed when price nears the SuperTrend level without breaking it, allowing identification of high-probability continuation zones.
Volume TP Markers : Diamond markers flag high-volume events, contextualizing price moves with liquidity bursts.
Automatic Structure Levels : Draws clean horizontal lines at significant trend transitions, with optional volatility-based band fills. These levels self-update and clear based on price interaction logic.
Trend Table : Displays trend direction (▲/▼) across five assets and five timeframes. Each cell is colored according to trend bias, providing a compact overview for multi-market confluence.
USAGE
Start by loading the indicator on your main chart and adjusting the ATR Length and Multiplier to match your strategy timeframe. Use lower values for scalping and higher values for swing trading. The histogram bars will appear as colored candles above or below the SuperTrend level, indicating how strong volume is within that trend. Arrow signals suggest minor pullbacks within the trend, which can act as entry opportunities. The level system will automatically plot key price zones during trend flips; if "Body" is selected for mitigation, price must close through the level to invalidate it. If "Wick" is chosen, a single wick breach is enough. Adjust expiry and rejection settings to fine-tune how long levels stay on chart. Finally, enable the Multi-Asset Table to view live trend signals across popular symbols like AAPL or NVDA in different timeframes, helping spot macro-to-micro alignment for higher-confidence trades.
Meanreversion

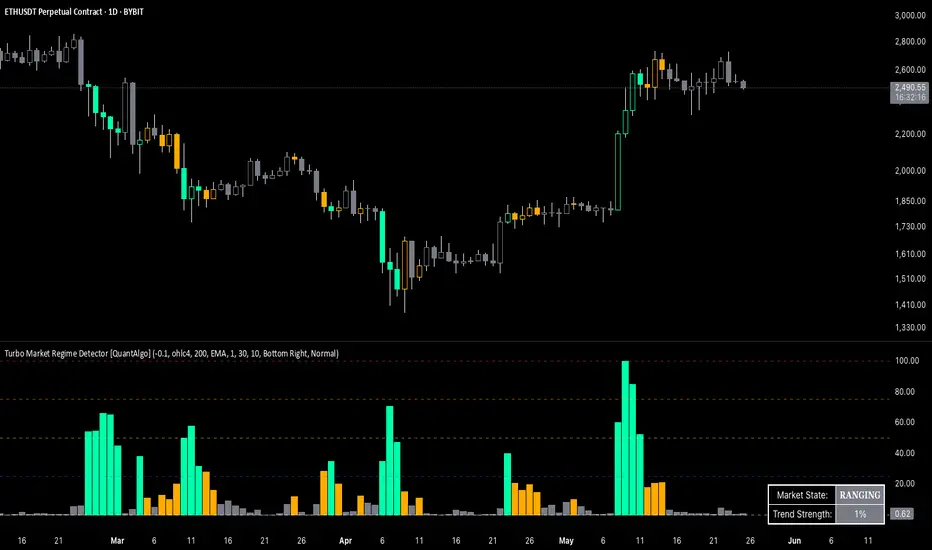
Turbo Market Regime Detector [QuantAlgo]The Turbo Market Regime Detector is a market state classification system that combines volatility-adaptive filtering with slope analysis to identify and categorize market regimes. It helps traders and investors distinguish between trending and ranging market conditions across different timeframes and asset classes.
🟢 Technical Foundation
The Turbo Market Regime Detector employs a multi-layered analytical approach to market regime identification, incorporating:
Volatility-Adaptive Regime Filter (VARF) : Uses dynamic alpha calculation based on price volatility and range to create an adaptive filter that responds to changing market conditions
Slope Analysis : Calculates the absolute slope of the VARF curve and applies customizable moving average smoothing to determine trend strength and market regime classification
Normalized Histogram : Transforms raw slope data into percentage-based metrics (0-100%) for interpretation of market conditions
Multi-Threshold Classification System : Implements user-defined thresholds to categorize markets into Strong Trend, Weak Trend, and Ranging regimes
The indicator processes price data through mathematical operations including volatility adjustment, slope normalization, and statistical range analysis. This creates a regime detection system that adapts to market volatility while maintaining classification consistency across different timeframes and asset classes.
🟢 Key Features & Signals
1. Market Regime Classification
The indicator presents market conditions through a normalized histogram that distinguishes between three distinct market states:
1/ Strong Trend Regime: When the histogram exceeds the strong trend threshold (default 30%), indicating directional market movement with sustained momentum
2/ Weak Trend Regime: When the histogram falls between weak trend (default 10%) and strong trend thresholds, representing transitional market conditions with moderate directional bias
3/ Ranging Regime: When the histogram remains below the weak trend threshold, signaling consolidation periods with limited directional movement
This classification system provides insights into:
→ Current market state with percentage-based quantification
→ Regime transitions and their timing
→ Market momentum strength across different timeframes
2. Visual Feedback System
The indicator features multiple visualization options for market analysis:
Background Coloring: Optional chart background coloring that applies regime-based colors to both the indicator pane and main price chart for visual context
Bar Coloring: Price bar coloring based on current market regime, providing visual feedback on market conditions
Reference Lines: Horizontal reference lines at 25%, 50%, 75%, and 100% levels for percentage assessment and historical comparison
Information Table: Real-time status display showing current market state and trend strength percentage with customizable positioning and sizing options
3. Alert and Notification System
The indicator generates alerts for regime transitions:
State Change Alerts: Notifications triggered when the market transitions between regime states (Strong Trend ↔ Weak Trend ↔ Ranging)
Specific Regime Entry Alerts: Individual alert conditions for entering Strong Trend, Weak Trend, or Ranging regimes for targeted trading strategies
Customizable Alert Messages: Pre-formatted alert messages including exchange and ticker information for context and decision-making
🟢 Practical Usage Guidelines
→ Regime-Based Strategy Selection: Use the indicator to identify potential trading strategies - trend-following during Strong Trend regimes, mean-reversion during Ranging periods, and adjusted position sizing during Weak Trend transitions
→ Multi-Timeframe Analysis: Apply the indicator across different timeframes to understand market regime hierarchy and identify confluence between short-term and long-term market states
→ Threshold Optimization: Adjust regime thresholds based on market volatility and asset characteristics - lower thresholds for more sensitive regime detection, higher thresholds for more definitive regime changes
🟢 Configuration Tips
VARF settings optimization:
→ Lower thresholds (-0.3 to -0.5) for more responsive regime detection in volatile markets
→ Higher thresholds (-0.1 to 0.1) for smoother signals in stable market conditions
→ Enable adaptive VARF for automatic volatility adjustment across different market cycles
Slope analysis parameter tuning:
→ Shorter MA lengths (100-200) for faster regime transition signals
→ Longer MA lengths (300-500) for more stable regime identification
→ Adjust sensitivity multiplier based on desired responsiveness vs. stability balance
Regime interpretation framework:
→ Strong Trend regimes for momentum-based strategies and trend following
→ Ranging regimes for mean-reversion and support/resistance trading
→ Weak Trend periods for reduced position sizing and cautious market approach
Complementary analysis integration:
→ Volume analysis for regime change confirmation
→ Support/resistance levels for entry/exit timing within regime contexts
→ Price action patterns for validation of regime-based trading decisions
→ Economic calendar events that may influence regime transitions
Statistical Pairs Trading IndicatorZ-Score Stat Trading — Statistical Pairs Trading Indicator
📊🔗
---
What is it?
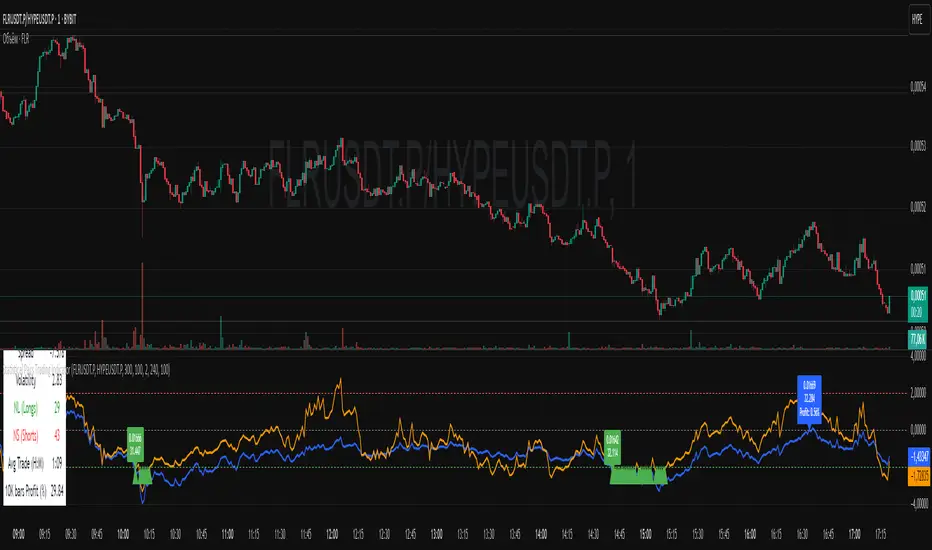
Z-Score Stat Trading is a powerful indicator for statistical pairs trading and quantitative analysis of two correlated assets.
It calculates the Z-Score of the log-price spread between any two symbols you choose, providing both long-term and short-term Z-Score signals.
You’ll also see real-time correlation, volatility, spread, and the number of long/short signals in a handy on-chart table!
---
How to Use 🛠️
1. Add the indicator to your chart.
2. Select two assets (symbols) to analyze in the settings.
3. Watch the Z-Score plots (blue and orange lines) and threshold levels (+2, -2 by default).
4. Check the info table for:
- Correlation
- Volatility
- Spread
- Number of long (NL) and short (NS) signals in the last 1000 bars
5. Set up alerts for signal generation or threshold crossings if you want to be notified automatically.
---
Trading Strategy 💡
- This indicator is designed for statistical arbitrage (mean reversion) strategies.
- Long Signal (🟢):
When both Z-Scores drop below the negative threshold (e.g., -2), a long signal is generated.
→ Buy Symbol A, Sell Symbol B, expecting the spread to revert to the mean.
- Short Signal (🔴):
When both Z-Scores rise above the positive threshold (e.g., +2), a short signal is generated.
→ Sell Symbol A, Buy Symbol B, again expecting mean reversion.
- The info table helps you quickly assess the frequency of signals and the current statistical relationship between your chosen assets.
---
Best Practices & Warnings 🚦
- Avoid high leverage! Pairs trading can be risky, especially during periods of divergence. Use conservative position sizing.
- Check for cointegration: Before using this indicator, make sure both assets are cointegrated or have a strong historical relationship. This increases the reliability of mean reversion signals.
- Check correlation: Only use asset pairs with a high correlation (preferably 0.8–0.9 or higher) for best results. The correlation value is shown in the info table.
- Scale in and out gradually: When entering or exiting positions, consider doing so in parts rather than all at once. This helps manage slippage and risk, especially in volatile markets.
---
⚠️ Note on Performance:
This indicator may work a bit slowly, especially on large timeframes or long chart histories, because the calculation of NL and NS (number of long/short signals) is computationally intensive.
---
Disclaimer ⚠️
This script is provided for educational and informational purposes only .
It is not financial advice or a recommendation to buy or sell any asset.
Use at your own risk. The author assumes no responsibility for any trading decisions or losses.
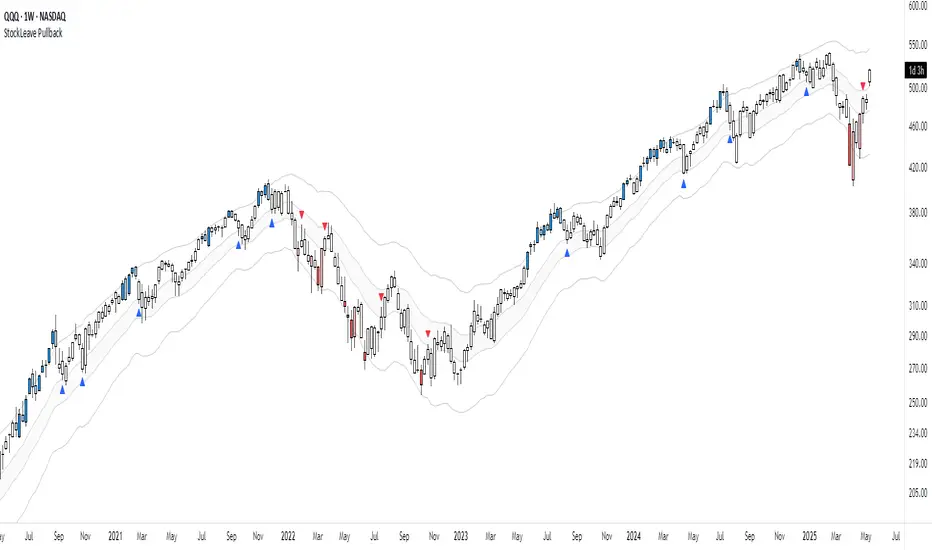
StockLeave PullbackThe indicator is made to locate pullbacks that occur in response to momentum moves. It shows potential pullback setups based on envelopes, mean spread conditions and price structure. It provides a reference for discretionary interpretation, not a replacement for it.
Momentum Condition
When price remains inside the envelope, it is considered normal behavior based on recent conditions. When price touches or exceeds the outer envelope, constructed from the mean ± ATR multiplier, it could indicate directional pressure. This suggests that price is moving with enough force to exceed its recent average range, which could correspond to meaningful momentum.
Blue colors show upward momentum
Red colors show downward momentum
This marks a momentum move that could be of interest if a pullback develops.
Pullback Condition
After a momentum move has been identified, the indicator monitors for one of two standardized pullback conditions:
A reversion to the mean zone, low threshold ATR around the mean value
A zero-line spread convergence, where the difference between two MA’s contracts near zero
When either condition is met following a prior momentum move, a triangle is plotted on the chart to indicate that a pullback has occurred. This is limited to one signal per condition for each momentum move.
Applied Discretion
These visual cues do not imply that an entry should be taken; they simply indicate that a pullback location has been reached in response to a momentum move. Manual evaluation is still required to determine whether the setup aligns with structure and context:
Whether the trend structure remains intact
Whether the pullback is controlled
Whether the trade aligns with the broader context
If these conditions are met, entries can be made based on a preferred execution pattern, such as a break above or below the prior bar.
Trend Reversal
This indicator is made to locate pullbacks in response to a momentum move. It does not aim to capture a trend reversal phase, as those moves often require further price movement before structure can be confirmed. For this reason, there will be no plots in the earlier phase since price will not exceed the envelope.
The better approach for those scenarios is to observe price action in combination with the Momentum H/L indicator , which measures changes in momentum and highlights extremes that could lead to initiation or exhaustion.
Settings Overview
Pullback Mode
None: No triangles plotted (default)
Mean Zone: Triangle when price pulls back into the mean zone
Zero Line: Triangle when moving average spread contracts near zero
Dual: Plots one triangle per momentum move, based on the first condition met
Show Envelope: Toggle envelope visibility
Show Mean Zone: Toggle mean zone visibility
Bar Colors: Set colors for bars during momentum moves
Hurst Exponent Oscillator [PhenLabs]📊 Hurst Exponent Oscillator -
Version: PineScript™ v5
📌 Description
The Hurst Exponent Oscillator (HEO) by PhenLabs is a powerful tool developed for traders who want to distinguish between trending, mean-reverting, and random market behaviors with clarity and precision. By estimating the Hurst Exponent—a statistical measure of long-term memory in financial time series—this indicator helps users make sense of underlying market dynamics that are often not visible through traditional moving averages or oscillators.
Traders can quickly know if the market is likely to continue its current direction (trending), revert to the mean, or behave randomly, allowing for more strategic timing of entries and exits. With customizable smoothing and clear visual cues, the HEO enhances decision-making in a wide range of trading environments.
🚀 Points of Innovation
Integrates advanced Hurst Exponent calculation via Rescaled Range (R/S) analysis, providing unique market character insights.
Offers real-time visual cues for trending, mean-reverting, or random price action zones.
User-controllable EMA smoothing reduces noise for clearer interpretation.
Dynamic coloring and fill for immediate visual categorization of market regime.
Configurable visual thresholds for critical Hurst levels (e.g., 0.4, 0.5, 0.6).
Fully customizable appearance settings to fit different charting preferences.
🔧 Core Components
Log Returns Calculation: Computes log returns of the selected price source to feed into the Hurst calculation, ensuring robust and scale-independent analysis.
Rescaled Range (R/S) Analysis: Assesses the dispersion and cumulative deviation over a rolling window, forming the core statistical basis for the Hurst exponent estimate.
Smoothing Engine: Applies Exponential Moving Average (EMA) smoothing to the raw Hurst value for enhanced clarity.
Dynamic Rolling Windows: Utilizes arrays to maintain efficient, real-time calculations over user-defined lengths.
Adaptive Color Logic: Assigns different highlight and fill colors based on the current Hurst value zone.
🔥 Key Features
Visually differentiates between trending, mean-reverting, and random market modes.
User-adjustable lookback and smoothing periods for tailored sensitivity.
Distinct fill and line styles for each regime to avoid ambiguity.
On-chart reference lines for strong trending and mean-reverting thresholds.
Works with any price series (close, open, HL2, etc.) for versatile application.
🎨 Visualization
Hurst Exponent Curve: Primary plotted line (smoothed if EMA is used) reflects the ongoing estimate of the Hurst exponent.
Colored Zone Filling: The area between the Hurst line and the 0.5 reference line is filled, with color and opacity dynamically indicating the current market regime.
Reference Lines: Dash/dot lines mark standard Hurst thresholds (0.4, 0.5, 0.6) to contextualize the current regime.
All visual elements can be customized for thickness, color intensity, and opacity for user preference.
📖 Usage Guidelines
Data Settings
Hurst Calculation Length
Default: 100
Range: 10-300
Description: Number of bars used in Hurst calculation; higher values mean longer-term analysis, lower values for quicker reaction.
Data Source
Default: close
Description: Select which data series to analyze (e.g., Close, Open, HL2).
Smoothing Length (EMA)
Default: 5
Range: 1-50
Description: Length for smoothing the Hurst value; higher settings yield smoother but less responsive results.
Style Settings
Trending Color (Hurst > 0.5)
Default: Blue tone
Description: Color used when trending regime is detected.
Mean-Reverting Color (Hurst < 0.5)
Default: Orange tone
Description: Color used when mean-reverting regime is detected.
Neutral/Random Color
Default: Soft blue
Description: Color when market behavior is indeterminate or shifting.
Fill Opacity
Default: 70-80
Range: 0-100
Description: Transparency of area fills—higher opacity for stronger visual effect.
Line Width
Default: 2
Range: 1-5
Description: Thickness of the main indicator curve.
✅ Best Use Cases
Identifying if a market is regime-shifting from trending to mean-reverting (or vice versa).
Filtering signals in automated or systematic trading strategies.
Spotting periods of randomness where trading signals should be deprioritized.
Enhancing mean-reversion or trend-following models with regime-awareness.
⚠️ Limitations
Not predictive: Reflects current and recent market state, not future direction.
Sensitive to input parameters—overfitting may occur if settings are changed too frequently.
Smoothing can introduce lag in regime recognition.
May not work optimally in markets with structural breaks or extreme volatility.
💡 What Makes This Unique
Employs advanced statistical market analysis (Hurst exponent) rarely found in standard toolkits.
Offers immediate regime visualization through smart dynamic coloring and zone fills.
🔬 How It Works
Rolling Log Return Calculation:
Each new price creates a log return, forming the basis for robust, non-linear analysis. This ensures all price differences are treated proportionally.
Rescaled Range Analysis:
A rolling window maintains cumulative deviations and computes the statistical “range” (max-min of deviations). This is compared against the standard deviation to estimate “memory”.
Exponent Calculation & Smoothing:
The raw Hurst value is translated from the log of the rescaled range ratio, and then optionally smoothed via EMA to dampen noise and false signals.
Regime Detection Logic:
The smoothed value is checked against 0.5. Values above = trending; below = mean-reverting; near 0.5 = random. These control plot/fill color and zone display.
💡 Note:
Use longer calculation lengths for major market character study, and shorter ones for tactical, short-term adaptation. Smoothing balances noise vs. lag—find a best fit for your trading style. Always combine regime awareness with broader technical/fundamental context for best results.

Mean Reversion Bundle [ActiveQuants]The Mean Reversion Bundle indicator is a powerful and versatile toolkit designed for traders who specialize in mean reversion strategies . This comprehensive bundle integrates eight key technical indicators renowned for their ability to identify potential price reversals, overbought/oversold conditions, and market exhaustion points. By consolidating Moving Averages (Fast & Slow) , Bollinger Bands , RSI (with Divergence) , Stochastic , Keltner Channels , Standard Pivot Points , ATR , and the Choppiness Index into a single, efficient script, it significantly streamlines chart analysis and empowers robust strategy development.
This bundle operates on the core principle of mean reversion: prices tend to revert to their historical average or mean over time . The included indicators provide multiple perspectives to assess these potential turning points:
Dynamic Support/Resistance: Moving Averages, Bollinger Bands, Keltner Channels, Pivot Points.
Momentum Oscillators: RSI, Stochastic.
Overbought/Oversold Conditions: RSI, Stochastic, Bollinger Bands.
Volatility Assessment: ATR, Bollinger Bands, Keltner Channels.
Market Condition Filter: Choppiness Index (Range vs. Trend).
Reversal Signals: RSI Divergence, Bollinger Band recovery.
By enabling users to selectively activate, extensively customize, and visualize these tools ( often with multi-timeframe capabilities ), the Mean Reversion Bundle facilitates a nuanced and layered approach to identifying high-probability mean reversion setups.
█ KEY FEATURES
All-in-One Mean Reversion Suite: Access eight distinct mean reversion indicators within a single TradingView script slot, saving valuable indicator space.
Modular Design: Easily toggle each indicator (Fast MA, Slow MA, Bollinger Bands, RSI, Stochastic, Keltner Channels, Pivot Points, ATR, Choppiness Index) On or Off through the intuitive settings menu to tailor your analysis.
Deep Customization: Fine-tune a wide array of parameters for every indicator, including lengths, sources, MA types, colors, line styles, levels, and specific calculation methods to precisely match your trading strategy and the asset's characteristics.
Multi-Timeframe (MTF) Capability: Configure most indicator components to analyze data from a different timeframe than your main chart, providing crucial higher-level context for mean reversion signals (e.g., daily RSI on an hourly chart).
Integrated Alert System: Pre-built alert conditions for critical mean reversion events such as:
- Price Crossover/Crossunder (Fast MA)
- Price Crossover/Crossunder (Slow MA)
- Lower Bollinger Band Recovery
- Upper Bollinger Band Recovery
- Bullish RSI Divergence
- Bearish RSI Divergence
Set up these alerts directly through TradingView's alert creation dialog. (See section on "█ SETTING UP ALERTS " for more details).
Advanced MA & RSI Smoothing: Option to apply a secondary smoothing MA or even Bollinger Bands directly to the Fast MA, Slow MA, and RSI lines for refined signal generation.
Sophisticated Pivot Points Module: Includes multiple Pivot Point types (Traditional, Fibonacci, Woodie, Classic, DM, Camarilla) with flexible timeframes (Daily to Decennially) and dynamic drawing of historical levels.
RSI Divergence Detection: Automatically plots potential bullish and bearish divergences between price and the RSI, a classic reversal signal.
█ USER INPUTS
The settings panel is organized into distinct sections for each of the 8 core indicator components:
Fast MA & Slow MA: On/Off, MA Type, Source, Length, Color, Line Width, Smoothing Type (None, MA, or MA + BBs), Smoothing Length, BB StdDev (if smoothing with BBs), Timeframe, Wait TF Close.
Bollinger Bands: On/Off, Length, Basis MA Type, Source, StdDev Multiplier, Offset, Colors, Timeframe, Wait TF Close.
RSI: On/Off, Source, Length, Overbought/Middle/Oversold Levels, Color, Line Width, Smoothing Type (None, MA, or MA + BBs), Smoothing Length, BB StdDev (if smoothing with BBs), Plot Divergence, Divergence Lookback Left/Right, Timeframe, Wait TF Close.
Stochastic: On/Off, %K Length, %K Smoothing, %D Smoothing, Overbought/Middle/Oversold Levels, Colors, Timeframe, Wait TF Close.
Keltner Channels: On/Off, Length, Multiplier, Source, Use Exponential MA (for basis), Bands Style (ATR, TR, Range), ATR Length, Colors, Timeframe, Wait TF Close.
Pivot Points: On/Off, Type, Pivots Timeframe (Anchor), Number of Pivots Back, Use Daily-based Values, Show Labels, Show Prices, Labels Position, Line Width, Line Style, and individual color/visibility toggles for P, S1-S5, R1-R5.
ATR: On/Off, Length, Smoothing Type, Color, Timeframe, Wait TF Close.
Choppiness Index: On/Off, Length, Offset, Upper/Middle/Lower Band Levels, Color, Timeframe, Wait TF Close.
█ SETTING UP ALERTS
The Mean Reversion Bundle comes with several pre-configured alert conditions to notify you of potential trading opportunities. To set up an alert:
Click the " Alert " button (clock icon) on TradingView's right-hand toolbar or top panel.
In the " Condition " dropdown, select " Mean Reversion Bundle ".
A second dropdown will appear, allowing you to choose from the specific alert conditions built into the script (e.g., " Price Crossover (Fast MA) ", " Bullish RSI Divergence ", " Lower Bollinger Band Recovery ").
You can also create more complex alerts by selecting one of the indicator's plotted lines (e.g., " RSI ", " Stochastic %K ", " Bollinger Band Basis ") in the first condition box, then choosing a comparison (e.g., " Crossing Down ", " Greater Than "), and then selecting another value or plotted line from the indicator in the third box.
Choose your preferred " Trigger " option:
- " Only Once ": The alert triggers the first time the condition is met, even on an unclosed (intra-bar) candle. The alert then deactivates.
- " Once Per Bar Close ": (Recommended for most mean reversion signals) The alert triggers only after the current bar closes if the condition was true on that closed bar. This ensures signals are based on confirmed price action and allows the alert to re-trigger on subsequent bars if the condition remains true.
- Other options like " Once Per Bar " or " Once Per Minute " are also available for different needs.
Customize the alert name, message, and notification preferences.
Click " Create ".
█ STRATEGY EXAMPLES
The following examples are for illustrative purposes only to demonstrate how indicators in this bundle can be combined for mean reversion strategies. They are not financial advice. Always conduct thorough backtesting and research.
1. Bollinger Band Reversal with RSI Confirmation
Goal: Identify potential reversals when price touches an outer Bollinger Band and RSI shows overbought/oversold conditions.
Setup: Enable Bollinger Bands (e.g., 20,2), RSI (e.g., 14), and optionally the Choppiness Index.
Entry (Long):
- Price touches or briefly closes below the Lower Bollinger Band.
- RSI is in the oversold region (e.g., below 30) or shows bullish divergence.
- Optional Filter: Choppiness Index > 61.8 (indicating a ranging market favorable for BB mean reversion).
- Enter on a confirming candle (e.g., price closes back inside the Lower Band, or a bullish candle pattern forms).
Entry (Short): Reverse logic for Upper Bollinger Band and overbought RSI (e.g., above 70) or bearish divergence.
Management: Stop-loss beyond the recent swing low/high or a multiple of ATR. Target the Bollinger Band basis line or the opposite band.
2. Stochastic Oversold/Overbought with Pivot Point Support/Resistance
Goal: Trade bounces from key Pivot Point levels when confirmed by Stochastic extremes.
Setup: Enable Stochastic (e.g., 14,3,3), Pivot Points (e.g., Daily Traditional), and Fast MA (e.g., 9 EMA) for short-term trend context.
Entry (Long):
- Price approaches a significant Pivot Support level (S1, S2).
- Stochastic %K and %D lines are in the oversold region (e.g., below 20) and ideally show a bullish crossover (%K crosses above %D).
- Optional Filter: Price is above the Fast MA, or the Fast MA starts to slope up.
- Enter on signs of price rejection at the Pivot level.
Entry (Short): Reverse logic for Pivot Resistance levels (R1, R2) and overbought Stochastic (e.g., above 80) with a bearish crossover.
Management: Stop-loss below the Pivot Support (for longs) or above Pivot Resistance (for shorts). Target the next Pivot level or a fixed risk-reward ratio.
3. RSI Divergence at Keltner Channel Extremes
Goal: Capitalize on weakening momentum (divergence) as price tests the outer Keltner Channel bands.
Setup: Enable RSI (with Divergence plotting enabled), Keltner Channels (e.g., 20,2 EMA basis, ATR 10), and ATR (for stop placement).
Entry (Long):
- Price is testing or near the Lower Keltner Channel band.
- A Bullish RSI Divergence is plotted (price makes a lower low, but RSI makes a higher low).
- Enter once the divergence is confirmed and price shows signs of turning up.
Entry (Short):
- Price is testing or near the Upper Keltner Channel band.
- A Bearish RSI Divergence is plotted (price makes a higher high, but RSI makes a lower high).
- Enter once divergence is confirmed and price shows signs of turning down.
Management: Place stop-loss based on ATR (e.g., 1.5x ATR below entry for longs) or beyond the Keltner Channel. Target could be the Keltner basis line or a measured move.
█ CONCLUSION
The Mean Reversion Bundle offers a sophisticated yet user-friendly suite of tools essential for traders focusing on mean reversion. By consolidating these powerful indicators, providing extensive customization , multi-timeframe analysis , and integrated alerts , this bundle simplifies the analytical workflow and aids in the development of more robust and nuanced trading strategies. Whether identifying potential exhaustion points, confirming overbought/oversold conditions, or finding precise entry near dynamic support/resistance, this bundle is a versatile asset for your technical analysis toolkit.
█ IMPORTANT NOTES
⚠ Parameter Optimization: The default settings are starting points. Always adjust indicator parameters (lengths, multipliers, levels) based on the specific asset, its volatility, and the timeframe you are trading. Thorough backtesting is crucial.
⚠ Multi-Timeframe Dynamics: Using the " Timeframe " input can be very powerful. If " Wait TF Close " is enabled (default), signals from higher timeframes will only update upon the close of that higher timeframe bar. Disabling it may lead to signals changing intra-bar.
⚠ Confluence is Key: Avoid relying on a single indicator. The strength of this bundle lies in combining signals from multiple indicators to build a confluence case for a trade.
⚠ Chart Clarity: While many tools are available, only enable those pertinent to your current strategy to maintain a clear and actionable chart.
⚠ Signal Confirmation: Indicator signals are typically finalized on bar close. Be cautious when acting on intra-bar signals, as they can change before the bar is complete. Using " Once Per Bar Close " for alerts is generally recommended for mean reversion signals.
█ RISK DISCLAIMER
Trading involves a substantial risk of loss and is not suitable for all investors. The Mean Reversion Bundle indicator is provided for educational and informational purposes only . It does NOT constitute financial advice or a recommendation to buy or sell any asset. Indicator signals identify potential patterns based on historical data but do not guarantee future price movements or profitability. Always conduct your own thorough research, utilize multiple sources of information, and implement robust risk management practices before making any trading decisions. Past performance is not indicative of future results.
📊 Happy trading! 🚀

Hybrid Momentum Suite [QuantAlgo]The Hybrid Momentum Suite is an advanced momentum-based technical indicator that utilizes a weighted fusion of RSI and CCI, combined with adaptive boundary detection to help traders and investors identify momentum strength and potential reversal zones across different timeframes and asset classes.
🟢 Technical Foundation
The Hybrid Momentum Suite employs a dual-component approach to momentum analysis, incorporating:
Hybrid RSI-CCI Calculation: Uses a customizable ratio for momentum signature creation, allowing traders and investors to balance the characteristics of both indicators
Bi-Directional Component Separation: Automatically separates unified momentum into distinct bullish and bearish forces for independent analysis
Adaptive Impulse Boundary: Uses exponential moving average combined with standard deviation multipliers to detect momentum exhaustion zones
Multi-Level Gradient Visualization: Applies sophisticated layering with varying transparency to show momentum strength and direction changes
The indicator processes price data through multiple filtering stages, applying mathematical principles including weighted averaging, component isolation, and statistical variance analysis. This creates a momentum system that adapts to market volatility while maintaining clarity in directional bias and strength quantification.
🟢 Key Features & Signals
1. Bi-Directional Component Separation
The indicator presents momentum through mathematically isolated histograms that separate bullish and bearish forces for independent analysis.
When bullish momentum is dominant, the bullish component (green) shows greater amplitude than the bearish component.
Similarly, when bearish momentum is dominant, the bearish component (red) shows greater amplitude than the bullish component.
During transitional periods, components may show equal strength, indicating momentum equilibrium.
This visualization provides immediate insights into:
→ Competing market forces simultaneously
→ Momentum exhaustion before reversals
→ Quantified momentum strength across different timeframes
2. Real-Time Status Update
The indicator features a comprehensive analysis dashboard that operates with dynamic strength classification:
The dashboard automatically categorizes momentum from "Very Weak" to "Very Strong" based on component amplitude.
Historical comparison displays previous bar metrics for trend analysis, helping traders and investors understand momentum persistence.
Color-coded visualization matches histogram components for immediate recognition of market bias.
Adaptive positioning offers nine customizable table locations for optimal display across different chart layouts.
Regardless of position, the dashboard displays:
Current momentum direction (BULLISH or BEARISH)
Momentum strength percentage (0-100%)
Previous bar comparison for trend persistence
Active component colors for visual consistency
This comprehensive approach helps traders and investors:
→ Assess current momentum strength quantitatively
→ Identify momentum shifts through historical comparison
→ Make informed decisions based on momentum context
3. Reversal Signal Detection System
The indicator generates trading signals using advanced multi-factor validation:
Exhaustion signals are detected when components cross down after exceeding statistical boundaries, indicating potential momentum reversals.
Trend flip alerts are generated when component dominance changes (bull>bear or bear>bull), signaling directional shifts.
Boundary interaction monitoring tracks crossovers above/below impulse threshold for extreme momentum identification.
Visual markers ( X ) are positioned using mathematical placement algorithms for clear signal identification.
The indicator also features a comprehensive alert system with notifications for:
Bullish potential reversals
Bearish potential reversals
Trend flip signals
Momentum boundary crossings
*Alerts can be customized and delivered through TradingView's notification system, making it easy to stay informed of important momentum developments even when away from the charts.
4. Conditional Bar Coloring
The indicator provides optional price bar coloring based on momentum analysis:
Bars are colored based on dominant momentum component (bullish/bearish).
Reversal conditions are highlighted with specialized coloring (default orange).
Color transparency adjusts based on momentum strength for immediate visual feedback.
Bar coloring can be toggled on/off to suit different chart aesthetics and personal preferences.
🟢 Practical Usage Tips
→ Component Analysis and Interpretation: The indicator visualizes momentum direction and strength through separate components, allowing traders to immediately identify dominant market forces. This helps in assessing potential for continuation or reversal.
→ Signal Generation Strategies: The indicator generates potential trading signals based on component crossovers, boundary violations, and momentum exhaustion. Users can focus on reversal signals at statistical extremes or trend-following signals during component dominance.
→ Multi-Component Assessment: Through its bi-directional approach, the indicator enables users to understand competing forces within the same timeframe. This helps in identifying momentum equilibrium and potential turning points.
🟢 Pro Tips
Adjust RSI/CCI ratio based on market conditions:
→ High ratios (70-100) for mean-reverting markets and longer timeframes
→ Low ratios (0-30) for trending markets and shorter timeframes
→ Default 50/50 for balanced momentum assessment across market types
Fine-tune impulse boundary based on volatility:
→ Lower boundary lengths (20-30) for more frequent reversal signals
→ Higher lengths (40-60) for only major momentum extremes
→ Adjust standard deviation multiplier (2.0-4.0) based on market volatility
Look for confluence between components:
→ Component divergence as early reversal warning
→ Simultaneous extreme readings for high-probability setups
→ Component correlation with price for confirmation
Use for multiple trading approaches:
→ Reversal trading at component extremes near impulse boundary
→ Trend following when components show clear dominance
→ Early momentum shift detection with gradient fading patterns
→ Position sizing based on component strength percentage
Combine with:
→ Support/resistance analysis for strategic entry and exit points
→ Volume indicators for momentum validation
→ Multiple timeframe analysis for broader market context
→ Price action patterns for confirmation of reversal signals

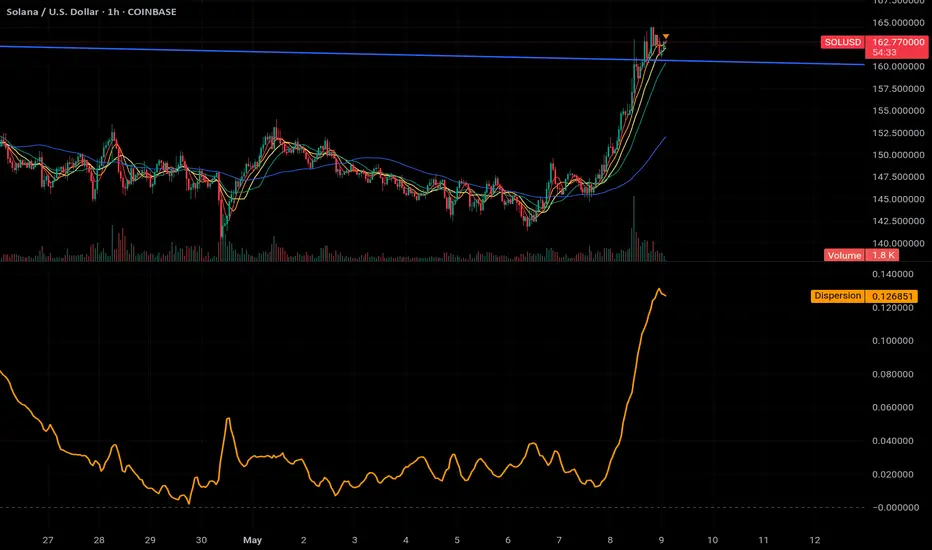
MA Dispersion+MA Dispersion+ — read the “breathing space” between your moving-averages
Get instant feedback on trend strength, volatility expansion and mean-reversion — across any timeframe.
MA Dispersion+ turns the humble moving-average stack into a single, easy-to-read oscillator that tells you at a glance whether price is coiling or fanning out.
🧩 What it does
Plugs into your favourite MA setup
• Pick the classic 5 / 20 / 50 / 200 lengths or disable any combination with one click.
• Choose the MA engine you trust — SMA, EMA, RMA, VWMA or WMA.
• Works on any timeframe thanks to TradingView’s security() engine.
Measures “spread”
For every bar it calculates the absolute distance of each selected MA from their average.
The tighter the stack, the lower the value; the wider the fan, the higher the value.
Adds professional-grade controls
• Weighting — let short-term MAs dominate (Inverse Length), keep everything equal, or dial in your own custom weights.
• Normalisation — convert the raw distance into a percentage of price, ATR multiples, or scale by the MAs’ own mean so you can compare symbols of any price or volatility.
🔍 How traders use it
Trend confirmation – rising dispersion while price breaks out = momentum is genuine.
Volatility squeeze – dispersion parking near zero warns that a big move is loading.
Multi-TF outlook – drop one pane per timeframe (e.g. 5 m, 1 h, 1 D) and see which layer of the market is driving.
Mean-reversion plays – spikes that fade quickly often coincide with exhaustion and snap-backs.
⚙️ Quick-start
Add MA Dispersion+ to your chart.
Set the pane’s timeframe in the first input.
Tick the MA lengths you actually use.
(Optional) Pick a weighting scheme and a normaliser.
Repeat the indicator for as many timeframes as you like — each instance keeps its own settings.
✨ Why you’ll love it
Zero clutter – one orange line tells you what four separate MAs whisper.
Configurable yet bullet-proof – all lengths are hard-coded constants, so Pine never complains.
Context aware – normalisation lets you compare BTC’s $60 000 chaos with EURUSD’s four--decimals calm.
Lightweight – no labels, no drawings, no background processing — perfect for mobile and multi-pane layouts.
Give MA Dispersion+ a try and let your charts breathe — you’ll never look at moving-average ribbons the same way again.
Happy trading!
Equal High/Low (EQH/EQL) [AlgoAlpha]OVERVIEW
This script detects and visualizes Equal High (EQH) and Equal Low (EQL) zones—key liquidity areas where price has previously stalled or reversed. These levels often attract institutional interest due to the liquidity buildup around them. The indicator is built to highlight such zones using dynamic thresholding, overbought/oversold RSI filtering, and adaptive mitigation logic to manage zone relevance over time.
CONCEPTS
Equal Highs/Lows are price points where the market has repeatedly failed to break past a certain high or low, hinting at areas where stop orders and pending interest may be concentrated. These areas are often prime targets for liquidity grabs or reversals. By combining this with RSI filtering, the script avoids false signals during neutral conditions and instead focuses on zones where market pressure is more directional.
FEATURES
Detection Logic: The script identifies EQH and EQL zones by comparing the similarity between recent highs or lows with a dynamic volatility threshold. The `tolerance` input allows users to control how strict this comparison is.
RSI Filtering: If enabled, it only creates zones when RSI is significantly overbought or oversold (based on the `state_thresh` input). This helps ensure zones form only in meaningful market conditions.
Zone Display: Bullish (EQL) zones are shown in grey, while bearish (EQH) zones are in blue. Two horizontal lines mark the zone using wick and body extremes, and a filled area visualizes the zone between them.
Zone Management: Zones automatically extend with price until they’re invalidated. You can choose whether a zone is removed based on wick or body sweeps and whether it requires one or two candle confirmations. Zones also expire after a customizable number of bars.
Alerts: Four alert conditions are built in—when a new EQH/EQL is formed and when one is mitigated—making it easy to integrate into alert-based workflows.
USAGE
Equal highs/lows can be used as liquidity markers, either as entry points or as take-profit targets.
This tool is ideal for liquidity-based strategies and helps traders map out possible reversal or sweep zones that often precede aggressive moves.

Reverse Keltner Channel StrategyReverse Keltner Channel Strategy
Overview
The Reverse Keltner Channel Strategy is a mean-reversion trading system that capitalizes on price movements between Keltner Channels. Unlike traditional Keltner Channel strategies that trade breakouts, this system takes the contrarian approach by entering positions when price returns to the channel after overextending.
Strategy Logic
Long Entry Conditions:
Price crosses above the lower Keltner Channel from below
This signals a potential reversal after an oversold condition
Position is entered at market price upon signal confirmation
Long Exit Conditions:
Take Profit: Price reaches the upper Keltner Channel
Stop Loss: Placed at half the channel width below entry price
Short Entry Conditions:
Price crosses below the upper Keltner Channel from above
This signals a potential reversal after an overbought condition
Position is entered at market price upon signal confirmation
Short Exit Conditions:
Take Profit: Price reaches the lower Keltner Channel
Stop Loss: Placed at half the channel width above entry price
Key Features
Mean Reversion Approach: Takes advantage of price tendency to return to mean after extreme moves
Adaptive Stop Loss: Stop loss dynamically adjusts based on market volatility via ATR
Visual Signals: Entry points clearly marked with directional triangles
Fully Customizable: All parameters can be adjusted to fit various market conditions
Customizable Parameters
Keltner EMA Length: Controls the responsiveness of the channel (default: 20)
ATR Multiplier: Determines channel width/sensitivity (default: 2.0)
ATR Length: Affects volatility calculation period (default: 10)
Stop Loss Factor: Adjusts risk management aggressiveness (default: 0.5)
Best Used On
This strategy performs well on:
Currency pairs with defined ranging behavior
Commodities that show cyclical price movements
Higher timeframes (4H, Daily) for more reliable signals
Markets with moderate volatility
Risk Management
The built-in stop loss mechanism automatically adjusts to market conditions by calculating position risk relative to the current channel width. This approach ensures that risk remains proportional to potential reward across varying market conditions.
Notes for Optimization
Consider adjusting the EMA length and ATR multiplier based on the specific asset and timeframe:
Lower values increase sensitivity and generate more signals
Higher values produce fewer but potentially more reliable signals
As with any trading strategy, thorough backtesting is recommended before live implementation.
Past performance is not indicative of future results. Always practice sound risk management.

Long-Term VWAP Mean Reversion SDCACore Idea:
This indicator is designed to support Strategic Dollar Cost Averaging (SDCA) for Bitcoin using a cumulative VWAP-based mean reversion model. It helps long-term investors identify high-conviction buy zones and overbought conditions using statistical deviation from the cumulative VWAP. This indicator evaluates how much price is stretched from the true market average price, weighted by cumulative volume over time.
Core Concepts and Formulas:
Cumulative VWAP (Volume Weighted Average Price):
VWAP cumulative = ∑(Price×Volume) / ∑Volume
A long-term anchor that reflects the average dollar cost of all market participants across all candles. This version does not reset daily, unlike intraday VWAP.
VWAP Deviation % :
Deviation% = Price - VWAP cumulative / VWAP cumulative x 100
Shows how far current price has diverged from the long-term fair value.
Z-Score of VWAP Deviation:
Z= (Price−VWAP)−μ / σ (lookback period: default 200)
SDCA Multiplier Mapping:
*Keep in mind in my Z-Score system, -2 represents the overbought level (white horizontal line) and +2 represents oversold (cyan horizontal line) conditions. So the scores on the Y axis and Z-score in the table are reversed.
| Z-Score Range | SDCA Multiplier |
---------------------------------------------
| ≤ -2 | 0.25×
| -1 to +1 | 1.0×
| > +2 | 2.0×
The pink line plots this multiplier. It’s meant to control buy weight at each time step.
How to Use This for SDCA:
-Buy normally when the multiplier is 1.0× (Z-score between -1 and +1)
-Accelerate buying when Z-score is deeply negative (price far below VWAP)
-Slow or pause buying when Z-score is high (price far above VWAP)
-Use the stats panel to track current Z-score, VWAP level, deviation %, and multiplier
-Watch the red/blue backgrounds as visual confirmation of oversold/overbought zones
Inputs:
Z-Score Lookback Length:
Default: 200 but can be adjusted.
Visuals:
Z-Score Line (cyan): shows current standardized deviation from VWAP
Multiplier Line (bright pink): your SDCA intensity signal
Background Zones: cyan = oversold, white = overbought
Horizontal Lines: +2 and -2 standard deviation thresholds
Stats Panel (bottom right): live values for Z-score, multiplier, price, VWAP, and the deviation formula
Suited For:
-Long-term Bitcoin investors
-SDCA Systems
-Mean reversion systems
-Macro-level buy/sell planning

Market Structure Confluence [AlgoAlpha]OVERVIEW
This script is called "Market Structure Confluence" and it combines classic market structure analysis with a dynamic volatility-based band system to detect shifts in trend and momentum more reliably. It tracks key swing points (higher highs, higher lows, lower highs, lower lows) to define the trend, then overlays a basis and ATR-smoothed volatility bands to catch rejection signals and highlight potential inflection points in the market.
CONCEPTS
Market structure is the foundation of price action trading, focusing on the relationship between successive highs and lows to understand trend conditions. Break of Structure (BOS) and Change of Character (CHoCH) events are important because they signal when a market might be shifting direction. This script enhances traditional structure by integrating volatility bands, which act like dynamic support/resistance zones based on ATR, allowing it to capture momentum surges and rejections beyond just structural shifts.
FEATURES
Swing Detection: It detects and labels Higher Highs (HH), Higher Lows (HL), Lower Highs (LH), and Lower Lows (LL) based on user-defined time horizons, helping traders quickly spot the trend direction.
BOS and CHoCH Lines: When a previous swing point is broken, the script automatically plots a Break of Structure (BOS) line. If the break represents a major trend reversal (a CHoCH), it is marked differently to separate simple breakouts from real trend changes.
Rejection Signals: Special arrows plot when price pierces a band and then pulls back, suggesting a potential trap move or rejection signal in the direction of the new structure.
Alerts: Built-in alerts for structure breaks, CHoCHs, swing points, rejections at bands, and trend flips make it easy to automate setups without manually watching the chart.
USAGE
Set your preferred swing detection size depending on your timeframe and trading style — smaller numbers for intraday, larger numbers for swing trading. Choose whether you want BOS/CHoCH confirmed by candle closes or by wick breaks. Use the volatility band settings to fine-tune how tightly or loosely the bands hug the price, adjusting sensitivity based on market conditions. When a BOS or CHoCH occurs, or when a rejection happens at the bands, the script will highlight it clearly and optionally trigger alerts. Watch for combinations where both structure breaks and volatility band rejections happen together — those are high-quality trade signals. This setup works best when used with basic trend filtering and higher timeframe confirmation.

Breadth-Driven Swing StrategyWhat it does
This script trades the S&P 500 purely on market breadth extremes:
• Data source : INDEX:S5TH = % of S&P 500 stocks above their own 200-day SMA (range 0–100).
• Buy when breadth is washed-out.
• Sell when breadth is overheated.
It is long-only by design; shorting and ATR trailing stops have been removed to keep the logic minimal and transparent.
⸻
Signals in plain English
1. Long entry
A. A 200-EMA trough in breadth is printed and the trough value is ≤ 40 %.
or
B. A 5-EMA trough appears, its prominence passes the user threshold, and the lowest breadth reading in the last 20 bars is ≤ 20 %.
(Toggle this secondary trigger on/off with “ Enter also on 5-EMA trough ”.)
2. Exit (close long)
First 200-EMA peak whose breadth value is ≥ 70 %.
3. Risk control
A fixed stop-loss (% of entry price, default 8 %) is attached to every long trade.
⸻
Key parameters (defaults shown)
• Long EMA length 200 • Short EMA length 5
• Peak prominence 0.5 pct-pts • Trough prominence 3 pct-pts
• Peak level 70 % • Trough level 40 % • 5-EMA trough level 20 %
• Fixed stop-loss 8 %
• “Enter also on 5-EMA trough” = true (allows additional entries on extreme momentum reversals)
Feel free to tighten or relax any of these thresholds to match your risk profile or account for different market regimes.
⸻
How to use it
1. Load the script on a daily SPX / SPY chart.
(The price chart drives order execution; the breadth series is pulled internally and does not need to be on the chart.)
2. Verify the breadth feed.
INDEX:S5TH is updated after each session; your broker must provide it.
3. Back-test across several cycles.
Two decades of daily data is recommended to see how the rules behave in bear markets, range markets, and bull trends.
4. Adjust position sizing in the Properties tab.
The default is “100 % of equity”; change it if you prefer smaller allocations or pyramiding caps.
⸻
Why it can help
• Breadth signals often lead price, allowing entries before index-level momentum turns.
• Simple, rule-based exits prevent “waiting for confirmation” paralysis.
• Only one input series—easy to audit, no black-box math.
Trade-offs
• Relies on a single breadth metric; other internals (advance/decline, equal-weight returns, etc.) are ignored.
• May sit in cash during shallow pullbacks that never push breadth ≤ 40 %.
• Signals arrive at the end of the session (breadth is EoD data).
⸻
Disclaimer
This script is provided for educational purposes only and is not financial advice. Markets are risky; test thoroughly and use your own judgment before trading real money.
ストラテジー概要
本スクリプトは S&P500 のマーケットブレッド(内部需給) だけを手がかりに、指数をスイングトレードします。
• ブレッドデータ : INDEX:S5TH
(S&P500 採用銘柄のうち、それぞれの 200 日移動平均線を上回っている銘柄比率。0–100 %)
• 買い : ブレッドが極端に売られたタイミング。
• 売り : ブレッドが過熱状態に達したタイミング。
余計な機能を削り、ロングオンリー & 固定ストップ のシンプル設計にしています。
⸻
シグナルの流れ
1. ロングエントリー
• 条件 A : 200-EMA がトラフを付け、その値が 40 % 以下
• 条件 B : 5-EMA がトラフを付け、
・プロミネンス条件を満たし
・直近 20 本のブレッドス最小値が 20 % 以下
• B 条件は「5-EMA トラフでもエントリー」を ON にすると有効
2. ロング決済
最初に出現した 200-EMA ピーク で、かつ値が 70 % 以上 のバーで手仕舞い。
3. リスク管理
各トレードに 固定ストップ(初期価格から 8 %)を設定。
⸻
主なパラメータ(デフォルト値)
• 長期 EMA 長さ : 200 • 短期 EMA 長さ : 5
• ピーク判定プロミネンス : 0.5 %pt • トラフ判定プロミネンス : 3 %pt
• ピーク水準 : 70 % • トラフ水準 : 40 % • 5-EMA トラフ水準 : 20 %
• 固定ストップ : 8 %
• 「5-EMA トラフでもエントリー」 : ON
相場環境やリスク許容度に合わせて閾値を調整してください。
⸻
使い方
1. 日足の SPX / SPY チャート にスクリプトを適用。
2. ブレッドデータの供給 (INDEX:S5TH) がブローカーで利用可能か確認。
3. 20 年以上の期間でバックテスト し、強気相場・弱気相場・レンジ局面での挙動を確認。
4. 資金配分 は プロパティ → 戦略実行 で調整可能(初期値は「資金の 100 %」)。
⸻
強み
• ブレッドは 価格より先行 することが多く、天底を早期に捉えやすい。
• ルールベースの出口で「もう少し待とう」と迷わずに済む。
• 入力 series は 1 本のみ、ブラックボックス要素なし。
注意点・弱み
• 単一指標に依存。他の内部需給(A/D ライン等)は考慮しない。
• 40 % を割らない浅い押し目では機会損失が起こる。
• ブレッドは終値ベースの更新。ザラ場中の変化は捉えられない。
⸻
免責事項
本スクリプトは 学習目的 で提供しています。投資助言ではありません。
実取引の前に必ず自己責任で十分な検証とリスク管理を行ってください。

QuantumSync Pulse [ w.aritas ]QuantumSync Pulse (QSP) is an advanced technical indicator crafted for traders seeking a dynamic and adaptable tool to analyze diverse market conditions. By integrating momentum, mean reversion, and regime detection with quantum-inspired calculations and entropy analysis, QSP offers a powerful histogram that reflects trend strength and market uncertainty. With multi-timeframe synchronization, adaptive filtering, and customizable visualization, it’s a versatile addition to any trading strategy.
Key Features
Hybrid Signals: Combines momentum and mean reversion, dynamically weighted by market regime.
Quantum Tunneling: Enhances responsiveness in volatile markets using volatility-adjusted calculations.
3-State Entropy: Assesses market uncertainty across up, down, and neutral states.
Regime Detection: Adapts signal weights with Hurst exponent and volatility ROC.
Multi-Timeframe Alignment: Syncs with higher timeframe trends for context.
Customizable Histogram: Displays trend strength with ADX-based visuals and flexible styling.
How to Use and Interpret
Histogram Interpretation
Positive (Above Zero): Bullish momentum; color intensity shows trend strength.
Negative (Below Zero): Bearish momentum; gradients indicate weakness.
Overlaps: Alignment of final_z (signal) and ohlc4 (price) histograms highlights key price levels or turning points.
Regime Visualization
Green Background: Trending market; prioritize momentum signals.
Red Background: Mean-reverting market; focus on reversion signals.
Blue Background: Neutral state; balance both signal types.
Trading Signals
Buy: Histogram crosses above zero or shows positive divergence between histograms.
Sell: Histogram crosses below zero or exhibits negative divergence.
Confirmation: Match signals with regime background—green for trends, red for ranges.
Customization
Tweak Momentum Length, Entropy Lookback, and Hurst Exponent Lookback for sensitivity.
Adjust color themes and transparency to suit your charts.
Tips for Optimal Use
Timeframes: Use higher timeframes (1h, 4h) for trend context and lower (5m, 15m) for entries.
Pairing: Combine with RSI, MACD, or volume indicators for confirmation.
Backtesting: Test settings on historical data for asset-specific optimization.
Overlaps: Watch for histogram overlaps to identify support, resistance, or reversals.
Simulated Performance
Trending Markets: Histogram stays above/below zero, with overlaps at retracements for entries.
Range-Bound Markets: Oscillates around zero; overlaps signal reversals in red regimes.
Volatile Markets: Quantum tunneling ensures quick reactions, with filters reducing noise.
Elevate your trading with QuantumSync Pulse—a sophisticated tool that adapts to the market’s rhythm and your unique style.

Impulse Volume Oscillator [Alpha Extract]Impulse Volume Oscillator
A sophisticated indicator designed to identify market impulse moves and volume-based momentum shifts, helping traders capture significant price movements with precision.
Combining price deviations with volume analysis, this oscillator dynamically measures market strength and weakness, providing clear signals for potential trend continuations and reversals.
🔶 Volume-Adjusted Normalization
Utilizes a unique normalization technique that incorporates volume impact to enhance signal quality. This approach ensures the indicator responds more strongly to high-volume price movements while filtering out low-volume noise.
vol_ratio = ta.rsi(volume, 14) / 50
vol_factor = vol_impact > 0 ? 1 + (vol_ratio - 1) * vol_impact : 1
raw_normalized = dev / (ta.stdev(source, bars) * mult)
vol_adjusted = raw_normalized * vol_factor
normalized = ta.sma(vol_adjusted, smooth)
🔶 Adaptive Regime Detection
Incorporates threshold-based regime identification that clearly distinguishes between trending and mean-reverting market conditions. The customizable threshold system allows traders to adapt to different market volatilities and timeframes.
🔶 Customizable Parameters
Fine-tune detection sensitivity with adjustable inputs for lookback period, standard deviation multiplier, volume impact, and signal smoothing. These parameters enable traders to optimize the indicator for various trading styles and market conditions.
❓How It Works
🔶 Impulse Calculation
The oscillator measures price deviation from a moving average baseline, normalized by standard deviation, and then adjusts the signal based on relative volume strength. This creates a responsive yet stable indicator that accurately reflects market momentum.
// Calculate the basis using the selected MA
basis = get_ma(source, bars)
// Calculate the normalized value with volume impact
dev = source - basis
🔶 Dynamic Visualization
The histogram changes color based on signal strength, providing instant visual cues about market conditions. Green bars indicate positive momentum while red bars represent negative momentum, with color intensity reflecting signal strength.
🔶 Trend Confirmation
Built-in trend direction analysis provides confluence with the primary signal, helping traders distinguish between counter-trend bounces and genuine trend reversals. This dual-confirmation approach significantly reduces false signals.
🔶 Visual Alerts & Boundary Tracking
Monitors signal extremes and dynamically adjusts visualization transparency based on signal strength. The indicator highlights particularly strong impulse moves with background shading, making potential trading opportunities immediately apparent.
🔶 Custom Candle Coloring
Optional candle coloring applies the same color logic as the histogram directly to price candles, providing a unified visual framework that helps traders correlate indicator signals with price action.
🔶 Momentum Shift Detection
Automatically identifies important zero-line crossovers that often signify the beginning of new impulse moves. These transition points frequently offer favorable risk/reward entry opportunities.
🔶 Snapshot samples
1 Week
1 Day
15 Min
🔶 Why Choose AE - Impulse Volume Oscillator?
This indicator provides a comprehensive approach to identifying significant market moves by combining volume analysis with price momentum. By offering clear visual signals for both trend continuation and reversal scenarios, it empowers traders to make more informed decisions across various market conditions and timeframes.

Aurora Flow Oscillator [QuantAlgo]The Aurora Flow Oscillator is an advanced momentum-based technical indicator designed to identify market direction, momentum shifts, and potential reversal zones using adaptive filtering techniques. It visualizes price momentum through a dynamic oscillator that quantifies trend strength and direction, helping traders and investors recognize momentum shifts and trading opportunities across various timeframes and asset class.
🟢 Technical Foundation
The Aurora Flow Oscillator employs a sophisticated mathematical approach with adaptive momentum filtering to analyze market conditions, including:
Price-Based Momentum Calculation: Calculates logarithmic price changes to measure the rate and magnitude of market movement
Adaptive Momentum Filtering: Applies an advanced filtering algorithm to smooth momentum calculations while preserving important signals
Acceleration Analysis: Incorporates momentum acceleration to identify shifts in market direction before they become obvious
Signal Normalization: Automatically scales the oscillator output to a range between -100 and 100 for consistent interpretation across different market conditions
The indicator processes price data through multiple filtering stages, applying mathematical principles including exponential smoothing with adaptive coefficients. This creates an oscillator that dynamically adjusts to market volatility while maintaining responsiveness to genuine trend changes.
🟢 Key Features & Signals
1. Momentum Flow and Extreme Zone Identification
The oscillator presents market momentum through an intuitive visual display that clearly indicates both direction and strength:
Above Zero: Indicates positive momentum and potential bullish conditions
Below Zero: Indicates negative momentum and potential bearish conditions
Slope Direction: The angle and direction of the oscillator provide immediate insight into momentum strength
Zero Line Crossings: Signal potential trend changes and new directional momentum
The indicator also identifies potential overbought and oversold market conditions through extreme zone markings:
Upper Zone (>50): Indicates strong bullish momentum that may be approaching exhaustion
Lower Zone (<-50): Indicates strong bearish momentum that may be approaching exhaustion
Extreme Boundaries (±95): Mark potentially unsustainable momentum levels where reversals become increasingly likely
These zones are displayed with gradient intensity that increases as the oscillator moves toward extremes, helping traders and investors:
→ Identify potential reversal zones
→ Determine appropriate entry and exit points
→ Gauge overall market sentiment strength
2. Customizable Trading Style Presets
The Aurora Flow Oscillator offers pre-configured settings for different trading approaches:
Default (80,150): Balanced configuration suitable for most trading and investing situations.
Scalping (5,80): Highly responsive settings for ultra-short-term trades. Generates frequent signals and catches quick price movements. Best for 1-15min charts when making many trades per day.
Day Trading (8,120): Optimized for intraday movements with faster response than default settings while maintaining reasonable signal quality. Ideal for 5-60min or 4h-12h timeframes.
Swing Trading (10,200): Designed for multi-day positions with stronger noise filtering. Focuses on capturing larger price swings while avoiding minor fluctuations. Works best on 1-4h and daily charts.
Position Trading (14,250): For longer-term position traders/investors seeking significant market trends. Reduces false signals by heavily filtering market noise. Ideal for daily or even weekly charts.
Trend Following (16,300): Maximum smoothing that prioritizes established directional movements over short-term fluctuations. Best used on daily and weekly charts, but can also be used for lower timeframe trading.
Countertrend (7,100): Tuned to detect potential reversals and exhaustion points in trends. More sensitive to momentum shifts than other presets. Effective on 15min-4h charts, as well as daily and weekly charts.
Each preset automatically adjusts internal parameters for optimal performance in the selected trading context, providing flexibility across different market approaches without requiring complex manual configuration.
🟢 Practical Usage Tips
1/ Trend Analysis and Interpretation
→ Direction Assessment: Evaluate the oscillator's position relative to zero to determine underlying momentum bias
→ Momentum Strength: Measure the oscillator's distance from zero within the -100 to +100 range to quantify momentum magnitude
→ Trend Consistency: Monitor the oscillator's path for sustained directional movement without frequent zero-line crossings
→ Reversal Detection: Watch for oscillator divergence from price and deceleration of movement when approaching extreme zones
2/ Signal Generation Strategies
Depending on your trading approach, multiple signal strategies can be employed:
Trend Following Signals:
Enter long positions when the oscillator crosses above zero
Enter short positions when the oscillator crosses below zero
Add to positions on pullbacks while maintaining the overall trend direction
Countertrend Signals:
Look for potential reversals when the oscillator reaches extreme zones (±95)
Enter contrary positions when momentum shows signs of exhaustion
Use oscillator divergence with price as additional confirmation
Momentum Shift Signals:
Enter positions when oscillator changes direction after establishing a trend
Exit positions when oscillator direction reverses against your position
Scale position size based on oscillator strength percentage
3/ Timeframe Optimization
The indicator can be effectively applied across different timeframes with these considerations:
Lower Timeframes (1-15min):
Use Scalping or Day Trading presets
Focus on quick momentum shifts and zero-line crossings
Be cautious of noise in extreme market conditions
Medium Timeframes (30min-4h):
Use Default or Swing Trading presets
Look for established trends and potential reversal zones
Combine with support/resistance analysis for entry/exit precision
Higher Timeframes (Daily+):
Use Position Trading or Trend Following presets
Focus on major trend identification and long-term positioning
Use extreme zones for position management rather than immediate reversals
🟢 Pro Tips
Price Momentum Period:
→ Lower values (5-7) increase sensitivity to minor price fluctuations but capture more market noise
→ Higher values (10-16) emphasize sustained momentum shifts at the cost of delayed response
→ Adjust based on your timeframe (lower for shorter timeframes, higher for longer timeframes)
Oscillator Filter Period:
→ Lower values (80-120) produce more frequent directional changes and earlier response to momentum shifts
→ Higher values (200-300) filter out shorter-term fluctuations to highlight dominant market cycles
→ Match to your typical holding period (shorter holding time = lower filter values)
Multi-Timeframe Analysis:
→ Compare oscillator readings across different timeframes for confluence
→ Look for alignment between higher and lower timeframe signals
→ Use higher timeframe for trend direction, lower for earlier entries
Volatility-Adaptive Trading:
→ Use oscillator strength to adjust position sizing (stronger = larger)
→ Consider reducing exposure when oscillator reaches extreme zones
→ Implement tighter stops during periods of oscillator acceleration
Combination Strategies:
→ Pair with volume indicators for confirmation of momentum shifts
→ Use with support/resistance levels for strategic entry and exit points
→ Combine with volatility indicators for comprehensive market context

Advanced Momentum Scanner [QuantAlgo]The Advanced Momentum Scanner is a sophisticated technical indicator designed to identify market momentum and trend direction using multiple exponential moving averages (EMAs), momentum metrics, and adaptive visualization techniques. It is particularly valuable for those looking to identify trading and investing opportunities based on trend changes and momentum shifts across any market and timeframe.
🟢 Technical Foundation
The Advanced Momentum Scanner utilizes a multi-layered approach with four different EMA periods to identify market momentum and trend direction:
Ultra-Fast EMA for quick trend changes detection (default: 5)
Fast EMA for short-term trend analysis (default: 10)
Mid EMA for intermediate confirmation (default: 30)
Slow EMA for long-term trend identification (default: 100)
For momentum detection, the indicator implements a Rate of Change (RoC) calculation to measure price momentum over a specified period. It further enhances analysis by incorporating RSI readings for overbought/oversold conditions, volatility measurements through ATR, and optional volume confirmation. When these elements align, the indicator generates trading signals based on the selected sensitivity mode (Conservative, Balanced, or Aggressive).
🟢 Key Features & Signals
1. Multi-Period Trend Identification
The indicator combines multiple EMAs of different lengths to provide comprehensive trend analysis within the same timeframe, displaying the information through color-coded visual elements on the chart.
When an uptrend is detected, chart elements are colored with the bullish theme color (default: green/teal).
Similarly, when a downtrend is detected, chart elements are colored with the bearish theme color (default: red).
During neutral or indecisive periods, chart elements are colored with a neutral gray color, providing clear visual distinction between trending and non-trending market conditions.
This visualization provides immediate insights into underlying trend direction without requiring separate indicators, helping traders and investors quickly identify the market's current state.
2. Trend Strength Information Panel
The trend panel operates in three different sensitivity modes (Conservative, Aggressive, and Balanced), each affecting how the indicator processes and displays market information.
The Conservative mode prioritizes trend sustainability over frequency, showing only strong trend movements with high probability.
The Aggressive mode detects early trend changes, providing more frequent signals but potentially more false positives.
The Balanced mode offers a middle ground with moderate signal frequency and reliability.
Regardless of the selected mode, the panel displays:
Current trend direction (UPTREND, DOWNTREND, or NEUTRAL)
Trend strength percentage (0-100%)
Early detection signals when applicable
The active sensitivity mode
This comprehensive approach helps traders and investors:
→ Assess the strength of current market trends
→ Identify early potential trend changes before full confirmation
→ Make more informed trading and investing decisions based on trend context
3. Customizable Visualization Settings
This indicator offers extensive visual customization options to suit different trading styles and preferences:
Display options:
→ Fully customizable uptrend, downtrend, and neutral colors
→ Color-coded price bars showing trend direction
→ Dynamic gradient bands visualizing potential trend channels
→ Optional background coloring based on trend intensity
→ Adjustable transparency levels for all visual elements
These visualization settings can be fine-tuned through the indicator's interface, allowing traders and investors to create a personalized chart environment that emphasizes the most relevant information for their strategy.
The indicator also features a comprehensive alert system with notifications for:
New trend formations (uptrend, downtrend, neutral)
Early trend change signals
Momentum threshold crossovers
Other significant market conditions
Alerts can be customized and delivered through TradingView's notification system, making it easy to stay informed of important market developments even when you are away from the charts.
🟢 Practical Usage Tips
→ Trend Analysis and Interpretation: The indicator visualizes trend direction and strength directly on the chart through color-coding and the information panel, allowing traders and investors to immediately identify the current market context. This information helps in assessing the potential for continuation or reversal.
→ Signal Generation Strategies: The indicator generates potential trading signals based on trend direction, momentum confirmation, and selected sensitivity mode. Users can choose between Conservative (fewer but more reliable signals), Balanced (moderate approach), or Aggressive (more frequent but potentially less reliable signals).
→ Multi-Period Trend Assessment: Through its layered EMA approach, the indicator enables users to understand trend conditions across different lookback periods within the same timeframe. This helps in identifying the dominant trend and potential turning points.
🟢 Pro Tips
Adjust EMA periods based on your timeframe:
→ Lower values for shorter timeframes and more frequent signals
→ Higher values for higher timeframes and more reliable signals
Fine-tune sensitivity mode based on your trading style:
→ "Conservative" for position trading/long-term investing and fewer false signals
→ "Balanced" for swing trading/medium-term investing with moderate signal frequency
→ "Aggressive" for scalping/day trading and catching early trend changes
Look for confluence between components:
→ Strong trend strength percentage and direction in the information panel
→ Overall market context aligning with the expected direction
Use for multiple trading approaches:
→ Trend following during strong momentum periods
→ Counter-trend trading at band extremes during overextension
→ Early trend change detection with sensitivity adjustments
→ Stop loss placement using dynamic bands
Combine with:
→ Volume indicators for additional confirmation
→ Support/resistance analysis for strategic entry/exit points
→ Multiple timeframe analysis for broader market context

Gradient Range [BigBeluga]
This indicator highlights range-bound market conditions by dynamically plotting gradient-colored candlesticks within a defined price box. It detects whether the market is ranging or trending using ADX and can identify mean reversion points when price steps outside the established range.
🔵KEY FEATURES:
Range Detection Box:
➣ A transparent box is drawn based on the highest and lowest price close over a user-defined period.
➣ Helps visualize range boundaries and the midline for support/resistance reference.
Gradient Candlestick Coloring:
➣ Candles inside the range are colored with a gradient from top to bottom based on proximity to the midline.
➣ Top range candles are shaded with bearish tones, while bottom range candles use bullish tones.
Ranging/Trending State Detection:
➣ Uses ADX to determine if the market is currently in a ranging or trending state.
➣ A label in the bottom right corner shows a real-time status (🟢 Ranging / 🟡 Trending).
Mean Reversion Signal Circles:
➣ When the market is ranging, white circles are plotted at highs/lows that breach the box boundary, indicating potential mean reversion points.
➣ These levels can act as fade trade setups or exhaustion markers.
🔵USAGE:
Range Trading: Trade between the upper and lower boundaries during range-bound conditions with clearer visual feedback.
Mean Reversion Plays: Use circle signals as early alerts to identify when price extends beyond the range and may revert to the mean.
Visual Trend Strength: Instantly recognize where price is concentrated inside the range via the color gradient system.
Ranging Filter: Use the ADX label to avoid false setups during strong trending periods.
Gradient Range provides an elegant and data-driven approach to range-bound market analysis. With its gradient visualization and smart reversion detection, it empowers traders to better time entries and exits within consolidation zones.

Trend Targets [AlgoAlpha]OVERVIEW
This script combines a smoothed trend-following model with dynamic price rejection logic and ATR-based target projection to give traders a complete visual framework for trading trend continuations. It overlays on price and automatically detects potential trend shifts, confirms rejections near dynamic support/resistance, and displays calculated stop-loss and take-profit levels to support structured risk-reward management. Unlike traditional indicators that only show trend direction or signal entries, this tool brings together a unique mix of signal validation, volatility-aware positioning, and layered profit-taking to guide decision-making with more context.
CONCEPTS
The core trend logic is built on a custom Supertrend that uses an ATR-based band structure with long smoothing chains—first through a WMA, then an EMA—allowing the trend line to respond to major shifts while ignoring noise. A key addition is the use of rejection logic: the script looks for consolidation candles that "hug" the smoothed trend line and counts how many consecutive bars reject from it. This behavior often precedes significant moves. A user-defined threshold filters out weak tests and highlights only meaningful rejections.
FEATURES
Trend Detection : Automatically identifies trend direction using a smoothed Supertrend (WMA + EMA), with shape markers on trend shifts and color-coded bars for clarity.
Rejection Signals : Detects price rejections at the trend line after a user-defined number of consolidation bars; plots ▲/▼ icons to highlight strong continuation setups.
Target Projection : On trend confirmation, plots entry, stop-loss (ATR-based), and three dynamic take-profit levels based on customizable multiples.
Dynamic Updates : All levels (entry, SL, TP1–TP3) auto-adjust based on volatility and are labeled in real time on the chart.
Customization : Users can tweak trend parameters, rejection confirmation count, SL/TP ratios, smoothing lengths, and appearance settings.
Alerts : Built-in alerts for trend changes, rejection events, and when TP1, TP2, or TP3 are reached.
Chart Overlay : Plots directly on price chart with minimal clutter and clearly labeled levels for easy trading.
USAGE
Start by tuning the Supertrend factor and ATR period to fit your asset and timeframe—higher values will catch bigger swings, lower values catch faster moves. The confirmation count should match how tightly you want to filter rejection behavior—higher values make signals rarer but stronger. When the trend shifts, the indicator colors the bars and line accordingly, and if enabled, plots the full entry-TP-SL structure. Rejection markers appear only after enough qualifying bars confirm price pressure at the trend line. This is especially useful for continuation plays where price retests the trend but fails to break it. All calculations are based on volatility (ATR), so targets naturally adjust with market conditions. Add alerts to get notified of important signals even when away from the chart.

Institutional Quantum Momentum Impulse [BullByte]## Overview
The Institutional Quantum Momentum Impulse (IQMI) is a sophisticated momentum oscillator designed to detect institutional-level trend strength, volatility conditions, and market regime shifts. It combines multiple advanced technical concepts, including:
- Quantum Momentum Engine (Hilbert Transform + MACD Divergence + Stochastic Energy)
- Fractal Volatility Scoring (GARCH + Keltner-based volatility)
- Dynamic Adaptive Bands (Self-adjusting thresholds based on efficiency)
- Market Phase Detection (Volume + Momentum alignment)
- Liquidity & Cumulative Delta Analysis
The indicator provides a Z-score normalized momentum reading, making it ideal for mean-reversion and trend-following strategies.
---
## Key Features
### 1. Quantum Momentum Core
- Combines Hilbert Transform, MACD divergence, and Stochastic Energy into a single composite momentum score.
- Normalized using a Z-score for statistical significance.
- Smoothed with EMA/WMA/HMA for cleaner signals.
### 2. Dynamic Adaptive Bands
- Upper/Lower bands adjust based on volatility and efficiency ratio .
- Acts as overbought/oversold zones when momentum reaches extremes.
### 3. Market Phase Detection
- Identifies bullish , bearish , or neutral phases using:
- Volume-Weighted MA alignment
- Fractal momentum extremes
### 4. Volatility & Liquidity Filters
- Fractal Volatility Score (0-100 scale) shows market instability.
- Liquidity Check ensures trades are taken in favorable spread conditions.
### 5. Dashboard & Visuals
- Real-time dashboard with key metrics:
- Momentum strength, volatility, efficiency, cumulative delta, and market regime.
- Gradient coloring for intuitive momentum visualization .
---
## Best Trade Setups
### 1. Trend-Following Entries
- Signal :
- QM crosses above zero + Market Phase = Bullish + ADX > 25
- Cumulative Delta rising (buying pressure)
- Confirmation :
- Efficiency > 0.5 (strong momentum quality)
- Liquidity = High (tight spreads)
### 2. Mean-Reversion Entries
- Signal :
- QM touches upper band + Volatility expanding
- Market Regime = Ranging (ADX < 25)
- Confirmation :
- Efficiency < 0.3 (weak momentum follow-through)
- Cumulative Delta divergence (price high but delta declining)
### 3. Breakout Confirmation
- Signal :
- QM holds above zero after a pullback
- Market Phase shifts to Bullish/Bearish
- Confirmation :
- Volatility rising (expansion phase)
- Liquidity remains high
---
## Recommended Timeframes
- Intraday (5M - 1H): Works well for scalping & swing trades.
- Swing Trading (4H - Daily): Best for trend-following setups.
- Position Trading (Weekly+): Useful for macro trend confirmation.
---
## Input Customization
- Resonance Factor (1.0 - 3.618 ): Adjusts MACD divergence sensitivity.
- Entropy Filter (0.382/0.50/0.618) : Controls stochastic damping.
- Smoothing Type (EMA/WMA/HMA) : Changes momentum responsiveness.
- Normalization Period : Adjusts Z-score lookback.
---
The IQMI is a professional-grade momentum indicator that combines institutional-level concepts into a single, easy-to-read oscillator. It works across all markets (stocks, forex, crypto) and is ideal for traders who want:
✅ Early trend detection
✅ Volatility-adjusted signals
✅ Institutional liquidity insights
✅ Clear dashboard for quick analysis
Try it on TradingView and enhance your trading edge! 🚀
Happy Trading!
- BullByte

Ratio S/RRatio S/R - Intraday Support & Resistance Levels
Introduction
This script identifies key intraday support and resistance (S/R) levels where price tends to reverse frequently. It is designed specifically for intraday trading and aims to help traders find high-probability reversal zones.
The logic behind the script revolves around logarithmic returns, historical volatility, and ratio-based price levels. The script dynamically calculates price ranges using standard deviation-based volatility and applies preset ratio levels to determine potential support and resistance zones.
How It Works
Dynamic Range Calculation
The script calculates the price range based on the previous day’s logarithmic return volatility.
The range is then used to project different levels of price movement.
Reference Price
You can choose whether the reference price is from today’s open or yesterday’s close (oporcl setting).
This helps adapt the levels based on market behavior.
Ratio-Based Levels
The script applies specific ratios to the calculated range:
0.0833 (Minor Reversal Zone)
0.25 & 0.38 (Primary Reversal Zones)
0.62 & 0.75 (Significant Reversal Zones)
1.0 & 1.25 (Extreme Reversal Zones)
These levels act as potential support and resistance points.
Disclaimer: This is just for educational purpose . Trading is risky activity and how you use this tool is your own responsibility. The publisher of this tool does not make any claims.
HEMA Trend Levels [AlgoAlpha]OVERVIEW
This script plots two Hull-EMA (HEMA) curves to define a color-coded dynamic trend zone and generate context-aware breakout levels, allowing traders to easily visualize prevailing momentum and identify high-probability breakout retests. The script blends smoothed price tracking with conditional box plotting, delivering both trend-following and mean-reversion signals within one system. It is designed to be simple to read visually while offering nuanced trend shifts and test confirmations.
█ CONCEPTS
The Hull-EMA (HEMA) is a hybrid moving average combining the responsiveness of short EMAs with the smoothness of longer ones. It applies layered smoothing: first by subtracting a full EMA from a half-length EMA (doubling the short EMA's weight), and then by smoothing the result again with the square root of the original length. This process reduces lag while maintaining clarity in direction changes. In this script, two HEMAs—fast and slow—are used to define the trend structure and trigger events when they cross. These crossovers generate "trend shift boxes"—temporary support or resistance zones drawn immediately after trend transitions—to detect price retests in the new direction. When price cleanly retests these levels, the script marks them as confirmations with triangle symbols, helping traders isolate better continuation setups. Color-coded bars further enhance visual interpretation: bullish bars when price is above both HEMAs, bearish when below, and neutral (gray) when indecisive.
█ FEATURES
Bullish and bearish bar coloring based on price and HEMA alignment.
Box plotting at each crossover (bullish or bearish) to create short-term decision zones.
Real-time test detection: price must cleanly test and bounce from box levels to be considered valid.
Multiple alert conditions: crossover alerts, test alerts, and trend continuation alerts.
█ USAGE
Use this indicator on any time frame and asset. Adjust HEMA lengths to match your trading style—shorter lengths for scalping or intraday, longer for swing trading. The shaded area between HEMAs helps visually define the current trend. Watch for crossovers: a bullish crossover plots a green support box just below price, and a bearish one plots a red resistance box just above. These zones act as short-term decision points. When price returns to test a box and confirms with strong rejection (e.g., closes above for bullish or below for bearish), a triangle symbol is plotted. These tests can signal strong trend continuation. For traders looking for clean entries, combining the crossover with a successful retest improves reliability. Alerts can be enabled for all key signals: trend shift, test confirmations, and continuation conditions, making it suitable for automated setups or discretionary traders tracking multiple charts.

Multi-Anchored Linear Regression Channels [TANHEF]█ Overview:
The 'Multi-Anchored Linear Regression Channels ' plots multiple dynamic regression channels (or bands) with unique selectable calculation types for both regression and deviation. It leverages a variety of techniques, customizable anchor sources to determine regression lengths, and user-defined criteria to highlight potential opportunities.
Before getting started, it's worth exploring all sections, but make sure to review the Setup & Configuration section in particular. It covers key parameters like anchor type, regression length, bias, and signal criteria—essential for aligning the tool with your trading strategy.
█ Key Features:
⯁ Multi-Regression Capability:
Plot up to three distinct regression channels and/or bands simultaneously, each with customizable anchor types to define their length.
⯁ Regression & Deviation Methods:
Regressions Types:
Standard: Uses ordinary least squares to compute a simple linear trend by averaging the data and deriving a slope and endpoints over the lookback period.
Ridge: Introduces L2 regularization to stabilize the slope by penalizing large coefficients, which helps mitigate multicollinearity in the data.
Lasso: Uses L1 regularization through soft-thresholding to shrink less important coefficients, yielding a simpler model that highlights key trends.
Elastic Net: Combines L1 and L2 penalties to balance coefficient shrinkage and selection, producing a robust weighted slope that handles redundant predictors.
Huber: Implements the Huber loss with iteratively reweighted least squares (IRLS) and EMA-style weights to reduce the impact of outliers while estimating the slope.
Least Absolute Deviations (LAD): Reduces absolute errors using iteratively reweighted least squares (IRLS), yielding a slope less sensitive to outliers than squared-error methods.
Bayesian Linear: Merges prior beliefs with weighted data through Bayesian updating, balancing the prior slope with data evidence to derive a probabilistic trend.
Deviation Types:
Regressive Linear (Reverse): In reverse order (recent to oldest), compute weighted squared differences between the data and a line defined by a starting value and slope.
Progressive Linear (Forward): In forward order (oldest to recent), compute weighted squared differences between the data and a line defined by a starting value and slope.
Balanced Linear: In forward order (oldest to newest), compute regression, then pair to source data in reverse order (newest to oldest) to compute weighted squared differences.
Mean Absolute: Compute weighted absolute differences between each data point and its regression line value, then aggregate them to yield an average deviation.
Median Absolute: Determine the weighted median of the absolute differences between each data point and its regression line value to capture the central tendency of deviations.
Percent: Compute deviation as a percentage of a base value by multiplying that base by the specified percentage, yielding symmetric positive and negative deviations.
Fitted: Compare a regression line with high and low series values by computing weighted differences to determine the maximum upward and downward deviations.
Average True Range: Iteratively compute the weighted average of absolute differences between the data and its regression line to yield an ATR-style deviation measure.
Bias:
Bias: Applies EMA or inverse-EMA style weighting to both Regression and/or Deviation, emphasizing either recent or older data.
⯁ Customizable Regression Length via Anchors:
Anchor Types:
Fixed: Length.
Bar-Based: Bar Highest/Lowest, Volume Highest/Lowest, Spread Highest/Lowest.
Correlation: R Zero, R Highest, R Lowest, R Absolute.
Slope: Slope Zero, Slope Highest, Slope Lowest, Slope Absolute.
Indicator-Based: Indicators Highest/Lowest (ADX, ATR, BBW, CCI, MACD, RSI, Stoch).
Time-Based: Time (Day, Week, Month, Quarter, Year, Decade, Custom).
Session-Based: Session (Tokyo, London, New York, Sydney, Custom).
Event-Based: Earnings, Dividends, Splits.
External: Input Source Highest/Lowest.
Length Selection:
Maximum: The highest allowed regression length (also fixed value of “Length” anchor).
Minimum: The shortest allowed length, ensuring enough bars for a valid regression.
Step: The sampling interval (e.g., 1 checks every bar, 2 checks every other bar, etc.). Increasing the step reduces the loading time, most applicable to “Slope” and “R” anchors.
Adaptive lookback:
Adaptive Lookback: Enable to display regression regardless of too few historical bars.
⯁ Selecting Bias:
Bias applies separately to regression and deviation.
Positive values emphasize recent data (EMA-style), negative invert, and near-zero maintains balance. (e.g., a length 100, bias +1 gives the newest price ~7× more weight than the oldest).
It's best to apply bias to both (regression and deviation) or just the deviation. Biasing only regression may distort deviation visually, while biasing both keeps their relationship intuitive. Using bias only for deviation scales it without altering regression, offering unique analysis.
⯁ Scale Awareness:
Supports linear and logarithmic price scaling, the regression and deviations adjust accordingly.
⯁ Signal Generation & Alerts:
Customizable entry/exit signals and alerts, detailed in the dedicated section below.
⯁ Visual Enhancements & Real-World Examples:
Optional on-chart table display summarizing regression input criteria (display type, anchor type, source, regression type, regression bias, deviation type, deviation bias, deviation multiplier) and key calculated metrics (regression length, slope, Pearson’s R, percentage position within deviations, etc.) for quick reference.
█ Understanding R (Pearson Correlation Coefficient):
Pearson’s R gauges data alignment to a straight-line trend within the regression length:
Range: R varies between –1 and +1.
R = +1 → Perfect positive correlation (strong uptrend).
R = 0 → No linear relationship detected.
R = –1 → Perfect negative correlation (strong downtrend).
This script uses Pearson’s R as an anchor, adjusting regression length to target specific R traits. Strong R (±1) follows the regression channel, while weak R (0) shows inconsistency.
█ Understanding the Slope:
The slope is the direction and rate at which the regression line rises or falls per bar:
Positive Slope (>0): Uptrend – Steeper means faster increase.
Negative Slope (<0): Downtrend – Steeper means sharper drop.
Zero or Near-Zero Slope: Sideways – Indicating range-bound conditions.
This script uses highest and lowest slope as an anchor, where extremes highlight strong moves and trend lines, while values near zero indicate sideways action and possible support/resistance.
█ Setup & Configuration:
Whether you’re new to this script or want to quickly adjust all critical parameters, the panel below shows the main settings available. You can customize everything from the anchor type and maximum length to the bias, signal conditions, and more.
Scale (select Log Scale for logarithmic, otherwise linear scale).
Display (regression channel and/or bands).
Anchor (how regression length is determined).
Length (control bars analyzed):
• Max – Upper limit.
• Min – Prevents regression from becoming too short.
• Step – Controls scanning precision; increasing Step reduces load time.
Regression:
• Type – Calculation method.
• Bias – EMA-style emphasis (>0=new bars weighted more; <0=old bars weighted more).
Deviation:
• Type – Calculation method.
• Bias – EMA-style emphasis (>0=new bars weighted more; <0=old bars weighted more).
• Multiplier - Adjusts Upper and Lower Deviation.
Signal Criteria:
• % (Price vs Deviation) – (0% = lower deviation, 50% = regression, 100% = upper deviation).
• R – (0 = no correlation, ±1 = perfect correlation; >0 = +slope, <0 = -slope).
Table (analyze table of input settings, calculated results, and signal criteria).
Adaptive Lookback (display regression while too few historical bars).
Multiple Regressions (steps 2 to 7 apply to #1, #2, and #3 regressions).
█ Signal Generation & Alerts:
The script offers customizable entry and exit signals with flexible criteria and visual cues (background color, dots, or triangles). Alerts can also be triggered for these opportunities.
Percent Direction Criteria:
(0% = lower deviation, 50% = regression line, 100% = upper deviation)
Above %: Triggers if price is above a specified percent of the deviation channel.
Below %: Triggers if price is below a specified percent of the deviation channel.
(Blank): Ignores the percent‐based condition.
Pearson's R (Correlation) Direction Criteria:
(0 = no correlation, ±1 = perfect correlation; >0 = positive slope, <0 = negative slope)
Above R / Below R: Compares the correlation to a threshold.
Above│R│ / Below│R│: Uses absolute correlation to focus on strength, ignoring direction.
Zero to R: Checks if R is in the 0-to-threshold range.
(Blank): Ignores correlation-based conditions.
█ User Tips & Best Practices:
Choose an anchor type that suits your strategy, “Bar Highest/Lowest” automatically spots commonly used regression zones, while “│R│ Highest” targets strong linear trends.
Consider enabling or disabling the Adaptive Lookback feature to ensure you always have a plotted regression if your chart doesn’t meet the maximum-length requirement.
Use a small Step size (1) unless relying on R-correlation or slope-based anchors as the are time-consuming to calculate. Larger steps speed up calculations but reduce precision.
Fine-tune settings such as lookback periods, regression bias, and deviation multipliers, or trend strength. Small adjustments can significantly affect how channels and signals behave.
To reduce loading time , show only channels (not bands) and disable signals, this limits calculations to the last bar and supports more extreme criteria.
Use the table display to monitor anchor type, calculated length, slope, R value, and percent location at a glance—especially if you have multiple regressions visible simultaneously.
█ Conclusion:
With its blend of advanced regression techniques, flexible deviation options, and a wide range of anchor types, this indicator offers a highly adaptable linear regression channeling system. Whether you're anchoring to time, price extremes, correlation, slope, or external events, the tool can be shaped to fit a variety of strategies. Combined with customizable signals and alerts, it may help highlight areas of confluence and support a more structured approach to identifying potential opportunities.
