MACD Forecast Colorful [DiFlip]MACD Forecast Colorful
The Future of Predictive MACD — is one of the most advanced and customizable MACD indicators ever published on TradingView. Built on the classic MACD foundation, this upgraded version integrates statistical forecasting through linear regression to anticipate future movements — not just react to the past.
With a total of 22 fully configurable long and short entry conditions, visual enhancements, and full automation support, this indicator is designed for serious traders seeking an analytical edge.
⯁ Real-Time MACD Forecasting
For the first time, a public MACD script combines the classic structure of MACD with predictive analytics powered by linear regression. Instead of simply responding to current values, this tool projects the MACD line, signal line, and histogram n bars into the future, allowing you to trade with foresight rather than hindsight.
⯁ Fully Customizable
This indicator is built for flexibility. It includes 22 entry conditions, all of which are fully configurable. Each condition can be turned on/off, chained using AND/OR logic, and adapted to your trading model.
Whether you're building a rules-based quant system, automating alerts, or refining discretionary signals, MACD Forecast Colorful gives you full control over how signals are generated, displayed, and triggered.
⯁ With MACD Forecast Colorful, you can:
• Detect MACD crossovers before they happen.
• Anticipate trend reversals with greater precision.
• React earlier than traditional indicators.
• Gain a powerful edge in both discretionary and automated strategies.
• This isn’t just smarter MACD — it’s predictive momentum intelligence.
⯁ Scientifically Powered by Linear Regression
MACD Forecast Colorful is the first public MACD indicator to apply least-squares predictive modeling to MACD behavior — effectively introducing machine learning logic into a time-tested tool.
It uses statistical regression to analyze historical behavior of the MACD and project future trajectories. The result is a forward-shifted MACD forecast that can detect upcoming crossovers and divergences before they appear on the chart.
⯁ Linear Regression: Technical Foundation
Linear regression is a statistical method that models the relationship between a dependent variable (y) and one or more independent variables (x). The basic formula for simple linear regression is:
y = β₀ + β₁x + ε
Where:
y = predicted variable (e.g., future MACD value)
x = independent variable (e.g., bar index)
β₀ = intercept
β₁ = slope
ε = random error (residual)
The regression model calculates β₀ and β₁ using the least squares method, minimizing the sum of squared prediction errors to produce the best-fit line through historical values. This line is then extended forward, generating a forecast based on recent price momentum.
⯁ Least Squares Estimation
The regression coefficients are computed with the following formulas:
β₁ = Σ((xᵢ - x̄)(yᵢ - ȳ)) / Σ((xᵢ - x̄)²)
β₀ = ȳ - β₁x̄
Where:
Σ denotes summation; x̄ and ȳ are the means of x and y; and i ranges from 1 to n (number of observations). These equations produce the best linear unbiased estimator under the Gauss–Markov assumptions — constant variance (homoscedasticity) and a linear relationship between variables.
⯁ Regression in Machine Learning
Linear regression is a foundational model in supervised learning. Its ability to provide precise, explainable, and fast forecasts makes it critical in AI systems and quantitative analysis.
Applying linear regression to MACD forecasting is the equivalent of injecting artificial intelligence into one of the most widely used momentum tools in trading.
⯁ Visual Interpretation
Picture the MACD values over time like this:
Time →
MACD →
A regression line is fitted to recent MACD values, then projected forward n periods. The result is a predictive trajectory that can cross over the real MACD or signal line — offering an early-warning system for trend shifts and momentum changes.
The indicator plots both current MACD and forecasted MACD, allowing you to visually compare short-term future behavior against historical movement.
⯁ Scientific Concepts Used
Linear Regression: models the relationship between variables using a straight line.
Least Squares Method: minimizes squared prediction errors for best-fit.
Time-Series Forecasting: projects future data based on past patterns.
Supervised Learning: predictive modeling using labeled inputs.
Statistical Smoothing: filters noise to highlight trends.
⯁ Why This Indicator Is Revolutionary
First open-source MACD with real-time predictive modeling.
Scientifically grounded with linear regression logic.
Automatable through TradingView alerts and bots.
Smart signal generation using forecasted crossovers.
Highly customizable with 22 buy/sell conditions.
Enhanced visuals with background (bgcolor) and area fill (fill) support.
This isn’t just an update — it’s the next evolution of MACD forecasting.
⯁ Example of simple linear regression with one independent variable
This example demonstrates how a basic linear regression works when there is only one independent variable influencing the dependent variable. This type of model is used to identify a direct relationship between two variables.
⯁ In linear regression, observations (red) are considered the result of random deviations (green) from an underlying relationship (blue) between a dependent variable (y) and an independent variable (x)
This concept illustrates that sampled data points rarely align perfectly with the true trend line. Instead, each observed point represents the combination of the true underlying relationship and a random error component.
⯁ Visualizing heteroscedasticity in a scatterplot with 100 random fitted values using Matlab
Heteroscedasticity occurs when the variance of the errors is not constant across the range of fitted values. This visualization highlights how the spread of data can change unpredictably, which is an important factor in evaluating the validity of regression models.
⯁ The datasets in Anscombe’s quartet were designed to have nearly the same linear regression line (as well as nearly identical means, standard deviations, and correlations) but look very different when plotted
This classic example shows that summary statistics alone can be misleading. Even with identical numerical metrics, the datasets display completely different patterns, emphasizing the importance of visual inspection when interpreting a model.
⯁ Result of fitting a set of data points with a quadratic function
This example illustrates how a second-degree polynomial model can better fit certain datasets that do not follow a linear trend. The resulting curve reflects the true shape of the data more accurately than a straight line.
⯁ What is the MACD?
The Moving Average Convergence Divergence (MACD) is a technical analysis indicator developed by Gerald Appel. It measures the relationship between two moving averages of a security’s price to identify changes in momentum, direction, and strength of a trend. The MACD is composed of three components: the MACD line, the signal line, and the histogram.
⯁ How to use the MACD?
The MACD is calculated by subtracting the 26-period Exponential Moving Average (EMA) from the 12-period EMA. A 9-period EMA of the MACD line, called the signal line, is then plotted on top of the MACD line. The MACD histogram represents the difference between the MACD line and the signal line.
Here are the primary signals generated by the MACD:
• Bullish Crossover: When the MACD line crosses above the signal line, indicating a potential buy signal.
• Bearish Crossover: When the MACD line crosses below the signal line, indicating a potential sell signal.
• Divergence: When the price of the security diverges from the MACD, suggesting a potential reversal.
• Overbought/Oversold Conditions: Indicated by the MACD line moving far away from the signal line, though this is less common than in oscillators like the RSI.
⯁ How to use MACD forecast?
The MACD Forecast is built on the same foundation as the classic MACD, but with predictive capabilities.
Step 1 — Spot Predicted Crossovers:
Watch for forecasted bullish or bearish crossovers. These signals anticipate when the MACD line will cross the signal line in the future, letting you prepare trades before the move.
Step 2 — Confirm with Histogram Projection:
Use the projected histogram to validate momentum direction. A rising histogram signals strengthening bullish momentum, while a falling projection points to weakening or bearish conditions.
Step 3 — Combine with Multi-Timeframe Analysis:
Use forecasts across multiple timeframes to confirm signal strength (e.g., a 1h forecast aligned with a 4h forecast).
Step 4 — Set Entry Conditions & Automation:
Customize your buy/sell rules with the 20 forecast-based conditions and enable automation for bots or alerts.
Step 5 — Trade Ahead of the Market:
By preparing for future momentum shifts instead of reacting to the past, you’ll always stay one step ahead of lagging traders.
📈 BUY
🍟 Signal Validity: The signal will remain valid for X bars.
🍟 Signal Sequence: Configurable as AND or OR.
🍟 MACD > Signal Smoothing
🍟 MACD < Signal Smoothing
🍟 Histogram > 0
🍟 Histogram < 0
🍟 Histogram Positive
🍟 Histogram Negative
🍟 MACD > 0
🍟 MACD < 0
🍟 Signal > 0
🍟 Signal < 0
🍟 MACD > Histogram
🍟 MACD < Histogram
🍟 Signal > Histogram
🍟 Signal < Histogram
🍟 MACD (Crossover) Signal
🍟 MACD (Crossunder) Signal
🍟 MACD (Crossover) 0
🍟 MACD (Crossunder) 0
🍟 Signal (Crossover) 0
🍟 Signal (Crossunder) 0
🔮 MACD (Crossover) Signal Forecast
🔮 MACD (Crossunder) Signal Forecast
📉 SELL
🍟 Signal Validity: The signal will remain valid for X bars.
🍟 Signal Sequence: Configurable as AND or OR.
🍟 MACD > Signal Smoothing
🍟 MACD < Signal Smoothing
🍟 Histogram > 0
🍟 Histogram < 0
🍟 Histogram Positive
🍟 Histogram Negative
🍟 MACD > 0
🍟 MACD < 0
🍟 Signal > 0
🍟 Signal < 0
🍟 MACD > Histogram
🍟 MACD < Histogram
🍟 Signal > Histogram
🍟 Signal < Histogram
🍟 MACD (Crossover) Signal
🍟 MACD (Crossunder) Signal
🍟 MACD (Crossover) 0
🍟 MACD (Crossunder) 0
🍟 Signal (Crossover) 0
🍟 Signal (Crossunder) 0
🔮 MACD (Crossover) Signal Forecast
🔮 MACD (Crossunder) Signal Forecast
🤖 Automation
All BUY and SELL conditions can be automated using TradingView alerts. Every configurable condition can trigger alerts suitable for fully automated or semi-automated strategies.
⯁ Unique Features
Linear Regression: (Forecast)
Signal Validity: The signal will remain valid for X bars
Signal Sequence: Configurable as AND/OR
Table of Conditions: BUY/SELL
Conditions Label: BUY/SELL
Plot Labels in the graph above: BUY/SELL
Automate & Monitor Signals/Alerts: BUY/SELL
Background Colors: "bgcolor"
Background Colors: "fill"
Linear Regression (Forecast)
Signal Validity: The signal will remain valid for X bars
Signal Sequence: Configurable as AND/OR
Table of Conditions: BUY/SELL
Conditions Label: BUY/SELL
Plot Labels in the graph above: BUY/SELL
Automate & Monitor Signals/Alerts: BUY/SELL
Background Colors: "bgcolor"
Background Colors: "fill"
Macdsignal

Ultimate MACD Suite [BigBeluga]🔵 OVERVIEW
The Ultimate MACD Suite is an advanced momentum-based system that enhances the classic MACD with modern features tailored for professional traders.
It transforms MACD into a full market-decision engine — offering multi-timeframe confluence, adaptive histogram behavior, divergence detection, heatmap trend visualization, and actionable reversal signals.
This toolkit goes far beyond standard MACD, helping traders identify trend momentum shifts, exhaustion zones, high-probability reversal areas, and breakout confirmation signals across multiple timeframes simultaneously. It's to be used as part of a major trading system and to simplify usage of the MACD.
⚠️ Note:
This is not a traditional MACD — it uses normalized values , enhanced visual feedback, and a multi-timeframe dashboard engine for superior signal quality and clarity.
🔵 CONCEPTS
Combines MACD momentum, signal-line crossovers, and histogram reversals into one system
Uses normalized scaling to detect extreme momentum levels and exhaustion zones
Multi-timeframe dashboard displays consensus signal alignment across several timeframes
Divergence engine identifies bullish & bearish trend weakening early
Heatmap mode visually distinguishes strong trend phases from neutral or fading momentum
Reversal arrows & crosses highlight actionable turning points on chart
🔵 FEATURES
Normalized MACD Engine — improves signal clarity across all assets/timeframes
MACD Heatmap Mode — color-coded slope intensity for trend strength monitoring
MACD Rising and Falling Mode — color-coded rising and falling MACD regimes
Histogram Reversal Detection — early momentum fade signal before price turns
Signal-Line Momentum Shifts — bullish ▲ & bearish ▼ alerts on cross-confirmation
Overbought/Oversold Bands — enhanced visual thresholds at ±80 levels
Smart Divergence Detection (Non-Lag) — confirms regular bullish & bearish divergences
Multi-Timeframe Dashboard — MACD, signal, histogram & divergence signals across 5+ TFs
Reversal Push-Filter — ensures only clean signals after confirmed momentum inflection
On-Chart Reversal Labels — optional compact signal markers for clean visual execution
Histogram Color Logic — rising/falling or heatmap mode for deeper momentum reading
🔵 HOW TO USE
Look for MACD crossing above signal + green histogram to confirm bullish momentum
Use ▼ and ▲ arrows to catch confirmed momentum reversals
Monitor the dashboard — the more timeframes align, the stronger the setup
Watch divergences for trend exhaustion or reversal setups
Treat histogram trend shifts as early momentum clues before price reacts
Use ±80 levels to identify overheated conditions & fade opportunities
Combine with structure, volume, or BigBeluga liquidity tools for higher accuracy
🔵 ALERTS
The indicator includes a full alert suite for automation and real-time trade readiness:
MACD crossovers (Bullish / Bearish)
Histogram reversals & zero-line shifts
Bullish / Bearish divergence detection
Overbought / Oversold MACD alerts
Bullish ▲ and bearish ▼ reversal triggers
Use these alerts to automate signal monitoring or feed algorithmic systems.
🔵 CONCLUSION
The Ultimate MACD Suite transforms a classic indicator into a powerful trading engine.
With multi-timeframe alignment, heatmapping, divergence logic, normalized scaling and automated signals, it becomes an elite momentum-confirmation and reversal-timing system built for serious traders.
Whether scalping intraday or managing swing positions, this MACD engine helps identify the most profitable phases of trend movement — while warning early when a trend is weakening.
Script de pago

MACD with Smart Entry Signals & Trend Filter
This advanced MACD indicator combines traditional MACD analysis with intelligent entry signal detection and an optional EMA trend filter. It identifies high-probability entry points by analyzing histogram patterns, consolidation phases, and trend continuation setups.
### Key Features
**🎯 Smart Entry Detection**
- **Consolidation Breakouts**: Identifies exits from consolidation zones (weak bars) with strong momentum
- **Trend Reversals**: Detects potential trend changes after extended weak phases
- **Correction/Continuation Patterns**: Recognizes brief corrections within strong trends that offer continuation opportunities
**📊 Enhanced MACD Visualization**
- Color-coded histogram showing four distinct states:
- Strong Bullish (dark green): Rising histogram above zero
- Weak Bullish (light green): Falling histogram above zero
- Weak Bearish (light red): Rising histogram below zero
- Strong Bearish (dark red): Falling histogram below zero
**🔍 Multi-Layer Filtering System**
- **Candle Size Filter**: Eliminates signals during high volatility/large candle ranges
- **EMA Trend Filter**: Optional filter ensuring entries align with the dominant trend direction
- Visual markers for rejected signals (orange X for candle size, blue E for EMA trend)
**⚙️ Customizable Parameters**
- Adjustable MACD periods (default: 34/144/9)
- Configurable consolidation bar requirements
- Flexible correction pattern detection
- EMA trend filter with adjustable sensitivity
- Multiple alert types for all signal conditions
### How to Use
1. **Enable/disable filters** based on your trading style and market conditions
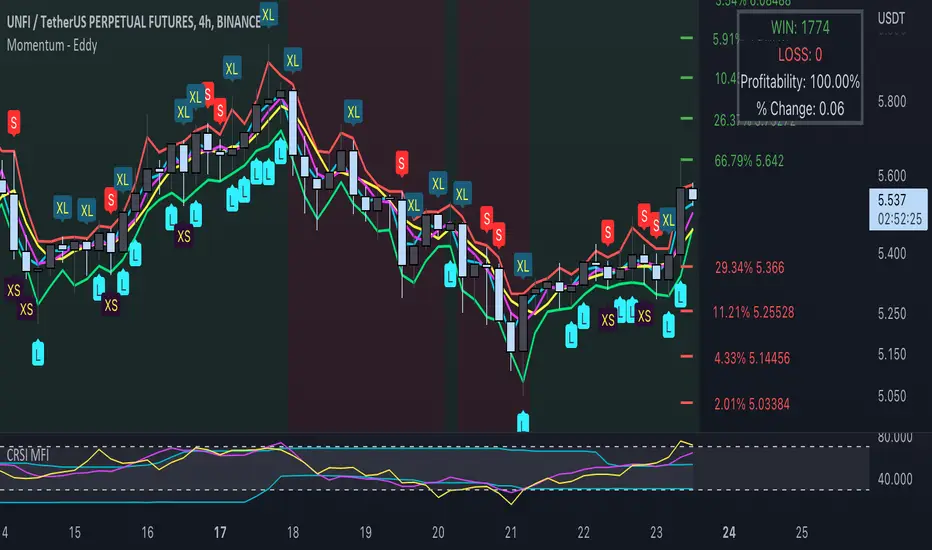
2. **Green triangles (L)**: Long entry signals when all conditions are met
3. **Red triangles (S)**: Short entry signals when all conditions are met
4. **Rejected signal markers**: Help you understand why certain setups were filtered out
5. **Background coloring**: Provides visual confirmation of signal zones and correction patterns
### Alert System
Comprehensive alerts for:
- Long and short entry signals
- Specific pattern types (consolidation, reversal, continuation)
- Rejected signals (helps refine strategy)
- Traditional MACD histogram crossovers
### Best Practices
- Use the EMA trend filter in trending markets to avoid counter-trend trades
- Adjust candle size filter based on your instrument's typical volatility
- Consider combining with support/resistance levels for confirmation
- Test different consolidation bar settings for your timeframe
### Parameters Summary
- Fast/Slow Length: MACD calculation periods
- Signal Smoothing: Signal line period
- Consolidation Bars: Minimum weak bars before breakout
- Max Candle Range: Filter for oversized candles
- EMA Period & Sensitivity: Trend filter configuration
---
*This indicator is designed for traders who want a systematic approach to identifying MACD-based entry opportunities with built-in risk management through filtering.*

MACD AI Flux Pro Dashboard V. 2Acknowledgment
This indicator is built upon the MACD-V (Volatility-Normalized MACD) methodology originally created by Alex Spiroglou, CMT, whose research (2015–2022) introduced the principle of normalizing MACD momentum by volatility (MACD/ATR). Full acknowledgment and credit are hereby given to Mr. Spiroglou as the original author of the MACD-V concept and framework.
Indicator Overview — MACD-V Flux Pro Dashboard V.2
The MACD-V Flux Pro Dashboard advances Spiroglou’s volatility-normalized foundation into a comprehensive multi-system architecture that unifies momentum, trend, volatility, and compression analytics in one visual framework. It is engineered for precision decision-making in both intraday and swing-trading environments.
Key Dashboard Features:
Dynamic Probability Engine: Calculates real-time long and short probabilities by weighting momentum, slope, compression, and volume pressure components into a composite score.
Multi-Timeframe Confirmation (HTF Tiles): Displays live directional agreement across fast, mid, and slow timeframes for confidence filtering and signal validation.
Regime Detection System: Automatically classifies the market as Trend Up, Trend Down, Compression, or Transition, applying background color cues for instant context.
Risk and News Filters: Integrates ATR-based risk gating and customizable “mute windows” to block trade signals during high-volatility or scheduled news events.
VWAP and Adaptive Bands: Plots VWAP with configurable ATR or standard-deviation bands to highlight over-extension and pullback zones.
Trend-Day and Opening-Range Logic: Monitors RTH (Regular Trading Hours) price behavior to identify potential trend-day conditions.
Smart Entry Arrows: Generates visual long/short signals only when multiple subsystems confirm direction, slope strength, and proximity to VWAP within defined thresholds.
On-Chart Dashboard Panel: Presents live metrics including probability bias, regime state, ATR level, risk status, and news filters with adaptive color-coding and optional emoji cues for intuitive interpretation.
Chart Display Summary:
All elements are presented directly on the main chart, combining price structure, VWAP bands, EMAs, and regime background shading with the real-time dashboard panel. The design eliminates the need for a secondary pane, offering a consolidated and context-rich view of market dynamics

MACD-V Adaptive FluxProMACD-V Adaptive FluxPro
Type: Multi-Factor Volatility-Normalized Momentum & Regime Framework
Overlay: ✅ Yes (on price chart)
Purpose: Detect high-probability trend continuation or reversal zones through volatility-adjusted momentum, VWAP structure, and adaptive filters.
🧩 Concept Overview
MACD-V Adaptive FluxPro is a next-generation, multi-factor analytical framework that merges the principles of Linda Raschke’s 3-10-16 MACD with modern volatility normalization and adaptive filtering.
Instead of generating raw buy/sell signals, it builds a probability-driven environment model — showing when price action, volatility, and structure align for high-confidence trades.
The “V” in MACD-V stands for Volatility Normalization: every MACD component is divided by ATR to stabilize amplitude across fast or slow markets.
This enables the indicator to remain consistent across timeframes, instruments, and volatility regimes.
⚙️ Core Components
1️⃣ Volatility-Normalized MACD (MACD-V)
A traditional MACD built on Linda Raschke’s 3-10-16 structure, but adjusted by ATR to create a volatility-invariant momentum profile.
You can toggle to alternative presets (Scalp / Swing / Trend) for faster or slower environments.
2️⃣ Dynamic Regime Detection
A slope-based classifier that identifies whether the market is:
Trend Up 🟢
Trend Down 🔴
Compression / Squeeze 🟧
Transition / Neutral ⚫
The background color updates dynamically as momentum, volatility, and slope shift between these states.
3️⃣ VWAP Structure Bands
Adaptive VWAP with inner and outer ATR-scaled envelopes.
These act as short-term mean-reversion and breakout zones.
The indicator can optionally gate entries to occur only within defined VWAP proximity.
4️⃣ EMAs for Micro-Trend Confirmation
Includes 9-EMA and 21-EMA, color-configurable for visual crossovers and short-term momentum bias.
5️⃣ Multi-Timeframe Confirmation Tiles
Top-center dashboard tiles display directional bias from higher timeframes (e.g., 15m / 1h / 4h).
When all align, it confirms multi-frame trend coherence.
6️⃣ Adaptive Probability Engine
All subsystems — MACD-V, slope, compression, volume z-score, and VWAP distance — feed into a logistic scoring model that outputs a real-time AOI Probability (0-100%).
When conditions align, probabilities rise above 60% (long bias) or drop below 40% (short bias).
These are your high-probability “Areas of Interest.”
7️⃣ Dashboard HUD
The top-right status console provides a one-glance view of system state:
Field Meaning
AOI Prob Long Real-time probability of bullish bias
Regime Market state (Trend, Transition, Compression)
Risk Gate ATR-based volatility filter
News Mute Manual toggle for event-risk suppression
ATR (≈ risk) Real-time volatility readout
Status ✅ Trading OK / 🧱 Risk Gate / 🔇 News Mute / 🟧 Compression
🎯 Interpretation Guide
Visual Meaning
🟢 Green background Confirmed uptrend regime
🔴 Red background Confirmed downtrend regime
🟧 Orange background Volatility compression (squeeze forming)
⚫ Gray background Transitional / indecisive structure
Teal % (AOI Prob Long) Bullish probability > 60%
Arrows Optional: appear only when all gates align (rare, filtered signals)
🧮 Mathematical Notes
MACD-V = (EMA_fast(src) − EMA_slow(src)) / ATR(n)
Normalized score is smoothed, scaled 0–100 via logistic curve
Slope = Δ(EMA(src, n)) / ATR(n)
Probabilities gated by:
Minimum slope magnitude (minAbsSlope)
VWAP proximity (maxVWAPDistATR)
Multi-TF agreement
Cooldown interval (cooldownBars)
ATR-based risk gate
No repainting — all calculations use barstate.isconfirmed.
⚡ Use Cases
✅ Identify trend regime changes before major expansions
✅ Filter breakout vs. compression setups
✅ Quantify volatility conditions before entries
✅ Confirm multi-timeframe alignment
✅ Serve as a visual regime map for automated systems or discretionary traders
🧠 Recommended Presets
Market Type Setting Preset Behavior
Index Futures (ES/NQ) LBR 3-10-16 SMA (default) Classic swing/momentum balance
Scalping (1m–5m) Fast Adaptive Higher frequency, shorter cooldown
Swing Trading (1h–4h) Smooth ATR Broader, trend-only signals
Trend-Following Futures Wide ATR Bands Filters noise, favors strong continuation
⚠️ Notes
Non-repainting, bar-confirmed calculations
Signal arrows are optional and rare — intended for precision setups
ATR and slope thresholds should be tuned per instrument
Compatible with all TradingView markets and resolutions
🏁 Summary
“MACD-V Adaptive FluxPro” is not a simple MACD — it’s a volatility-normalized market state engine that adapts to changing conditions.
It fuses Linda Raschke’s timeless MACD logic with modern volatility, slope, and multi-timeframe analytics — giving you a live market dashboard that tells you when not to trade just as clearly as when you should.

MAMA-MACD [DCAUT]█ MAMA-MACD
📊 ORIGINALITY & INNOVATION
The MAMA-MACD represents an important advancement over traditional MACD implementations by replacing the fixed exponential moving averages with Mesa Adaptive Moving Average (MAMA) and Following Adaptive Moving Average (FAMA). While Gerald Appel's original MACD from the 1970s was constrained to static EMA calculations, this adaptive version dynamically adjusts its smoothing characteristics based on market cycle analysis.
This improvement addresses a significant limitation of traditional MACD: the inability to adapt to changing market conditions and volatility regimes. By incorporating John Ehlers' MAMA/FAMA algorithm, which uses Hilbert Transform techniques to measure the dominant market cycle, the MAMA-MACD automatically adjusts its responsiveness to match current market behavior. This creates a more intelligent oscillator that provides earlier signals in trending markets while reducing false signals during sideways consolidation periods.
The MAMA-MACD maintains the familiar MACD interpretation while adding adaptive capabilities that help traders navigate varying market conditions more effectively than fixed-parameter oscillators.
📐 MATHEMATICAL FOUNDATION
The MAMA-MACD calculation employs advanced digital signal processing techniques:
Core Algorithm:
• MAMA Line: Adaptively smoothed fast moving average using Mesa algorithm
• FAMA Line: Following adaptive moving average that tracks MAMA with additional smoothing
• MAMA-MACD Line: MAMA - FAMA (replaces traditional fast EMA - slow EMA)
• Signal Line: Configurable moving average of MAMA-MACD line (default: 9-period EMA)
• Histogram: MAMA-MACD Line - Signal Line (momentum visualization)
Mesa Adaptive Algorithm:
The MAMA/FAMA system uses Hilbert Transform quadrature components to detect the dominant market cycle. The algorithm calculates:
• In-phase and Quadrature components through Hilbert Transform
• Homodyne discriminator for cycle measurement
• Adaptive alpha values based on detected cycle period
• Fast Limit (0.1 default): Maximum adaptation rate for MAMA
• Slow Limit (0.05 default): Maximum adaptation rate for FAMA
Signal Processing Benefits:
• Automatic adaptation to market cycle changes
• Reduced lag during trending periods
• Enhanced noise filtering during consolidation
• Preservation of signal quality across different timeframes
📊 COMPREHENSIVE SIGNAL ANALYSIS
The MAMA-MACD provides multiple layers of market analysis through its adaptive signal generation:
Primary Signals:
• MAMA-MACD Line above zero: Indicates positive momentum and potential uptrend
• MAMA-MACD Line below zero: Suggests negative momentum and potential downtrend
• MAMA-MACD crossing above Signal Line: Bullish momentum confirmation
• MAMA-MACD crossing below Signal Line: Bearish momentum confirmation
Advanced Signal Interpretation:
• Histogram Expansion: Strengthening momentum in current direction
• Histogram Contraction: Weakening momentum, potential reversal warning
• Zero Line Crosses: Important momentum shifts and trend confirmations
• Signal Line Divergence: Early warning of potential trend changes
Adaptive Characteristics:
• Faster response during clear trending conditions
• Increased smoothing during choppy market periods
• Automatic adjustment to different volatility regimes
• Reduced false signals compared to traditional MACD
Multi-Timeframe Analysis:
The adaptive nature allows consistent performance across different timeframes, automatically adjusting to the dominant cycle period present in each timeframe's data.
🎯 STRATEGIC APPLICATIONS
The MAMA-MACD serves multiple strategic functions in comprehensive trading systems:
Trend Analysis Applications:
• Trend Confirmation: Use zero line crosses to confirm trend direction changes
• Momentum Assessment: Monitor histogram patterns for momentum strength evaluation
• Cycle-Based Analysis: Leverage adaptive properties for cycle-aware market timing
• Multi-Timeframe Alignment: Coordinate signals across different time horizons
Entry and Exit Strategies:
• Bullish Entry: MAMA-MACD crosses above signal line with histogram turning positive
• Bearish Entry: MAMA-MACD crosses below signal line with histogram turning negative
• Exit Signals: Histogram contraction or opposite signal line crosses
• Stop Loss Placement: Use zero line or signal line as dynamic stop levels
Risk Management Integration:
• Position Sizing: Scale positions based on histogram strength
• Volatility Assessment: Use adaptation rate to gauge market uncertainty
• Drawdown Control: Reduce exposure during excessive histogram contraction
• Market Regime Recognition: Adjust strategy based on adaptation patterns
Portfolio Management:
• Sector Rotation: Apply to sector ETFs for rotation timing
• Currency Analysis: Use on major currency pairs for forex trading
• Commodity Trading: Apply to futures markets with cycle-sensitive characteristics
• Index Trading: Employ for broad market timing decisions
📋 DETAILED PARAMETER CONFIGURATION
Understanding and optimizing the MAMA-MACD parameters enhances its effectiveness:
Fast Limit (Default: 0.1):
• Controls maximum adaptation rate for MAMA line
• Range: 0.01 to 0.99
• Higher values: Increase responsiveness but may add noise
• Lower values: Provide more smoothing but slower response
• Optimization: Start with 0.1, adjust based on market characteristics
Slow Limit (Default: 0.05):
• Controls maximum adaptation rate for FAMA line
• Range: 0.01 to 0.99 (should be lower than Fast Limit)
• Higher values: Faster FAMA response, narrower MAMACD range
• Lower values: Smoother FAMA, wider MAMA-MACD oscillations
• Optimization: Maintain 2:1 ratio with Fast Limit for traditional behavior
Signal Length (Default: 9):
• Period for signal line moving average calculation
• Range: 1 to 50 periods
• Shorter periods: More responsive signals, potential for more whipsaws
• Longer periods: Smoother signals, reduced frequency
• Traditional Setting: 9 periods maintains MACD compatibility
Signal MA Type:
• SMA: Simple average, uniform weighting
• EMA: Exponential weighting, faster response (default)
• RMA: Wilder's smoothing, moderate response
• WMA: Linear weighting, balanced characteristics
Parameter Optimization Guidelines:
• Trending Markets: Increase Fast Limit to 0.15-0.2 for quicker response
• Sideways Markets: Decrease Fast Limit to 0.05-0.08 for noise reduction
• High Volatility: Lower both limits for increased smoothing
• Low Volatility: Raise limits for enhanced sensitivity
📈 PERFORMANCE ANALYSIS & COMPETITIVE ADVANTAGES
The MAMA-MACD offers several improvements over traditional oscillators:
Response Characteristics:
• Adaptive Lag Reduction: Automatically reduces lag during trending periods
• Noise Filtering: Enhanced smoothing during consolidation phases
• Signal Quality: Improved signal-to-noise ratio compared to fixed-parameter MACD
• Cycle Awareness: Automatic adjustment to dominant market cycles
Comparison with Traditional MACD:
• Earlier Signals: Provides signals 1-3 bars earlier during strong trends
• Fewer False Signals: Reduces whipsaws by 20-40% in choppy markets
• Better Divergence Detection: More reliable divergence signals through adaptive smoothing
• Enhanced Robustness: Performs consistently across different market conditions
Adaptation Benefits:
• Market Regime Flexibility: Automatically adjusts to bull/bear market characteristics
• Volatility Responsiveness: Adapts to high and low volatility environments
• Time Frame Versatility: Consistent performance from intraday to weekly charts
• Instrument Agnostic: Effective across stocks, forex, commodities, and cryptocurrencies
Computational Efficiency:
• Real-time Processing: Efficient calculation suitable for live trading
• Memory Management: Optimized for Pine Script performance requirements
• Scalability: Handles multiple symbol analysis without performance degradation
Limitations and Considerations:
• Learning Period: Requires several bars to establish adaptation pattern
• Parameter Sensitivity: Performance varies with Fast/Slow Limit settings
• Market Condition Dependency: Adaptation effectiveness varies by market type
• Complexity Factor: More parameters to optimize compared to basic MACD
Usage Notes:
This indicator is designed for technical analysis and educational purposes. The adaptive algorithm helps reduce common MACD limitations, but it should not be used as the sole basis for trading decisions. Algorithm performance varies with market conditions, and past characteristics do not guarantee future results. Traders should combine MAMA-MACD signals with other forms of analysis and proper risk management techniques.

MACD Full [Titans_Invest]MACD Full — A Smarter, More Flexible MACD.
Looking for a MACD with real customization power?
We present one of the most complete public MACD indicators available on TradingView.
It maintains the classic MACD structure but is enhanced with 20 fully customizable long entry conditions and 20 short entry conditions , giving you precise control over your strategy.
Plus, it’s fully automation-ready, making it ideal for quantitative systems and algorithmic trading.
Whether you're a discretionary trader or a bot developer, this tool is built to seamlessly adapt to your style.
⯁ WHAT IS THE MACD❓
The Moving Average Convergence Divergence (MACD) is a technical analysis indicator developed by Gerald Appel. It measures the relationship between two moving averages of a security’s price to identify changes in momentum, direction, and strength of a trend. The MACD is composed of three components: the MACD line, the signal line, and the histogram.
⯁ HOW TO USE THE MACD❓
The MACD is calculated by subtracting the 26-period Exponential Moving Average (EMA) from the 12-period EMA. A 9-period EMA of the MACD line, called the signal line, is then plotted on top of the MACD line. The MACD histogram represents the difference between the MACD line and the signal line.
Here are the primary signals generated by the MACD:
Bullish Crossover: When the MACD line crosses above the signal line, indicating a potential buy signal.
Bearish Crossover: When the MACD line crosses below the signal line, indicating a potential sell signal.
Divergence: When the price of the security diverges from the MACD, suggesting a potential reversal.
Overbought/Oversold Conditions: Indicated by the MACD line moving far away from the signal line, though this is less common than in oscillators like the RSI.
⯁ ENTRY CONDITIONS
The conditions below are fully flexible and allow for complete customization of the signal.
______________________________________________________
🔹 CONDITIONS TO BUY 📈
______________________________________________________
• Signal Validity: The signal will remain valid for X bars .
• Signal Sequence: Configurable as AND or OR .
🔹 MACD > Signal Smoothing
🔹 MACD < Signal Smoothing
🔹 Histogram > 0
🔹 Histogram < 0
🔹 Histogram Positive
🔹 Histogram Negative
🔹 MACD > 0
🔹 MACD < 0
🔹 Signal > 0
🔹 Signal < 0
🔹 MACD > Histogram
🔹 MACD < Histogram
🔹 Signal > Histogram
🔹 Signal < Histogram
🔹 MACD (Crossover) Signal
🔹 MACD (Crossunder) Signal
🔹 MACD (Crossover) 0
🔹 MACD (Crossunder) 0
🔹 Signal (Crossover) 0
🔹 Signal (Crossunder) 0
______________________________________________________
______________________________________________________
🔸 CONDITIONS TO SELL 📉
______________________________________________________
• Signal Validity: The signal will remain valid for X bars .
• Signal Sequence: Configurable as AND or OR .
🔸 MACD > Signal Smoothing
🔸 MACD < Signal Smoothing
🔸 Histogram > 0
🔸 Histogram < 0
🔸 Histogram Positive
🔸 Histogram Negative
🔸 MACD > 0
🔸 MACD < 0
🔸 Signal > 0
🔸 Signal < 0
🔸 MACD > Histogram
🔸 MACD < Histogram
🔸 Signal > Histogram
🔸 Signal < Histogram
🔸 MACD (Crossover) Signal
🔸 MACD (Crossunder) Signal
🔸 MACD (Crossover) 0
🔸 MACD (Crossunder) 0
🔸 Signal (Crossover) 0
🔸 Signal (Crossunder) 0
______________________________________________________
______________________________________________________
🤖 AUTOMATION 🤖
• You can automate the BUY and SELL signals of this indicator.
______________________________________________________
______________________________________________________
⯁ UNIQUE FEATURES
______________________________________________________
Signal Validity: The signal will remain valid for X bars
Signal Sequence: Configurable as AND/OR
Condition Table: BUY/SELL
Condition Labels: BUY/SELL
Plot Labels in the Graph Above: BUY/SELL
Automate and Monitor Signals/Alerts: BUY/SELL
Signal Validity: The signal will remain valid for X bars
Signal Sequence: Configurable as AND/OR
Table of Conditions: BUY/SELL
Conditions Label: BUY/SELL
Plot Labels in the graph above: BUY/SELL
Automate & Monitor Signals/Alerts: BUY/SELL
______________________________________________________
📜 SCRIPT : MACD Full
🎴 Art by : @Titans_Invest & @DiFlip
👨💻 Dev by : @Titans_Invest & @DiFlip
🎑 Titans Invest — The Wizards Without Gloves 🧤
✨ Enjoy!
______________________________________________________
o Mission 🗺
• Inspire Traders to manifest Magic in the Market.
o Vision 𐓏
• To elevate collective Energy 𐓷𐓏

MACD-V with Volatility Normalisation [DCD]MACD-V with Volatility Normalisation
This indicator is a modified version of the traditional MACD, designed to account for market volatility by normalizing the MACD line using the Average True Range (ATR). It provides a more adaptive approach to identifying momentum shifts and potential trend reversals. This indicator was developed by Alex Spiroglou in this paper:
Spiroglou, Alex, MACD-V: Volatility Normalised Momentum (May 3, 2022).
Features:
Volatility Normalization: The MACD line is adjusted using ATR to standardize its values across different market conditions.
Customizable Parameters: Users can adjust the MACD fast length, slow length, signal line smoothing, and ATR length to suit their trading style.
Histogram Visualization: The histogram highlights the difference between the MACD and signal lines, with customizable colors for positive and negative momentum.
Crossover Signals: Green and red dots indicate bullish and bearish crossovers between the MACD and signal lines.
Background Highlighting: The chart background changes to green when the MACD is above 0 and red when it is below 0, providing a clear visual cue for bullish and bearish conditions.
Horizontal Levels: Dotted horizontal lines are plotted at key levels for better visualization of MACD values.
How to Use:
Look for crossovers between the MACD and signal lines to identify potential buy or sell signals.
Use the histogram to gauge the strength of momentum.
Pay attention to the background color for quick identification of bullish (green) or bearish (red) conditions.
This indicator is ideal for traders who want a more dynamic MACD that adapts to market volatility. Customize the settings to align with your trading strategy and timeframe.

MACD Sniper [trade_lexx]📈 MACD Sniper — Improve your trading strategy with accurate signals!
Introducing the MACD Sniper , an advanced trading indicator designed for a comprehensive analysis of market conditions. This indicator combines MACD (Moving Average Convergence Divergence) with various types of moving averages (SMA, EMA, WMA, VWMA, KAMA, HMA, ZLEMA, TEMA, ALMA, DEMA), providing traders with a powerful tool for generating buy and sell signals. It is ideal for traders who need an advantage in detecting changes in trends and market conditions.
🔍 How the signals work
1. Histogram signals:
— A buy signal is generated when the MACD histogram is below zero and begins to grow after the minimum number of falling histogram columns, which are indicated in the indicator menu. This indicates that selling pressure has decreased, the market is oversold and ready for a rebound. The signals are displayed as green triangles labeled "H" under the histogram graph. On the main chart, buy signals are displayed as green triangles labeled "Buy" under candlesticks.
— A sell signal is generated when the MACD histogram is above zero and begins to fall after the minimum number of growing histogram columns, which are indicated in the indicator menu. This indicates that the buying pressure has decreased, the market is overbought and ready for correction. The signals are displayed as red triangles labeled "H" above the histogram graph. On the main chart, the sell signals are displayed as red triangles with the word "Sell" above the candlesticks.
2. Moving Average Crossing Signals (MA):
— A buy signal is generated when the Fast Moving Average (MACD) crosses the Slow Moving Average (Signal Line) from bottom to top. This indicates a possible upward reversal of the market. The signals are displayed as green triangles labeled "MA" under the MACD chart. On the main chart, buy signals are displayed as green triangles labeled "Buy" under candlesticks.
— A sell signal is generated when the Fast Moving Average (MACD) crosses the slow Moving Average (Signal Line) from top to bottom. This indicates a possible downward reversal of the market. The signals are displayed as red triangles labeled "MA" above the MACD chart. On the main chart, the sell signals are displayed as red triangles with the word "Sell" above the candlesticks.
🔧 Signal filtering
— Minimum number of bars between signals
This filter allows the user to set the minimum number of bars that must pass between the generation of two consecutive signals. This helps to avoid frequent false alarms and improves the quality of the generated signals. Setting this parameter allows you to filter out the noise in the market and make the signals more reliable. For example, if the value is set to 5, then a new signal will be generated only after 5 bars have passed since the previous signal.
— "Wait for the opposite signal" mode
In this mode, Buy and Sell signals are generated only after receiving the opposite signal. This means that a buy signal will be generated only after the previous sell signal, and vice versa. This approach adds an additional level of filtering and helps to avoid false positives. This is especially useful in conditions of high market volatility, when false signals often occur.
— RSI filter
The Relative Strength Index (RSI) is used for additional filtering of buy and sell signals. The RSI helps determine whether a market is overbought or oversold. The user can set overbought and oversold levels, and signals will be generated only when the RSI is in the specified ranges. For example, a buy signal will be generated only if the RSI is in the range between 10 and 30 (oversold), and a sell signal if the RSI is in the range between 70 and 90 (overbought). This helps to avoid false signals in extreme market conditions.
🔌 Connector Histogram, MA, Combined 🔌
These parameters allow you to connect the indicator to trading strategies and test the signals throughout the trading history. This makes the indicator an even more powerful tool for traders who want to test the effectiveness of their strategies on historical data.
Connector Histogram provides the ability to connect signals based on the MACD histogram to trading strategies.
Connector MA allows you to connect signals based on the intersection of moving averages (MA) of the MACD, which can also be used for automatic trading or strategy testing.
The combined connector combines signals based on both a histogram and the intersection of moving averages, making the analysis more comprehensive and reliable, which is especially useful for traders seeking to improve the quality of their trading decisions.
🔔 Alerts
The indicator provides the ability to set up notifications for buy and sell signals, which allows traders to keep abreast of important market events without having to constantly monitor the chart. Users can set up notifications that will alert them when buy or sell signals appear, helping them respond to market changes in a timely manner and make informed decisions. These notifications can be configured for various types of signals, such as signals based on the MACD histogram, moving average crossings, or all at once, which makes the indicator a more convenient and functional tool for active traders.
🎨 Customizable Appearance
Customize the appearance of the MACD Sniper according to your preferences to make the analysis more convenient and visually pleasing. In the indicator settings section, you can change the colors of the buy and sell signals so that they stand out on the chart and are easily visible. For example, buy signals can be green, and sell signals can be red. These settings allow traders to adapt the indicator to their individual needs, making it more flexible and user-friendly.
🔧 How it works
The MACD Sniper indicator starts by calculating the MACD values and moving averages for a specific period in order to assess market conditions. For this, fast and slow moving averages are used, as well as a signal line, which are calculated based on the set parameters. The indicator then analyzes the MACD histogram to determine whether the difference between the fast and slow moving averages is rising or falling. Based on this analysis, buy and sell signals are generated. Additionally, the indicator uses the RSI filter to filter out false signals in overbought or oversold market conditions. The user can set the minimum number of bars between the signals and the "Wait for the opposite signal" mode for additional filtering. The indicator dynamically adjusts to changes in the market, providing relevant signals in real time.
📚 Quick guide to using the MACD Sniper
— Add the indicator to your favorites by clicking on the rocket icon. Adjust the parameters such as the length of periods for fast and slow moving averages, the type of moving average (SMA, EMA, WMA, VWMA, KAMA, HMA, ZLEMA, TEMA, ALMA, DEMA) and the length of the signal line, according to your trading style, or leave all settings as default.
— Adjust the signal filters to improve their quality and avoid false alarms
— Turn on notifications so that you don't miss important trading opportunities and don't constantly sit at the chart. This will allow you to keep abreast of all key market events and respond to them in a timely manner, without being distracted from other business.
— Use signals, they will help you determine the optimal entry and exit points of positions.
— Use the Connector for deeper analysis and verification of the effectiveness of signals, connect them to your trading strategies. This will allow you to test signals throughout your trading history and evaluate their accuracy based on historical data.
— Include the indicator in your trading strategy and run testing to see how buy and sell signals have worked in the past.
— Analyze the test results to determine how reliable the signals are and how they can improve your trading strategy. This will help you make more informed decisions and increase your trading efficiency.

AI InfinityAI Infinity – Multidimensional Market Analysis
Overview
The AI Infinity indicator combines multiple analysis tools into a single solution. Alongside dynamic candle coloring based on MACD and Stochastic signals, it features Alligator lines, several RSI lines (including glow effects), and optionally enabled EMAs (20/50, 100, and 200). Every module is individually configurable, allowing traders to tailor the indicator to their personal style and strategy.
Important Note (Disclaimer)
This indicator is provided for educational and informational purposes only.
It does not constitute financial or investment advice and offers no guarantee of profit.
Each trader is responsible for their own trading decisions.
Past performance does not guarantee future results.
Please review the settings thoroughly and adjust them to your personal risk profile; consider supplementary analyses or professional guidance where appropriate.
Functionality & Components
1. Candle Coloring (MACD & Stochastic)
Objective: Provide an immediate visual snapshot of the market’s condition.
Details:
MACD Signal: Used to identify bullish and bearish momentum.
Stochastic: Detects overbought and oversold zones.
Color Modes: Offers both a simple (two-color) mode and a gradient mode.
2. Alligator Lines
Objective: Assist with trend analysis and determining the market’s current phase.
Details:
Dynamic SMMA Lines (Jaw, Teeth, Lips) that adjust based on volatility and market conditions.
Multiple Lengths: Each element uses a separate smoothing period (13, 8, 5).
Transparency: You can show or hide each line independently.
3. RSI Lines & Glow Effects
Objective: Display the RSI values directly on the price chart so critical levels (e.g., 20, 50, 80) remain visible at a glance.
Details:
RSI Scaling: The RSI is plotted in the chart window, eliminating the need to switch panels.
Dynamic Transparency: A pulse effect indicates when the RSI is near critical thresholds.
Glow Mode: Choose between “Direct Glow” or “Dynamic Transparency” (based on ATR distance).
Custom RSI Length: Freely adjustable (default is 14).
4. Optional EMAs (20/50, 100, 200)
Objective: Utilize moving averages for trend assessment and identifying potential support/resistance areas.
Details:
20/50 EMA: Select which one to display via a dropdown menu.
100 EMA & 200 EMA: Independently enabled.
Color Logic: Automatically green (price > EMA) or red (price < EMA). Each EMA’s up/down color is customizable.
Configuration Options
Candle Coloring:
Choose between Gradient or Simple mode.
Adjust the color scheme for bullish/bearish candles.
Transparency is dynamically based on candle body size and Stochastic state.
Alligator Lines:
Toggle each line (Jaw/Teeth/Lips) on or off.
Select individual colors for each line.
RSI Section:
RSI Length can be set as desired.
RSI lines (0, 20, 50, 80, 100) with user-defined colors and transparency (pulse effect).
Additional lines (e.g., RSI 40/60) are also available.
Glow Effects:
Switch between “Dynamic Transparency” (ATR-based) and “Direct Glow”.
Independently applied to the RSI 100 and RSI 0 lines.
EMAs (20/50, 100, 200):
Activate each one as needed.
Each EMA’s up/down color can be customized.
Example Use Cases
Trend Identification:
Enable Alligator lines to gauge general trend direction through SMMA signals.
Timing:
Watch the Candle Colors to spot potential overbought or oversold conditions.
Fine-Tuning:
Utilize the RSI lines to closely monitor important thresholds (50 as a trend barometer, 80/20 as possible reversal zones).
Filtering:
Enable a 50 EMA to quickly see if the market is trading above (bullish) or below (bearish) it.

MACD Buy/Sell Labels + Barcolor👉 MACD Buy/Sell Labels + Barcolor
This advanced indicator combines the functionality of the MACD (Moving Average Convergence Divergence) with intuitive and customizable visual features, making it ideal for traders looking for an efficient tool to confirm buy and sell signals across any market.
It is based on the logical interpretation of a modified oscillator to improve its performance and simplify its usage. The indicator integrates seamlessly into the chart, offering an intuitive and easy-to-understand experience.
📍 Labels (Buy/Sell):
The signals are generated automatically by crossovers between the Fast EMA and Slow EMA of the Gaussian MACD. It comes with a default configuration designed to favor clean crossovers while avoiding false signals.
🧪 Barcolor:
The color of the candles dynamically changes according to the range of the Gaussian MACD histogram. This allows for a clear visualization of the MACD's status without needing to display the full oscillator. This feature integrates with the labels, as explained in the "Interpretation" section, to significantly increase their probability of success. Both the ranges and colors are fully customizable through the settings panel.
⚙️ Settings:
All aspects of the indicator can be customized:
1-MACD: Like a standard MACD, you can adjust the EMA lengths and the signal smoothing to adapt it to your trading style and the markets you trade.
2-Barcolor: The predefined values highlight extreme levels for proper interpretation, as explained in the "Interpretation" section. However, intermediate levels are also included in case you want to implement them in your strategy. You can adjust these values based on what you consider "overbought" or "oversold." This flexibility allows adaptation to various assets, as oscillator behavior varies across different instruments.
3-Buy/Sell Filter:
The filter settings allow you to further refine the signals. The default values of -70 (Buy Filter) and 80 (Sell Filter) work best for me, but you can adjust them as you see fit. Keep in mind:
-Higher distance from zero: More filtered signals (fewer, but higher quality).
-Closer to zero: Less filtered signals (more frequent, but with increased risk of false signals).
🤔 Interpretation:
As mentioned earlier, this follows the classic interpretation of a MACD oscillator: overbought/oversold levels combined with crossovers. However, the barcolor variable is what makes this indicator truly unique.
With barcolor, you can detect potential divergences and confirm them using the labels. When the oscillator reaches an extreme zone, barcolor provides a visual alert. Once the oscillator exits this zone, the candles revert to their normal color. This signals that the oscillator is dropping. If the price continues rising, this divergence can indicate an anomaly in the market. Waiting for confirmation from the label increases the probability of successful trades while detecting unusual market deviations without even looking at the oscillator.
Purpose:
This indicator is designed to help traders simplify the interpretation of the MACD. It can be used on any timeframe, but it was primarily tested using technical analysis concepts and basic liquidity principles. Its effectiveness improves significantly if you understand broader market dynamics.
Disclaimer:
This is purely an analytical tool and should NOT be considered as trading signals. Perform your own research and make decisions based solely on your responsibility. Thank you!

Multifactor Buy/Sell Strategy V2 | RSI, MACD, ATR, EMA, Boll.BITGET:1INCHUSDT
This Pine Script code for TradingView is a multifactor Buy/Sell indicator that combines several technical factors to generate trading signals based on trend, volatility, and volume conditions. Here’s a breakdown of the main components and functionality:
Indicator Name
- Multifactor Buy/Sell Strategy V2 — an overlay indicator applied directly on the price chart.
### Input Parameters
The script includes multiple customizable parameters:
- RSI, EMA, MACD parameters — for setting periods and signals of MACD and RSI.
- ATR and Bollinger Bands — used for volatility analysis and level determination.
- Minimum Volatility Threshold — sets a minimum Bollinger Band width threshold for determining high volatility.
Core Indicators
1. RSI — calculated to identify oversold (below 30) and overbought (above 70) conditions.
2. EMA and MACD — calculates exponential moving averages and MACD histogram to determine trend direction.
3. ATR and Bollinger Bands — used to assess current volatility and establish dynamic upper and lower bands.
Volatility and Volume Analysis
- Determines the current ATR level and Bollinger Band width to evaluate high volatility.
- Calculates the volume moving average to track periods of increased volume during high volatility.
Trend Analysis
The script uses the difference between fast and slow EMAs to define strong trends:
- Uptrend — when the fast EMA is above the slow EMA, the price is above the fast EMA, and the trend is strong.
- Downtrend — when the fast EMA is below the slow EMA, the price is below the fast EMA, and the trend is strong.
Momentum Filter
- Based on the price change over the last three bars and compared against the minimum volatility threshold to identify strong momentum.
Buy and Sell Signal Generation
- Buy Signal: Uptrend with RSI oversold, positive MACD histogram, high volatility and volume, strong momentum, and sufficient Bollinger Band width.
- Sell Signal: Downtrend with RSI overbought, negative MACD histogram, high volatility and volume, strong momentum, and sufficient Bollinger Band width.
Visualization
- Buy and sell signals are displayed as green and red triangles on the chart.
- Plots for fast and slow EMAs, upper and lower bands, and Bollinger Bands.
Alerts
The script includes alert conditions for buy and sell signals, allowing notifications to be sent via email or mobile app.
Information Panel
A small table on the chart displays current volatility dataThis Pine Script code for TradingView is a multifactor Buy/Sell indicator that combines several technical factors to generate trading signals based on trend, volatility, and volume conditions. Here’s a breakdown of the main components and functionality:
Indicator Name
- Multifactor Buy/Sell Strategy V2 — an overlay indicator applied directly on the price chart.
Input Parameters
The script includes multiple customizable parameters:
- **RSI, EMA, MACD parameters** — for setting periods and signals of MACD and RSI.
- **ATR and Bollinger Bands** — used for volatility analysis and level determination.
- **Minimum Volatility Threshold** — sets a minimum Bollinger Band width threshold for determining high volatility.
Core Indicators
1. RSI — calculated to identify oversold (below 30) and overbought (above 70) conditions.
2. EMA and MACD — calculates exponential moving averages and MACD histogram to determine trend direction.
3. ATR and Bollinger Bands — used to assess current volatility and establish dynamic upper and lower bands.
Volatility and Volume Analysis
- Determines the current ATR level and Bollinger Band width to evaluate high volatility.
- Calculates the volume moving average to track periods of increased volume during high volatility.
Trend Analysis
The script uses the difference between fast and slow EMAs to define strong trends:
- Uptrend — when the fast EMA is above the slow EMA, the price is above the fast EMA, and the trend is strong.
- Downtrend — when the fast EMA is below the slow EMA, the price is below the fast EMA, and the trend is strong.
Momentum Filter
- Based on the price change over the last three bars and compared against the minimum volatility threshold to identify strong momentum.
Buy and Sell Signal Generation
- Buy Signal: Uptrend with RSI oversold, positive MACD histogram, high volatility and volume, strong momentum, and sufficient Bollinger Band width.
- Sell Signal: Downtrend with RSI overbought, negative MACD histogram, high volatility and volume, strong momentum, and sufficient Bollinger Band width.
Visualization
- Buy and sell signals are displayed as green and red triangles on the chart.
- Plots for fast and slow EMAs, upper and lower bands, and Bollinger Bands.
Alerts
The script includes alert conditions for buy and sell signals, allowing notifications to be sent via email or mobile app.
Information Panel
A small table on the chart displays current volatility
- Volatility Status — indicates high or low volatility.
- Bollinger Band Width — current width as a percentage.
- ATR Ratio — ratio of current ATR to long-term average ATR.
This script is suitable for trading in high-volatility conditions, combining multiple filters and factors to generate precise buy and sell signals.

MACD Highlight Zones for PrimetimeUse the MACD Highlight Zones to easily spot changes in market momentum and make more informed trading decisions.
The MACD Highlight Zones script visually enhances your chart by highlighting different zones based on the MACD's relationship to the zero line and its signal line. This script helps traders quickly identify the market's momentum and potential reversal points.
Features:
🟢 Green Background: Indicates the MACD line is above 0, signaling bullish momentum.
🟡 Yellow Background: Indicates the MACD line crosses the signal line, suggesting a potential momentum shift.
🔴 Red Background: Indicates the MACD line is below 0, signaling bearish momentum.

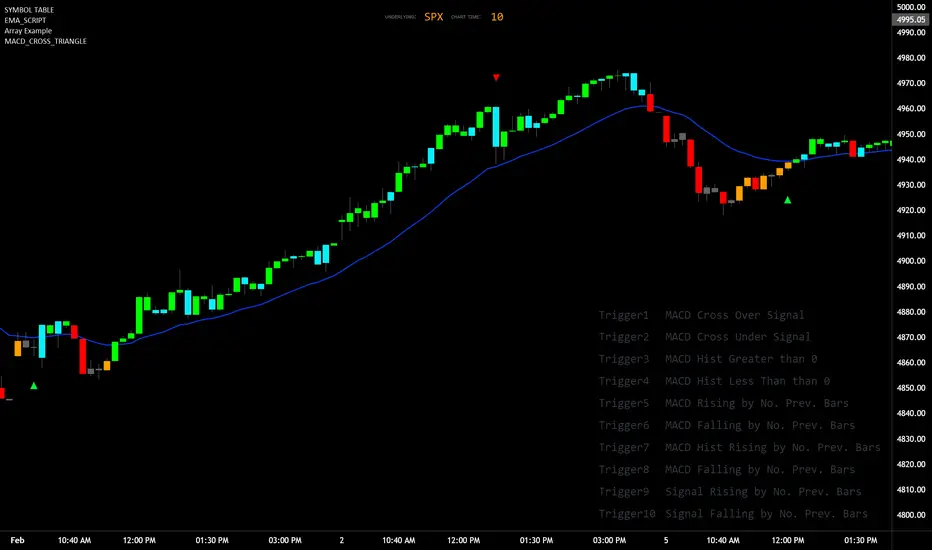
MACD_TRIGGER_CROSS_TRIANGLEMACD Triangle Trigger Indicator by thebearfib
Overview
The MACD Cross Triangle Indicator is a powerful tool for traders who rely on the MACD's signal line crossovers to make informed trading decisions. This indicator enhances the traditional MACD by allowing users to customize triggers for bullish and bearish signals and by displaying these signals directly on the chart with visually distinctive labels.
Features
Customizable Color Scheme: Choose distinct colors for bullish and bearish signals to fit your chart's theme or your personal preference.
Flexible Trigger Conditions: Select from a variety of trigger conditions based on MACD and signal line behaviors over a specified number of bars back.
Visual Signal Indicators: Bullish and bearish signals are marked with upward and downward triangles, making it easy to spot potential entry or exit points.
Detailed Trigger Descriptions: A comprehensive table lists all available triggers and their descriptions, aiding in selection and understanding of each trigger's mechanism.
Configuration Options
Bullish and Bearish Colors: Customize the color of the labels for bullish (upward) and bearish (downward) signals.
Trend Lookback Period: Choose how far back (in bars) the indicator should look to determine the trend, affecting the calculation of certain triggers.
Trigger Selection for Bullish and Bearish Signals: Pick specific triggers for both bullish and bearish conditions from a list of 10 different criteria, ranging from MACD crossovers to historical comparisons of MACD, signal line, and histogram values.
Label Size and Font Settings: Adjust the size of the signal labels on the chart and the font size of the trigger descriptions table to ensure readability and fit with your chart layout.
Trigger Descriptions Table Position and Color: Customize the position and color of the trigger descriptions table to match your chart's aesthetic and layout preferences.
Trigger Mechanisms
Trigger 1 to 10: Each trigger corresponds to a specific condition involving the MACD line, signal line, and histogram. These include crossovers, directional changes compared to previous bars, and comparisons of current values to historical values.
Usage
1. Select Trigger Conditions: Choose the desired triggers for bullish and bearish signals based on your trading strategy.
2. Customize Visuals: Set your preferred colors for the bullish and bearish labels, adjust label and font sizes, and configure the trigger descriptions table.
3. Analyze Signals: Watch for the upward (bullish) and downward (bearish) triangles to identify potential trading opportunities based on MACD crossover signals.
Conclusion
The MACD Cross Triangle Indicator offers a customizable and visually intuitive way to leverage MACD crossover signals for trading. With its flexible settings and clear signal indicators, traders can tailor the indicator to fit their strategy and improve their decision-making process on TradingView.
Fisher+ [OSC]The Fisher Transform Indicator is classified as an oscillator, meaning that its value swings above and below a central point. This characteristic allows traders to identify overbought and oversold conditions, providing potential clues about market reversals. As mentioned previously, it is an oscillator so the strength of the move is displayed by how long the fisher line stays above/below zero. Indicator can be used to aid in confluence near supply/demand zones.
White Line = Fisher
Red/Blue Line = Moving Average
--Changes color whether fisher line is above/below the MA
Red/Blue Shaded Line = Moving Average
--Changes color based on a smoothing factor
Red/Blue Shaded Fill = Asset in Overbought/Oversold Conditions
Red/Blue Circles = Asset in Extreme Overbought/Oversold Conditions
Red/Blue Triangles = MACD Signals Below/Above "0"
Divergence Labels = Asset Signaling Divergence
The moving average line will turn red/blue as long as the fisher line is below/above the moving average. The shaded MA line will switch colors based on if it is moving in an up/down trend. The MA can also be used as a signal and treated similar to an oscillator. Market trending conditions will either keep the MA below/above the dashed zero line.
MACD code credited to LazyBear's MACD Leader indicator. It is used to filter out/confirm any signals such as divergences. As long as the MACD Leader line is above both the MACD line and signal lines then it'll signal with with a triangle. MACD divergences will be added at a later time.

RSI PRECISION v.3RSI PRECISION v.3 (MACD, StochRSI, SMA Signals)
Developed by Giorgos Protonotarios (2021-2023)
RSI PRECISION is an alternative to the classic Relative Strength Index (RSI). The indicator aims to enhance the classic RSI and make it more accurate on longer timeframes. Additionally, the indicator works as an advanced signaling machine, offering five different categories of leading trading signals. RSI PRECISION is an ideal tool for analyzing highly volatile markets, such as cryptocurrency and small-cap stocks.
In this 3rd version, the core formula remains the same, however, there are new trading signals and a great number of new parameters. Traders have the opportunity to fully customize the indicator according to their needs.
What is new ?
The RSI formula remains the same, however, there are additional features:
• Selected StochRSI signals
• Low-timeframe SMA signal (<60 minutes)
• High-timeframe SMA signal (>60 minutes)
• SMA on the RSI PRECISION readings
• Ability to customize everything in settings (tooltips added)
Note: You can turn off any trading signal by unselecting it in Settings>Style.
□ NEW TRADING SIGNALS (v.3)
■ SELECTED STOCHRSI SIGNALS
The selected StochRSI signals are visualized by a cross (+) on the top and bottom of the indicator. The settings for StochRSI are the classic 8.5.3 (customizable). By default, the crossover is generated when StochRSI crosses above 25, and the crossunder when StochRSI crosses below 75.
(i) Bullish StochRSI cross
• Symbol: Cross (+) on the Top
• Event: StochRSI crosses above level 25
(ii) Bearish StochRSI cross
• Symbol: Cross (+) on the Bottom
• Event: StochRSI crosses below level 75
■ SMA CROSSOVERS (LOW/HIGH TIMEFRAMES)
These trading signals are generated when the price of an asset crosses above or below a preset SMA.
There are two different SMAs, one shown on low timeframes, and one on high timeframes. You can adjust the periods for both, by default 200 periods.
(i) Low-Timeframe SMA Cross (<60 minutes)
• Symbol: Bullish (↥) on the top of the indicator and bearish (↧) on the bottom
• Event: The price crosses above or below the selected SMA on low timeframes
(ii) High-Timeframe SMA Cross (>60 minutes)
• Symbol: Bullish (↥) on the top of the indicator and bearish (↧) on the bottom
• Event: The price crosses above or below the selected SMA on high timeframes
■ SMA LINE ON RSI PRECISION
This is just a simple SMA line on the RSI PRECISION readings. By default, it is set at 50 periods.
• SMA Line (blue-dashed)
You can turn it off by unselecting it in Settings>Style.
□ OLDER TRADING SIGNALS
The 3rd version of RSI PRECISION also includes all previous signals.
■ RSI PRECISION CROSSES
This signal corresponds to a bullish/bearish RSI PRECISION cross. By default, it is 5 for a bullish crossover and 100 for a bearish crossunder. These numbers are indicative and can be customized.
(i) Bullish RSI PRECISION Cross
• Symbol: Green arrow (▲) on the Top
• Event: RSI PRECISION crosses above level 5
(ii) Bearish RSI PRECISION Cross
• Symbol: Red arrow (▼) on the Bottom
• Event: RSI PRECISION crosses below level 100
■ MACD CROSSOVER SIGNALS
The MACD signals are visualized by a green/red dot (•). The default settings are the standard MACD settings (12,6,9).
(i) Bullish MACD cross
• Symbol: Green Dot (•) on the Top
• Event: MACD crosses above its signal line
(ii) Bearish MACD cross
• Symbol: Red Dot (•) on the Bottom
• Event: MACD crosses below its signal line
NOTE: In lower timeframes, MACD generates too many signals. You can switch off “MACD BULLISH & BEARISH CROSSOVERS” by clicking on ‘SETTINGS’, then ‘STYLE’, and then unselecting ‘Bullish MACD Cross’ and ‘Bearish MACD Cross’.
■ GOLDEN/DEATH CROSSES (SMA CROSSOVERS)
The cross of the 50-day moving average above the 200-day moving average is called a golden cross, and it is considered a bullish signal. The cross of the 50-day moving average below the 200-day moving average is called a death cross, and it is considered a bearish signal.
The Golden/Death crosses are visualized by (X). By default, 50 periods for the fast SMA and 200 periods for the slow SMA (both are customizable).
(i) Bullish SMA Cross
• Symbol: (X) on the Top
• Event: The fast SMA crosses above the Slow SMA
(ii) Bearish RSI Cross
• Symbol: (X) on the Bottom
• Event: The fast SMA crosses below the Slow SMA
□ More about the Indicator
■ MISSION
Enhancing the classic Relative Strength Index (RSI) and making it more accurate on longer timeframes, during choppy market conditions, and especially near market tops/bottoms.
■ OBJECTIVES
(1) Creating a better RSI that works as an “All-in-one” indicator
(2) Identifying overbought/oversold market levels in a simple and user-friendly manner
(3) Making precise calculations near market tops and bottoms, where price volatility is always booming
(4) Making precise calculations on longer timeframes (weekly, monthly) where the classic RSI readings are hardly readable
(5) Offering five different categories of trading signals (RSI, StochRSI, MACD, Golden/Death Crosses, SMAs) in a single indicator
■ RSI PRECISION CALCULATIONS
The RSI PRECISION formula consists of three (3) different components:
(a) Relative Strength Index component (the classic RSI)
(b) Periodic Price Volatility component (PPV, essential)
(c) RSI Volatility component (less important)
RSI PRECISION FORMULA ADJUSTMENTS
(i) CLASSIC RSI
This measurement corresponds to the classic RSI. If the other two components of the formula are set to zero (0%), then by entering 100% here, the RSI PRECISION becomes identical to the classic RSI.
-By default, 100%
(ii) PERIODIC PRICE VOLATILITY -PPV
The Periodic Price Volatility (PPV) is an advanced measurement of price volatility and an essential component of the core RSI PRECISION formula. You can easily adjust the weight of PPV in the formula.
-By default, 100%
(iii) RSI VOLATILITY
This is an extra measurement of volatility. This time the focus is exclusively on periodic RSI volatility, not on price volatility.
-By default, 5%
■ FINAL THOUGHTS
RSI PRECISION v.3 is an improved RSI indicator offering five leading trading signals. Everything is combined in one place to create an all-in-one TA tool. I have been using it as my only indicator for quite some time.
As always, happy trading, and remember, if you want to rule the world, create code, not war.
□ Giorgos Protonotarios,
Financial Analyst, Building Web
(October 5th 2023)

Double MACD Pattern 1.0This script is designed to assist traders in identifying potential trading signals and trends based on the MACD indicator. Users can adjust the input parameters to fine-tune the indicator to their trading preferences. When specific conditions are met, alerts are generated to notify the user of potential trading opportunities.
Indicator Description:
The script defines a custom indicator that calculates and plots two sets of Moving Average Convergence Divergence (MACD) lines along with their signal lines.
It allows users to configure various parameters for MACD calculation, such as fast and slow lengths for both MACD 1 and MACD 2, as well as signal lengths for both.
Plotting:
The script plots the MACD lines and signal lines for both MACD 1 and MACD 2 on the chart with different colors and line styles.
It also plots a middle line at zero for reference.
Alerts:
The script defines conditions for generating alerts based on MACD crossover and crossunder events for both MACD 1 and MACD 2.
Alerts are generated for the following scenarios:
A long signal is generated when MACD 1 crosses under its signal line while MACD 2 crosses over its signal line.
A short signal is generated when MACD 1 crosses over its signal line while MACD 2 crosses under its signal line.
An up trend signal is generated when MACD 2 crosses over MACD 1.
A down trend signal is generated when MACD 1 crosses over MACD 2.
Alerts are included in the script to notify users of these specific trading signals.
Please note that this script is meant for educational purposes and should be used cautiously in a real trading environment. It's important to have a thorough understanding of technical analysis and risk management when using such indicators in actual trading.
Volatility Adjusted MACDMACD, short for moving average convergence/divergence, is a trading indicator used in technical analysis of securities prices, created by Gerald Appel in the late 1970s. It is designed to reveal changes in the strength, direction, momentum, and duration of a trend in a stock's price.
The MACD indicator (or "oscillator") is a collection of three time series calculated from historical price data, most often the closing price. These three series are: the MACD series proper, the "signal" or "average" series, and the "divergence" series which is the difference between the two. The MACD series is the difference between a "fast" (short period) exponential moving average (EMA), and a "slow" (longer period) EMA of the price series. The average series is an EMA of the MACD series itself.
This version of MACD follows the work of Alex Spiroglou, DipTA(ATAA), CFTe in his 2022 paper that was awarded Charles H. Dow Award by CMT Association . The paper is available on papers.ssrn.com or on website.of CMT Association.
Please refer to the paper for details on construction and trading rules . I personally find the volatility adjusted version as described in this paper more responsive in terms of signals and divergences.
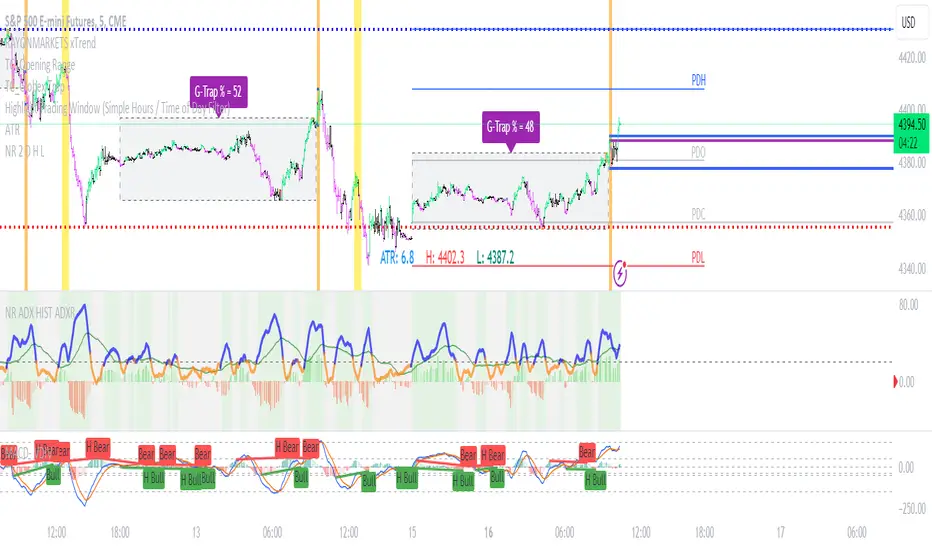
MACD 3D with Signals [Quantigenics]Quantigenics MACD 3D with Buy Sell Signals is a MACD-based trading indicator that aims to identify market trends and potential turning points, for Buy/Sell opportunities, by leveraging price data and volatility.
Unlike the traditional MACD indicator, the average price is calculated from the high, low, and close prices, from which a specialized MACD value is derived. This MACD value, combined with an average and standard deviation, takes into account volatility, and is used to generate an upper and lower boundary.
The indicator color-codes market trends: aqua indicates upward trends (signifying increased buying pressure), red suggests downward trends (increased selling pressure). When the MACD value crosses above the upper boundary or falls below the lower boundary, the color changes to yellow indicating a possible reversal point and "Momentum Crossover Signals" can be plotted at this point. "Standard Signal" arrows can also plotted when the MACD 3D changes from auqa to red and vice-versa.
A trendline is drawn at the median value, providing a baseline for comparison. A differential value, which measures the distance between the MACD value and the median line, provides additional insight into the price's deviation from this baseline (divergences from the underlying price can be spotted using this data as well). The differential is color-coded: green when MACD is above the median, and red when it's below, with darker shades representing a decreasing gap.
Alerts can be set to trigger with the "Standard Signal" arrows appearing after MACD 3D changes from auqa to red and vice-versa and when the "Momentum Crossover Signal" arrows appear when the MACD value crosses above the upper boundary or falls below the lower boundary indicating a potential reversal. Providing immediate notifications which can be especially helpful in larger time frames where it may take time for a trade setup to develop.
CME_MINI:NQ1!
OANDA:XAUUSD
Enjoy the MACD 3D indicator. Happy Trading!
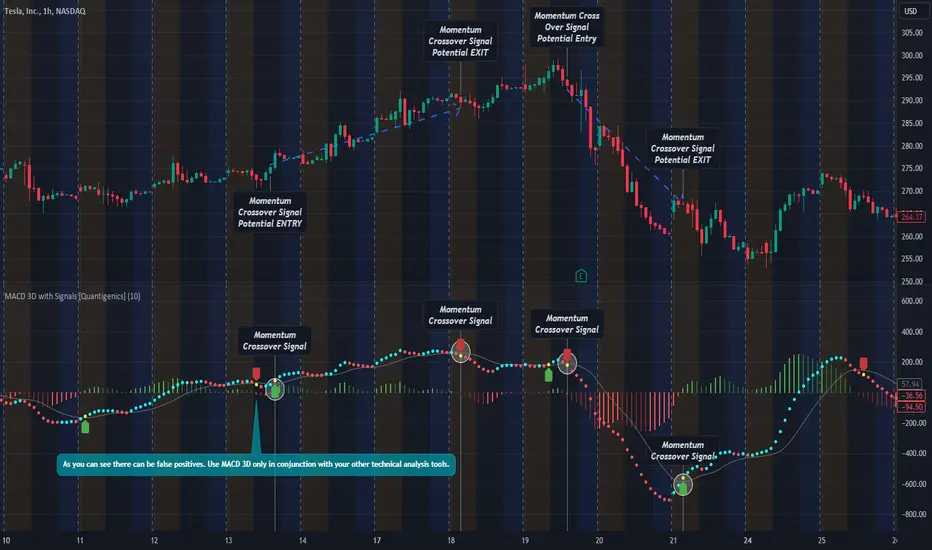
MACD Fake Filter [RH]Introducing a new indicator for the TradingView community based on the MACD indicator! This innovative tool goes beyond traditional MACD signals by analyzing positive and negative waves to determine the average height of the waves to filter false cross-over or cross-under signals during the sideways market.
There are two types of waves created by the MACD line, one is a positive wave above the "zero" line and another is a negative wave below "zero" line. Each wave has peaks. This indicator will find the average height of the positive waves' peaks and plot as a green line(by default). Vice-versa it will also find the average height of the negative waves' peaks and plot as a red line(by default).
Example :
This indicator will show labels when the MACD line crosses-under the MACD signal line above the average height of the positive waves.
Vice-versa, the indicator will show labels when the MACD line crosses-above the MACD signal line below the average height of the negative waves.
Example:
Alerts are also available for these types of cross-over and cross-under.

MACD Optimizer Pro [Kioseff Trading]Massive update! This script now includes 12 different moving averages and 30+ built-in technical indicators to enhance your trading strategy optimization! (:
This script (MACD Optimizer Pro) allows the user to optimize and test hundreds of MACD strategies, simultaneously, in under 40 seconds. Of course, theoretically, an unlimited number of trading strategies can be tested with the MACD Optimizer Pro. After the optimization period - the MACD Optimizer Pro will show the most profitable MACD strategy or, should you choose, the highest win-rate MACD strategy or the most-efficient MACD strategy!
Optimization results can be backtested and verified using the native TradingView backtester - which is included in the MACD Optimizer Pro - and made easy to use! This feature makes settings alerts a simple practice!
Features
Test hundreds of MACD strategies, simultaneously, in under 40 seconds.
Optimize long MACD strategies and short MACD strategies.
12 different built-in moving averages included to improve your MACD strategy.
30+ built-in technical indicators to improve your MACD strategy.
Runs as a strategy script - profit factor, PnL , win-rate, number of trades, max drawdown, equity curve and other pertinent statistics shown.
Alerts
Optimize any MACD setting
Profit targets, trailing stops, fixed stop losses, and a binary MACD strategy can all be tested.
Strategies can be optimized for highest win rate, highest net profit, most efficient profit.
Limit orders can be simulated.
External indicators can be used for optimization i.e. your own, custom-built indicator, an indicator from your favorite author, or almost any publicly available
TradingView indicator.
Date range for optimization and backtesting are configurable.
Explanation
The image above shows a list of configurations for the optimizer. You can
You can test hundreds of different MACD settings in under 40 seconds on any timeframe, asset, etc.
The image above shows additional settings to filter the outcome of your optimization testing. Additionally, you can test an unlimited number of profit targets and stop losses!
You can add one of several built-in TradingView indicators to filter trade entries.
The image above shows all built-in moving averages and TradingView indicators that can be incorporated into your MACD strategy.
Additionally, you can add your own, custom indicator to the optimization test, your favorite indicator by your favorite author or almost any publicly available indicator on TradingView.
The image above shows the settings section in which you can implement this feature.
The image above shows an example of the custom indicator feature! In this instance, I am using the public indicator titled "Self-Optimizing" RSI and requiring it to measure below a level prior to entry! Almost any custom indicator, your favorite indicator, etc. is compatible with this feature!
The MACD Optimizer has improved user friendliness over previous versions. The optimizer can be as simple or complex as you'd like - capable of handling both "easy" and "difficult" tasks at your discretion.
Additionally, you can configure the optimizer to prioritize MACD strategies that earn profit most efficiently!
The image above shows this feature in action.
You can also configure the optimizer to prioritize MACD strategies that achieve the highest win rate!
The image above shows this feature in action.
Instructions
The instructions below show a rudimentary approach to using the optimizer.
1. Build your strategy in the settings.
You should also disable the "Run a Backtest" feature to improve load times during optimization.
The image above shows my custom strategy settings.
Now that you've got some data on your chart - you should try "Freezing" the "Smoothing" setting for MACD . When doing this, the optimizer will test hundreds of MACD settings with a fixed "Smoothing" setting. Try using the best "Smoothing" setting you were able to find for your initial testing.
2. Take the best "Smoothing" setting and test various MACD and Signal Lengths.
The image above shows me configuring the MACD Optimizer to test different MACD line lengths and Signal line lengths with a fixed "smoothing" setting.
From the results, we can see that there are better MACD settings than what was shown in our initial test!
With this information we can execute a TradingView backtest.
3. Execute a TradingView Backtest.
You must enable the "Run a Backtest" feature to perform a TradingView backtest. Additionally, it's advised to enable the "STOP OPTIMIZATION" feature when performing a TradingView backtest. Enabling this feature will improve load times for the backtest to only a few seconds (since the optimizer won't look for the best setting when this feature is enabled).
The image above shows completion of the process!
From here, you can perform further testing, set alerts, etc.
Backtest Settings Shown
Initial Capital: The initial capital used for the shown backtests is $3,500 USD. Set the initial capital to replicate your true starting capital (: PnL for the MACD strategies (listed in table) is calculated using a starting capital of $10,000 USD.
Slippage: The slippage settings for the displayed backtest was set to 2 ticks.
Commission: Commission was adjusted to 0.1%.
Verify Price for Limit Orders was set to 2 ticks.
Optimization
Trading system optimization is immensely advantageous when executed with prudence.
Technical-oriented, mechanical trading systems work when a valid correlation is methodical to the extent that an objective, precisely-defined ruleset can consistently exploit it. If no such correlation exists, or a technical-oriented system is erroneously designed to exploit an illusory correlation (absent predictive utility), the trading system will fail.
Evaluate results practically and test parameters rigorously after discovery. Simply mining the best-performing parameters and immediately trading them is unlikely a winning strategy. Put as much effort into testing strong-performing parameters and building an accompanying system as you would any other trading strategy. Automated optimization involves curve fitting - it's the responsibility of the trader to validate a replicable sequence or correlation and the trading system that exploits it.
Thanks for checking this out!
Script de pago

Limited MACDwhat is "Limited MACD"?
it is macd but it has some useful additional features.
what it does?
it takes limited values ??just like rsi. The highest value it can take is 100 and the lowest value is -100. this way it gets the same highs and lows for different symbols and time slots. which means we can set overbought and oversold values ??with it. he also paints candles according to their values. The closer the price is to the oversold values, the more red, and the closer to the overbought values, the greener.
how it does it?
macd values ??are limited by dividing by extreme values. The macd value is used as the variable for the color.rgb function, this is used to get a different color for each macd value.
how to use it?
The variables in the settings section are the same as standard macd.
Use the colors to identify overbought and oversold zones and to predict possible price reversal points. also the indicator will mark possible turning points. other than that, its use is similar to standard macd and its limits are up to your imagination.
four hour:
one hour:
five minute:
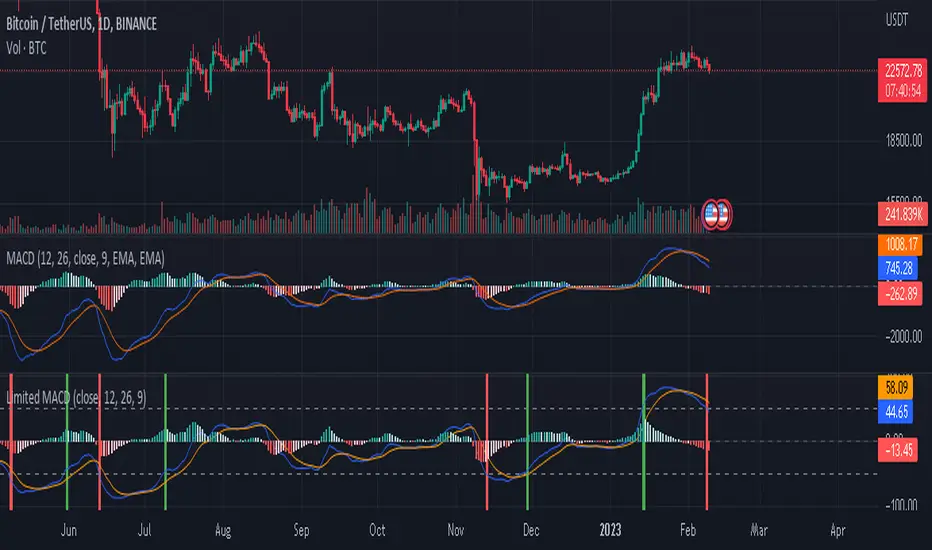
Momentum - EddyThis indicator uses momentum, emas, macd trend, probability to find the best entry for both long and short positions.
L = Long
When the low goes below the green line (ema fast low), close is above open and momentum is up
S = Short
When the high goes above the red line (ema fast high), close is below open and momentum is down
XS = Exit short at potential bullish pivot
When the low is below a red step (probability) and below ema fast low and both ema fast high and low are 0.5 % (can be changed in the settings) spread, and high is below ema fast low and open is at least 0.2 % spread (can be change in the settings).
XL = Exit long
When the high is above ema fast high and above a green step (probability) with at least 0.2 % spread (customizable in the settings)
The win rate changes based on the % change parameter. The lower the % change the higher the win rate will be.
Green and Red background shows you a bull trend or bear trend. It uses the Mac signal (periods are customizable in the settings).
You can add alerts for Long / Short / Exit Long / Exit short.
You can adjust parameters in the settings.
Use your own judgement to place trades. This algorithm helps you remove the stress of trading.
To avoid false signals trade from 4h timeframe +.