HaP MACDHaP MACD - Advanced DEMA Assisted Signal Indicator
Overview
The HaP MACD is an evolution of the classic MACD, designed for traders who demand faster response times and clearer trend visualisations. By integrating DEMA (Double Exponential Moving Average) logic into the standard MACD framework, this indicator filters out noise and highlights momentum shifts with a unique color-coded dot system.
How It Works
The indicator calculates two types of MACD: a standard one for the main lines and a DEMA-based one for signal generation. This dual approach ensures you stay in the trend while being alerted the moment the momentum starts to fade.
Visual Guide & Color Logic
The signal dots are placed directly on the MACD line to guide your decisions:
🔵 Blue Dot: The Entry Signal. Appears when DEMA conditions first align for a bullish move.
🟢 Green Dot: Strong Momentum. The trend is active and the MACD value is increasing.
🟠 Orange Dot: Warning Signal. The bullish trend is still active, but the momentum is slowing down (MACD is lower than the previous bar).
🔴 Red Dot: Exit Signal. The bullish condition has ended. It’s time to consider closing the position or tightening stops.
Key Features
Reduced Lag: DEMA integration provides earlier signals than standard EMA-based MACDs.
Trend Monitoring: Easily distinguish between a healthy trend (Green) and a tiring trend (Orange).
Customizable: Choose between EMA and SMA for both the oscillator and signal calculations.
Crossover Markers: Optional triangle markers for classic MACD crossovers (can be enabled in settings).
M-oscillator

B + A + D v0.4This script combines a momentum histogram (B-Xtrender) with trend strength and direction filters (ADX + DI).
The histogram is built from EMA differentials processed through RSI, showing short- and long-term momentum shifts around the zero line. ADX with DI+ / DI− is used to confirm whether the market is trending and in which direction.
Bullish signals appear when the histogram turns positive and DI+ dominates DI− with sufficient trend strength.
Bearish signals appear when the histogram turns negative and DI− dominates DI+ with sufficient trend strength.
Important note for users:
The strongest and most reliable signals are those that appear immediately after the histogram crosses the zero line (from negative to positive or from positive to negative). Signals that appear later, while the histogram is already extended in the trend, tend to be weaker and should be treated as continuation signals rather than high-probability reversals.
Credits:
Special thanks to the authors of the original concepts and scripts:

Mass Sentiment & Contrarian (Only Signals)
________________________________________
📘 Contrarian Mass Sentiment Indicator Manual
This indicator is designed to identify moments of psychological exhaustion in the market. Its philosophy is "buy panic and sell euphoria."
1. Where and how is the data taken from?
The indicator analyzes three real-time data sources to filter the signals:
• Psychology (RSI): We use the Relative Strength Index (RSI) to measure the speed and change in price movements.
• If the RSI is very high (>70-75), the "mass" is overbuying (greed).
• If the RSI is very low (<25-30), the "mass" is overselling (panic).
• Price Action (Candlesticks): It is not enough for the RSI to be at an extreme. The indicator looks for reversal patterns (Hammer, Shooting Star, or Engulfing candlesticks). This confirms that the price has indeed found a top or bottom.
• Price Action (Candlesticks): It is not enough for the RSI to be at an extreme. The indicator looks for reversal patterns (Hammer, Shooting Star, or Engulfing candlesticks). This confirms that the price has actually found a top or bottom.
• Price Action (Candlesticks): • Market Effort (Volume): At "Strong" levels, the indicator requires volume to exceed its 20-period moving average. This identifies a volume climax, which typically marks the end of a move.
________________________________________
2. User Manual: Signal Interpretation
The indicator classifies opportunities according to their probability of success:
A. Intensity Levels
Label Strength Meaning Suggested Action
F-VTA / F-CPA Strong Maximum euphoria/panic + Volume + Reversal candle. High probability signal. Look for immediate entry.
M-VTA / M-CPA Medium Standard overload level + Reversal candle. Solid technical confirmation. Trade in favor of the structure.
D-VTA / D-CPA Weak The RSI is just beginning to reverse from moderate levels. Early warning. Do not enter without confirmation using other tools.
B. Trade Execution (Contrarian)
1. Location: Wait for a label to appear. The best are the Strong (F) or Medium (M) lines.
2. Stop Loss: Always place it a few pips/points above the high of the signal candle (for selling) or below the low (for buying).
3. Take Profit: * Target 1: The mid-RSI level (50).
or Target 2: The opposite RSI band (if you sold at 70, aim to close at 30).
________________________________________
3. Golden Tips
• Avoid sideways markets: In very narrow ranges, the RSI can give false signals ("wobbling"). Look for signals that occur after a clear and extended trend.
• Timeframes: The indicator is most reliable on 15-minute, 1-hour, and 4-hour timeframes. On the 1-minute timeframe, market "noise" can generate constant weak signals.
• Confluence: If you see an F-VTA (Strong Sell) signal right at a historical price resistance, the probability of success increases dramatically.

Quant VWAP System 3.8 This is the lower-indicator companion to the "Quant VWAP System." While the main chart tells you where the price is, this oscillator tells you how statistically significant the move is.
It uses a Z-Score algorithm to normalize price action. This means it ignores dollar amounts and instead measures how many Standard Deviations (SD) the price is away from its mean (VWAP). This allows you to instantly spot "Overbought" or "Oversold" conditions on any asset (Bitcoin, Forex, or Stocks) without needing to guess.
Key Features:
1. Normalized Extremes (The "Kill Zones")
±2.0 SD: These dotted lines represent statistical extremes. When the signal line crosses above +2.0, the asset is mathematically expensive (Overbought). When it crosses below -2.0, it is mathematically cheap (Oversold).
The Logic: Price rarely sustains movement beyond 2 Standard Deviations without a reversion or a pause.
2. The Squeeze Radar (Yellow Dots)
Volatility Detection: A row of Yellow Dots appearing on the center line indicates a "Squeeze."
What it means: The Standard Deviation bands are compressing. Energy is building.
Warning: DO NOT trade Mean Reversion when you see Yellow Dots. A squeeze often leads to a violent breakout. Wait for the dots to disappear to confirm the direction of the explosion.
3. Momentum Coloring
Green Line: Z-Score is rising (Bullish Momentum).
Red Line: Z-Score is falling (Bearish Momentum).
This helps you spot divergences (e.g., Price makes a Higher High, but the Oscillator makes a Lower High = Exhaustion).
How to Trade with It
Strategy A: The "Zero Bounce" (Trend Continuation)
Scenario: You are in a Bull Trend.
Signal: The Oscillator line pulls back to the Zero Line (White), turns Green, and curls upward.
Meaning: Price has tested the average (VWAP) and buyers have stepped in. This is a high-probability entry for trend continuation.
Strategy B: The "Extreme Fade" (Reversion)
Scenario: The Oscillator pushes deep into the Red Zone (+2.0 SD).
Signal: The line turns Red and crosses back down below the +2.0 dotted line. A small Red Triangle will appear.
Meaning: The statistical extension has failed, and price is likely snapping back to the mean.
Strategy C: Squeeze Breakout
Scenario: Yellow Dots appear on the center line.
Action: Stop trading. Wait.
Signal: The dots disappear, and the line shoots aggressively through +1.0 SD (Long) or -1.0 SD (Short). Ride the momentum.

Market Exhaustion [WavesUnchained]Market Exhaustion
Multi-oscillator exhaustion detector combining MFI + optional CCI, HTF bias, StochRSI timing, and a divergence engine with an Exhaustion Score (0-100).
CORE CONCEPT
- Detects exhaustion via regular divergences anchored on price pivots
- Scores each divergence (0-100) using 5 components
- Line width = quality, color = direction (never thicker than main line)
OSCILLATOR MODES
- MFI : Engine uses MFI only
- CCI : Engine uses CCI mapped to 0-100
- MFI+CCI : Both plotted, engine source selectable (MFI or CCI)
EXHAUSTION SCORE (0-100)
1. Sequence (Div 1/2/3...) - repeated attempts increase score
2. Fatigue - no new oscillator extreme over lookback
3. Formation Time - bars between pivots
4. Reaction - post-divergence bounce/drop vs ATR
5. Impulse - MFI/CCI delta + swing size
DIVERGENCE ENGINE
- Price-pivot anchored (LL/HH) with osc confirmation (HL/LH)
- OS/OB gating with dynamic zones + fallback to 20/80
- Tolerant direction checks (price + osc eps)
- Auto cleanup (max objects)
HTF CONTEXT
- Auto-HTF MFI bias label
- Optional HTF filter for signals
- Bias bonus (optional) for Exhaustion Score
SIGNALS & TIMING
- StochRSI timing + MFI zone confirmation
- Context + timing signals (L/S markers)
- Zone confirm bars
VISUALIZATION
- Color-coded MFI line (OB/OS/neutral)
- Optional CCI (mapped 0-100) line
- Divergence line width = quality, endpoint markers
- Optional mid-label with score
- Dynamic zones + optional fill
BEST USE CASES
- Reversal scouting at extremes
- Filtering weak swings
- 15M-4H swing exhaustion reads
- HTF bias + divergence confluence
Version: 1.0.0
Author: WavesUnchained
Pine Script: v6

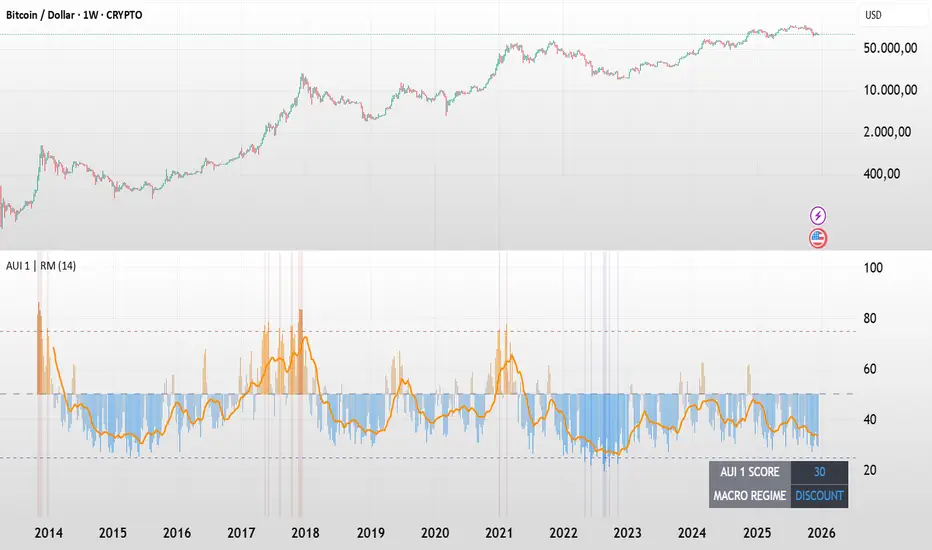
BTC - AUI 1: Macro Sentiment & On-Chain CompositeBTC - AUI 1: Macro Sentiment & On-Chain Composite | RM
Overview & Philosophy The AUI 1 ( Another Ultimate Indicator, Volume 1 ) is a 10-pillar quantitative composite designed to solve the "noise problem" in Bitcoin analysis. Most traders fail because they rely on a single metric in isolation. The AUI 1 aggregates ten distinct dimensions of the network — from speculative flow to institutional extension — into a singular 0–100 score.
The 10-Pillar Quant Framework
Each pillar is mathematically normalized to a standardized 0 to 10 scale . The sum of these pillars creates the final 0–100 index:
1. BEAM (Adaptive Logarithmic Multiple)
• Method: Log-deviation from the 4-year cycle mean.
• Logic: Measures price distance from its fundamental growth curve.
(Credit: BitcoinEcon)
2. MVRV Z-Score (Statistical Distance)
• Method: Standard deviations between Market Cap and Realized Cap.
• Logic: Identifies historical "Fair Value" vs. "Bubble" extremes.
(Credit: M. Mahmudov & D. Puell)
3. Metcalfe’s Law (Network Utility)
• Method: Logarithmic scaling of Active Addresses.
• Logic: Ensures price growth is supported by actual user adoption.
(Credit: T. Peterson)
4. RHODL Proxy (Speculative Flow)
• Method: Supply rotation intensity between HODLers and New Money.
• Logic: Cycle peaks are defined by "Old Money" distributing to "New Money."
(Credit: Philip Swift)
5. AXIS Momentum (Structural Trend Intensity)
• Method: Dual-speed Rate of Change (RoC) fusion engine.
• Logic: Identifies the acceleration and "torque" of the macro trend.
(Credit: Rob_Maths)
6. Mayer Multiple (Institutional Extension)
• Method: Raw distance from the 200-day SMA.
• Logic: Tracks the primary anchor used by institutional mean-reversion desks.
(Credit: Trace Mayer)
7. Unrealized Profit (Financial Pressure)
• Method: Absolute MVRV Ratio mapping.
• Logic: Measures the financial "stress" or "greed" held by the average holder.
8. Retail Participation (Psychology Proxy)
• Method: Inverted Log-Average Transaction Size (USD).
• Logic: Declining transaction sizes historically signal retail FOMO (Euphoria).
9. Volatility Overextension (Structural Risk)
• Method: 30-day Standard Deviation relative to the mean.
• Logic: High-intensity volatility clusters often precede cycle trend-shifts.
10. Macro RSI (Cycle Maturity)
• Method: High-timeframe momentum saturation levels.
• Logic: Identifies the statistical "Buying Exhaustion" of a macro move.
(Credit: J. Welles Wilder Jr.)
How to Read the AXIS Quadrants
The AUI 1 uses a Seamless Heatmap to categorize the market into four specific macro regimes:
❄️ 0–25: FROZEN (Deep Blue) Maximum Opportunity. Structural capitulation where only long-term conviction remains. Historically the "Generational Wealth" window.
🔵 25–50: DISCOUNT (Light Blue to Gray) Value Accumulation. The market is cooling down; risk is mathematically low, and the network is building a structural floor.
🟠 50–75: EXPANSION (Gray to Orange) Trend Acceleration. Healthy bullish growth supported by network utility and positive momentum.
🔥 75–100: SCORCHED (Orange to Deep Red) Terminal Euphoria. Maximum Risk zone. Speculative FOMO is at its peak; the market is fundamentally overextended.
The Orange Signal Line
To filter short-term noise, the AUI 1 includes a Signal Smoothing Line (Parametrizable).
• Cycle Confirmation: Index Bars crossing above the Signal Line indicates trend acceleration.
• Peak Confirmation: If the Index Score rolls over and breaks below the Signal Line while in the SCORCHED zone, the cycle peak is likely confirmed.
Credits & Data Built by Rob_Maths (2025) using on-chain frameworks from Glassnode and IntoTheBlock. Special recognition to the pioneers: Murad Mahmudov, David Puell, Philip Swift, Trace Mayer, and Timothy Peterson.
Strategic Recommendation: For the most accurate macro cycle signals and to filter daily market noise, it is strongly recommended to use this indicator on the Weekly (1W) timeframe.
⚠️ Data Requirement Note: This quantitative composite utilizes professional on-chain data feeds, specifically GLASSNODE:BTC_ACTIVEADDRESSES , GLASSNODE:BTC_ACTIVE1Y , and INTOTHEBLOCK:BTC_MVRV . A TradingView paid plan (Essential or higher) may be required to access these institutional data streams.
Disclaimer This script is for macro-economic research purposes. It is a probabilistic model, not a crystal ball. Past performance is not a guarantee of future results.
Tags:
bitcoin, btc, on-chain, macro, composite, mvrv, rhodl, momentum, index, valuation, active-addresses, cycles, sentiment, risk, AUI, Rob Maths
MacroTide Elasticity SystemThe MacroTide Elasticity System is a professional-grade technical analysis tool designed to identify potential trend exhaustions and reversals by modeling price action as an elastic band stretched from a volume-weighted baseline. Unlike standard oscillators (like RSI) that only look at price changes, MacroTide integrates Volume, Price Range, and Volatility to gauge the "energy" behind a move.
1. Concepts and Methodology
The core concept is Mean Reversion based on Volume-Weighted Elasticity. Markets tend to snap back to a value consensus (mean) after over-extension.
Volume-Weighted Baseline: We use a Volume Weighted Moving Average (VWMA) rather than a simple SMA. This ensures that heavy-volume trading days pull the baseline closer to price, while low-volume drift allows the baseline to lag, accurately representing the "true" average cost.
Elasticity Physics: The oscillator calculates how far price has deviated from this VWMA baseline, measured in standard deviations. This creates a normalized "Elasticity Score" (0-100).
High Score (>80): Price is over-extended to the upside (Overbought) relative to volume support.
Low Score (<20): Price is over-extended to the downside (Oversold).
Institutional Absorption (Churn): The script detects specific bar anomalies where Volume is High but Price Range is Low. This pattern often indicates "Churn"—where institutions are absorbing supply or unloading positions without moving the price significantly.
2. Key Features
MacroTrend Detection: Visualizes the market's stretch limits.
Divergence Scanner: Automatically detects and labels Regular Bullish and Bearish divergences. This occurs when price makes a new extreme, but the Elasticity Oscillator fails to confirm it, signaling waning momentum.
Absorption Events: Highlights yellow "sun" markers on the oscillator when high-volume churn is detected, often preceding a breakout or reversal.
Dynamic Coloring: Candles and oscillator lines change color based on the slope of the elasticity (Green for rising momentum, Red for falling).
3. How to Use
Trend Reversals: Look for the oscillator to enter the Overbought (80) or Oversold (20) zones. A reversal signal (triangle marker) is generated when the oscillator crosses back out of these zones, indicating the "snap back" effect has begun.
Divergence Confirmation: Use the "DIV" labels as early warning signs. A Bullish Divergence in an oversold zone is a high-probability setup for a long entry.
Filtering Trends: The center line (50) acts as a trend filter. Above 50 indicates bullish bias; below 50 indicates bearish bias.
4. Settings & Customisation
Lookback Period: Default is 21 (Swing). Increase to 50 or 100 for Macro/Long-term analysis.
StdDev Multiplier: Adjusts the sensitivity of the bands. Higher values (e.g., 2.5 or 3.0) are better for volatile assets like Crypto.
Absorption Volume Factor: Threshold for detecting churn. Default is 1.5x average volume.
Disclaimer: This tool is for informational purposes only. Past performance (divergences/signals) does not guarantee future results. Always manage risk effectively.

Investment Analysis Bar v2What It Does
A comprehensive analysis bar combining fundamental metrics with technical signals, designed for long-term investors who prioritize quality over momentum.
Core Philosophy: Quality companies trading below their 200 EMA in accumulation zones = opportunities, not warnings.
Tier 1 Bar Metrics
Margins: GM, OM, NIM, FCF Margin
Returns: ROCE, ROE
Growth: Revenue YoY, EPS YoY
Valuation: PE TTM, Forward PE, PEG
Zone: Accumulate / Hold / Trim / Exit
Signal: PRIME / BUY / TRIM / SELL / NEUTRAL
Performance: 1W to 1Y returns
Two Strategy Modes
Value Accumulator (Default) - For long-term position building. Treats below-200-EMA as an opportunity when fundamentals are intact. PRIME signals require: RSI bounce + Volume + Accumulate Zone + All Quality Gates Pass + Below 200 EMA.
Trend Follower - Traditional momentum approach. Prefers entries above 200 EMA.
Quality Gates System
Four fundamental checkpoints:
Gross Margin ≥ 40%
ROCE ≥ 15%
Debt/Equity ≤ 50%
SBC/Revenue ≤ 15%
Strong signals require quality confirmation. PRIME signals require ALL gates to pass.
Zone System
Three calculation methods:
52W Range: Accumulate in bottom 25%, Trim in top 25%
Manual Levels: Set your own price targets
ATR-Based: Dynamic zones from EMA ± ATR
Signal Hierarchy (Value Mode)
SignalMeaning
PRIME 💎Optimal entry - all conditions aligned
BUY 🔼Strong accumulation signal
BUY? ↗Decent entry, not ideal zone
ACCUM 🎯In accumulation zone, quality OK
WAIT ⏳Setup forming, no bounce yet
TRIM 📤Consider taking profits
Alerts Included
Zone transitions (Accumulate, Trim, Exit)
PRIME Entry Signal
Strong Buy / Sell signals
Quality Gate failures
Quality Accumulation Setup
Best Used On
US stocks with fundamental data available. Technical features work on all symbols.
Settings
Fully customizable:
Toggle each metric category
Adjust quality gate thresholds
Choose zone calculation method
Configure RSI/volume parameters
Position bar and panel anywhere

BTC - BEAM: Adaptive Multiple (Open-Source)Title: BTC - BEAM: Adaptive Multiple Cycle Oscillator | RM
Overview & Philosophy
The BTC - BEAM (Bitcoin Economics Adaptive Multiple) is a premier macro-valuation tool designed to identify the "Logarithmic Pulse" of Bitcoin's 4-year cycles. Unlike standard oscillators that lose relevance as the network grows, BEAM uses an adaptive baseline that tracks Bitcoin’s fundamental growth curve with precision.
It identifies the harmonic distance between the current price and its multi-year mean, helping you spot the rare windows of deep capitulation and terminal euphoria.
Methodology
This edition is a hardened, gap-proof and Open-Source implementation of the canonical BEAM model.
1. The 1400-Day Anchor (200 Weeks):
The model is anchored to a 1400-day Simple Moving Average. On the Weekly chart, this aligns with the legendary 200-week moving average—the historical "floor" of the Bitcoin network. It represents one full halving cycle of data.
2. Daily-Lock Architecture:
Even when viewed on the 1W chart, the script performs its calculations using Daily data. This ensures that the oscillator captures the exact peak day of a cycle, providing a "high-resolution" signal within a "low-noise" weekly environment.
3. Logarithmic Normalization:
We calculate the natural logarithm of the price-to-mean relationship, scaled by a factor of 2.5: Score = ln(Price / 1400d MA) / 2.5 This creates a standardized "Multiple" that remains comparable across all Bitcoin eras.
How to Read the Chart (1W Context)
🟧 The BEAM Line (Orange): Tracks the "macro heat" of the market. On the 1W chart, look for the slope of this line to identify cycle acceleration.
🔴 The Cycle Ceiling (Score > 1.0): Historical Cycle Tops. When the weekly candle sustains in this zone, the market has reached a state of unsustainable mania. Every major blow-off top has been captured in this red corridor.
🟢 The Cycle Floor (Score < 0.1): Generational Accumulation. On the 1W chart, these zones appear as extended "green troughs." These are the only times in history where Bitcoin is fundamentally "too cheap" relative to its 4-year trend.
The Status Dashboard
The bottom-right monitor provides immediate cycle classification:
• BEAM Score: The exact logarithmic multiple.
• Cycle Regime: ACCUMULATION , NEUTRAL , or OVERHEATED .
Credits
BitcoinEcon: For the original concept of the BEAM adaptive model.
⚠️ RECOMMENDATION: While this indicator captures daily data, it is strongly recommended to be viewed on the Weekly (1W) Timeframe. The 1W chart filters market noise and perfectly reveals the long-term "Cycle Narrative."
Disclaimer
This script is for research and educational purposes only. Macro indicators provide structural context; they are not crystal balls. Always manage your risk according to your personal financial plan.
Tags
bitcoin, btc, beam, macro, cycle, halving, log-growth, valuation, on-chain, Rob Maths

ITCP ATR BB RSI Stoch SignalsThis indicator generates BUY/SELL signals when price stretches outside Bollinger Bands during elevated volatility, confirmed by RSI, a Stochastic crossover, and a volume filter. To reduce counter-trend entries, it applies a macro trend filter using the Daily SMA 200: it looks for longs only above the SMA 200 and shorts only below it.
It tends to perform best in Forex, especially on liquid pairs, because market conditions (liquidity, continuous sessions, and relatively stable spreads on major pairs) often suit this confirmation-based approach. That said, it can be adapted to other markets (indices, commodities, or crypto) by tuning parameters such as Bollinger length/deviation, RSI/Stoch thresholds, and ATR settings (multipliers/factors) to fit the asset’s volatility.
It also plots ATR-based stop-loss reference levels (configurable smoothing) and includes webhook-ready alerts with a JSON payload (action, symbol, price, stop_loss, time, and interval) for external automation. The goal is to support rules-based execution and reduce impulsive trades: if conditions don’t align, there’s no signal.
If you manage to improve it, discover better settings, or build a more robust solution inspired by this, I’d really appreciate it if you share it back (even if it’s just feedback or an idea). I’m open to collaborating and iterating together to create stronger versions over time.

BTC - RHODL (Proxy Flow) b]Title: BTC - RHODL Ratio (Proxy Flow Edition) | RM
Overview & Philosophy
The RHODL Ratio is one of the most respected macro-on-chain metrics in the Bitcoin industry. Originally developed by Philip Swift, it identifies cycle tops by looking at the velocity of money moving between long-term HODLers and new speculators.
Why a "Proxy" instead of the "Original"? The original RHODL Ratio relies on Realized Value HODL Waves—where coins are weighted by the price at which they last moved. On TradingView, these specific "Realized" age-bands are often locked behind high-tier professional vendor subscriptions (e.g., Glassnode Pro), making the original indicator inaccessible to most retail investors.
To solve this, I present this Proxy Flow Edition. Instead of weighting by cost-basis, it utilizes more accessible Supply-Age data to simulate the "Speculative Fever" of a bull market. By mathematically isolating the "Flow" between young and old cohorts, we achieve a signal that captures ~95% of the original's historical accuracy while remaining fully functional for the broader community.
Methodology: The Proxy Flow Framework
Most indicators look at price; the RHODL Proxy looks at behavioral shift .
1. The Young vs. Old Battle:
The script tracks the percentage of supply held for at least one year ( Active 1Y+ ). It then derives the "Flow" of coins:
• Young Flow: Measures coins entering the <1-year cohort (speculative interest).
• Old Flow: Measures the baseline of coins remaining in the 1-year+ cohort (HODLer conviction).
2. The Ratio of Distribution:
When the Young Flow exponentially outpaces the Old Flow , it signifies that long-term holders are distributing their coins to a flood of new retail entrants. Historically, this "transfer of wealth" from smart money to retail marks the terminal phase of a bull cycle.
3. Age Normalization:
Bitcoin’s network naturally matures over time. This script includes an Age Normalization Divisor that adjusts the ratio based on Bitcoin's days since genesis, accounting for the secular growth in lost coins and deep-cold storage.
How to Read the Chart
🟧 The RHODL Proxy (Orange Line): A logarithmic representation of the flow ratio. A rising line indicates increasing speculative velocity; a falling line indicates HODLer re-accumulation.
🔴 The Overheated Zone (> 0.5): The danger zone. This area captures the "Speculative Fever" typical of cycle peaks. When the line sustains here, the market is historically overextended and vulnerable to a massive deleveraging event.
🟢 The Accumulation Zone (< -0.5): The maximum opportunity zone. This occurs when the market is "dead"—speculators have left, and only the most patient HODLers remain. Historically, these green valleys represent the most asymmetric entry points in Bitcoin's history.
Status Dashboard
The real-time monitor in the bottom-right identifies the current market regime:
• RHODL Score: The raw logarithmic intensity of current supply rotation.
• Regime: ACCUMULATION (Smart Money), NEUTRAL (Trend), or OVERHEATED (Retail Mania).
Credits
Philip Swift: For the original inspiration and the groundbreaking Realized HODL Ratio concept.
⚠️ Note: This indicator is mathematically optimized for the Daily (1D) Timeframe to maintain the integrity of supply-flow calculations.
Disclaimer
This script is for research and educational purposes only. On-chain metrics are probabilistic, not deterministic. Always manage your risk according to your investment horizon.
Tags
bitcoin, btc, rhodl, on-chain, hodl, cycles, speculation, rotation, macro, Rob Maths

Trend Speed & ALMA vs VWAP Oscillator# Trend Speed ALMA VWAP Oscillator (TSAV Osc)
## Overview
The **Trend Speed ALMA VWAP Oscillator** is a MACD-style oscillator that combines three powerful concepts: the Trend Speed Analyzer's dynamic EMA, ALMA (Arnaud Legoux Moving Average) bands, and Volume Weighted Average Price (VWAP). It measures trend strength and momentum relative to VWAP, providing clear visual signals for trend direction and potential reversals.
## Key Features
- **MACD-Style Display**: Familiar oscillator layout with lines, signal lines, and histogram
- **Multiple VWAP Types**: Session, Rolling (1-24 hours), and Weekly anchored VWAP
- **Dynamic Trend Analysis**: Adaptive EMA with acceleration factor from Trend Speed Analyzer
- **ALMA Band Integration**: Fast and slow ALMA for crossover signals
- **Chart Overlay**: Optional plots of Dynamic Trend, VWAP, and ALMA bands on price chart
- **VWAP Standard Deviation Bands**: +/- 1, 2, 3 standard deviation bands
## Indicator Components
### Oscillator Pane
| Component | Description |
|-----------|-------------|
| **Trend vs VWAP Line** | Distance between Dynamic Trend EMA and VWAP (blue) |
| **Trend Signal Line** | EMA of Trend vs VWAP for crossover signals (cyan) |
| **ALMA vs VWAP Line** | Distance between fast ALMA and VWAP (orange) |
| **ALMA Signal Line** | EMA of ALMA vs VWAP (yellow) |
| **Histogram** | Configurable: Trend Strength, Trend vs VWAP, or ALMA vs VWAP |
| **Zero Line** | White reference line at zero (VWAP level) |
### Chart Overlay (Optional)
| Component | Description |
|-----------|-------------|
| **Dynamic Trend** | Dotted line colored by histogram gradient |
| **VWAP** | Thick solid line, green above/red below trend |
| **VWAP Bands** | Standard deviation bands (+/- 1, 2, 3 std) |
| **ALMA Bands** | Fast and slow ALMA with optional fill |
### Signal Markers
| Signal | Shape | Meaning |
|--------|-------|---------|
| **Triangle Up** (green) | Bottom | Trend vs VWAP crossed above signal line |
| **Triangle Down** (red) | Top | Trend vs VWAP crossed below signal line |
| **X Cross** (green) | Zero line | Dynamic Trend crossed above VWAP |
| **X Cross** (red) | Zero line | Dynamic Trend crossed below VWAP |
| **Circle** (green) | Oscillator | ALMA bullish cross (configurable source) |
| **Circle** (red) | Oscillator | ALMA bearish cross (configurable source) |
| **Background Highlight** | Full bar | Ideal entry condition met |
## VWAP Types
### Session VWAP
Resets at a configurable anchor time (default 9:30 AM EST). Best for intraday trading with regular market hours.
### Rolling VWAP
Uses a moving window of 1, 2, 3, 4, 8, 12, or 24 hours. Best for continuous markets or when you want a shorter-term volume-weighted reference.
### Weekly VWAP
Resets at the start of each trading week using `timeframe.change("W")`. Works across all market types:
- **Stocks**: Resets Monday morning
- **Futures**: Resets at futures week open
- **Crypto**: Resets at calendar week start
## Settings Guide
### VWAP Settings
- **VWAP Type**: Session, Rolling, or Weekly
- **Anchor Time**: Reset time for Session VWAP (EST timezone)
- **Rolling Period**: Window size for Rolling VWAP
- **VWAP Source**: Price source for VWAP calculation (default: hlc3)
### Trend Speed Settings
- **Maximum Length**: Upper limit for dynamic moving average (default: 50)
- **Accelerator Multiplier**: Responsiveness to price changes (default: 5.0)
- **Speed Smoothing**: Hull MA period for speed smoothing (default: 5)
### ALMA Settings
- **ALMA 1 (Fast)**: Length, Offset, Sigma for fast ALMA
- **ALMA 2 (Slow)**: Length, Offset, Sigma for slow ALMA
### MACD Settings
- **Signal Line Length**: EMA period for signal lines (default: 9)
### Display Settings
- **Histogram Source**: Choose what the histogram displays
- **ALMA Cross Source**: "ALMA Bands" (ALMA1 vs ALMA2) or "Oscillator Signal" (vs signal line)
- **Show/Hide**: Toggle individual components
### Chart Overlay
- **Show Dynamic Trend**: Dotted trend line on chart
- **Show VWAP**: Thick VWAP line on chart
- **Show VWAP Std Dev Bands**: +/- 1, 2, 3 standard deviation bands
- **Show ALMA Bands**: ALMA1 and ALMA2 on chart
- **Show ALMA Fill**: Fill between ALMA bands
## Trading Guidelines
### Bullish Signals
1. Trend vs VWAP line crosses above signal line (triangle up)
2. Dynamic Trend crosses above zero/VWAP (green X)
3. ALMA bullish cross (green circle)
4. **Ideal Long**: All three align with positive histogram
### Bearish Signals
1. Trend vs VWAP line crosses below signal line (triangle down)
2. Dynamic Trend crosses below zero/VWAP (red X)
3. ALMA bearish cross (red circle)
4. **Ideal Short**: All three align with negative histogram
### Reading the Histogram
- **Bright Green**: Strong bullish momentum (trend accelerating up)
- **Light Green**: Weak bullish momentum (trend slowing)
- **Light Red**: Weak bearish momentum (trend slowing)
- **Bright Red**: Strong bearish momentum (trend accelerating down)
### VWAP as Support/Resistance
- Price above VWAP with positive oscillator = bullish bias
- Price below VWAP with negative oscillator = bearish bias
- Oscillator crossing zero = potential trend change at VWAP
## Installation
1. Copy the source code from `trend-speed-alma-vwap-oscillator.pine`
2. Open TradingView's Pine Editor
3. Paste the code and click "Add to Chart"
4. Configure settings based on your trading style
## Files Included
- `trend-speed-alma-vwap-oscillator.pine` - Main indicator implementation
- `README.md` - This documentation file
## Based On
- **Trend Speed Analyzer** by Zeiierman - Dynamic EMA and speed calculations
- **ALMA** (Arnaud Legoux Moving Average) - Built-in TradingView function
- **VWAP** - Volume Weighted Average Price with custom anchoring
## Disclaimer
Trading involves substantial risk of loss and is not suitable for all investors. Past performance is not indicative of future results. This indicator is for educational purposes only and should not be considered as investment advice.

VCTOS - Volatility & Candle Transition OscillatorShort Description (one-line summary)
Displays candle and volatility-based trend transitions using EMA relationships and adaptive dynamic thresholds.
Full Description
Overview
This VCTOS (Volatility & Candle Transition Oscillator System) indicator visualizes market structure, volatility, and transition phases using a custom oscillator-based candle model.
Its purpose is to provide contextual insight into pressure, strength, and loss of momentum, not to predict future price movement and not to provide trading signals.
________________________________________
What Makes This Script Distinct
The indicator is designed to make relative market strength observable:
• Taller candles reflect higher volatility
• Shorter candles reflect reduced activity
• Candles extending far beyond the threshold suggest stronger conditions
• Compression toward the threshold suggests weakening pressure
While the base calculations use EMA-derived components, the indicator’s distinguishing feature is its adaptive advanced threshold logic, which frames volatility in a consistent and measurable way across different conditions.
________________________________________
How to Read It
One way to interpret the oscillator candles is by comparing them against price to observe divergence, compression, and loss of momentum.
To support this, candles are labeled with incrementing numbers.
These numbers do not represent signals, probabilities, or trade instructions. They simply indicate how long a sequence has been developing.
The label colors reflect transition phases:
• Blue – early phase
• Orange – transition building
• Green – late phase
A green label indicates that a sequence has matured, not that a transition will occur. Interpreting whether this information is meaningful depends on broader market context.
________________________________________
Oscillator Candle Representation
Price action is transformed into candles plotted around a zero line in oscillator form.
Each candle reflects relative movement and is color-coded based on its current state:
• Green – upward pressure
• Orange – range or transitional behavior
• Red – downward pressure
Because absolute market tops and bottoms cannot be known in advance, the oscillator format focuses on relative extremes and structural behavior, rather than fixed price levels.
________________________________________
Dynamic Candle Threshold Line
A dotted Candle Threshold Line is plotted above and below the oscillator candles.
This line is not a simple average. It dynamically adapts using the most relevant extreme values observed over time, allowing it to adjust automatically to changing volatility conditions.
The threshold line serves as a reference zone where market conditions may become stretched. It is a dynamic indication only and should not be interpreted as a reversal level or predictive boundary.
________________________________________
Volatility Line
The indicator includes a Volatility Line representing directional pressure:
• Above zero – downward pressure
• Below zero – upward pressure
Short colored threshold lines appear on the indicator right areas where pressure threshold was in the past. These segments are contextual references, not triggers.
The slope and magnitude of the volatility line are emphasized, as they reflect increasing or decreasing pressure rather than binary conditions.
________________________________________
Timeframes and Assets
The indicator is designed to work on any asset and any timeframe.
The active timeframe is displayed in the top-right corner of the chart.
Using multiple timeframes can help place short-term structure within broader market context.
________________________________________
Usage Notes
• This indicator does not generate trade entries, exit signals, or financial recommendations.
• This indicator does not predict future price movement
• Colored candles and labels highlight contextual phases within market behavior and should not be interpreted as buy or sell signals.
• Zero-line interactions in the volatility line visually mark potential phase transitions, not confirmed trend changes.
• All visuals are intended for analytical and educational purposes only.
• Users are encouraged to integrate this indicator within their own analytical or confirmation framework.
• Numerical labels are iterative and do not carry standalone predictive meaning.
• The distance between the oscillator candles, the candle threshold line, and the volatility threshold levels can help visualize relative market strength and pressure, but should not be interpreted as a forecast or signal.
The indicator is intended as a market-structure and volatility visualization tool, not as a standalone decision system.
________________________________________
Access
This is an invite-only script.
Access is restricted to users who have been granted permission by the author.
To request access, contact me through vtostrading@gmail.com
Approved users will find the indicator under Invite-only scripts in the TradingView Indicators panel.
________________________________________
Disclaimer
VCTOS is provided strictly for informational and educational purposes.
It does not constitute financial advice, investment guidance, or performance assurance.
All users should conduct independent analysis and manage their own risk responsibly.

The Beast (Adaptive Companion)⚡Quick Start
Shows momentum behind every signal
Histogram view (clearer than lines)
Highlights re-entry preparation
Plots entries and re-entries in the panel
Designed to be used together with "The Beast (Main) indicator.
📊 Overview
This oscillator is a visual companion to the main indicator.
It explains why signals occur, not just when.
It uses the same Z-Score logic and thresholds, giving you a clear view of momentum, pullbacks, and continuation setups.
📈 What You See
Z-Score Histogram
Green → strong bullish momentum
Red → strong bearish momentum
Neutral → low or mixed momentum
Threshold Levels
Zero line
Positive and negative thresholds
These match the exact rules used for entries.
Re-Entry Arming (Background Highlight)
The background subtly highlights when:
A bullish re-entry is being prepared
A bearish re-entry is being prepared
This helps you anticipate continuation trades, not chase them.
Signal Markers (In the Panel)
The oscillator displays:
▲ BUY entries
▼ SELL entries
✕ Re-entries
This keeps the price chart clean while preserving full context.
🔗 How Both Indicators Work Together
Main Indicator → What to do (entries on price)
Oscillator Companion → Why it happens (momentum + structure)
When both use the same input values, they stay perfectly aligned and create a clear, intuitive workflow.
✅ Final Notes
Non-repainting
Rule-based
Designed for clarity, not signal spam
Best used with proper risk management

TrendX Amila Bro SignalsTrendX Amila Bro is a trend-following TradingView indicator designed to identify high-probability BUY and SELL signals by combining EMA crossovers, RSI strength, Fibonacci retracement zones, and optional RSI divergence confirmation.
The indicator is built to work on any market (Forex, Gold, Crypto, Indices, Stocks) and any timeframe, with best performance during trending market conditions.
🔹 Core Features
Fast & Slow EMA crossover to detect trend direction
RSI strength filter to avoid weak or low-momentum signals
Optional Fibonacci 50% & 61.8% zone filter for pullback entries
Optional RSI divergence filter for stronger confirmations
Clear BUY / SELL arrows directly on the price chart
Customizable inputs for full control
🔸 Signal Types
BUY / SELL
Basic EMA + RSI signals (always visible)
BUY+ / SELL+
Strong signals when EMA + RSI + Fibonacci + Divergence all agree
⚙️ Settings Guide
Fast EMA / Slow EMA – Adjust trend sensitivity
RSI Levels – Control momentum strength for entries
Use Fibonacci Filter – Enable for pullback-based entries
Use RSI Divergence Filter – Enable for extra confirmation
Fib Zone Distance % – Defines tolerance around Fib levels
💡 Tip: Turn Fib & Divergence filters OFF for more signals,
turn them ON for higher-quality setups.
📈 Best Use
Trending markets
Pullback entries in trend direction
Confluence with support/resistance or price action
⚠️ Disclaimer
This indicator is for educational purposes only and does not guarantee profits. Always use proper risk management and confirm signals with your own analysis.

Swing Master by Pooja📘 Swing Master by Pooja
Invite-Only | Rule-Based Swing & Trend Structure Indicator
🔍 What this indicator is
Swing Master by Pooja is a rule-based technical analysis indicator designed to help traders identify high-quality swing opportunities within an established trend structure.
This script is not a trading strategy.
It does not execute trades and does not provide fixed targets or stop-loss levels.
Instead, it functions as a decision-support tool.
Visual signals appear only on confirmed candles, and only when trend structure, momentum, and market participation align together.
The core objective of this indicator is filtering low-quality market conditions and avoiding random entries, not generating frequent signals.
🎯 Intended Trading Use
This indicator is intended for traders who:
Trade trend-based swings and pullbacks
Prefer structure-aligned entries instead of chasing price
Want multi-factor confirmation before acting
Apply their own execution and risk-management rules
Applicable on:
Indices
Stocks
Futures
Intraday & higher-timeframe swing charts
🧠 Why this is NOT a simple indicator mashup
Although Swing Master uses EMA, RSI, Volume, and multi-timeframe context, each component serves a distinct and non-overlapping role.
No indicator is used to confirm itself, and no single condition can trigger a signal independently.
Signals are generated only when all required structural and momentum conditions align together on a confirmed bar, reducing noise and hindsight bias.
🔹 EMA Structure (50 / 100 / 200)
Defines trend hierarchy and market structure
Strictly filters trades in the dominant trend direction
Identifies pullback zones, not breakout points
EMA stacking is used to determine structural bias, not direct entries.
🔹 Pullback-Tolerance Logic (Key Original Component)
Instead of requiring exact EMA touches, the script applies a tolerance-based pullback zone around EMAs.
This allows:
More realistic swing entries
Fewer missed opportunities
Reduced noise compared to rigid EMA rules
This pullback-zone evaluation is custom-designed and central to the indicator’s behavior.
🔹 RSI Momentum Filter
Ensures pullbacks occur with momentum acceptance
Filters entries during weak or exhausted moves
Helps avoid counter-trend traps
RSI is used strictly as a momentum-quality filter, not as a standalone signal.
🔹 Volume Participation Filter
Confirms that price movement has market participation
Filters signals during low-interest or weak-volume phases
Helps avoid false continuation attempts
🚦 Signal Types Explained (Rule-Specific & Non-Repeating)
Each visual signal represents a distinct market condition, not repeated logic.
▸ sb — Swing Buy
Trend-aligned pullback near EMA structure
RSI confirms momentum
Volume confirms participation
▸ FS — Future Sell
Mirror logic of Swing Buy
Appears only in established downtrends
▸ SB / SS — Strong Buy / Strong Sell Zones
Price acceptance above or below all EMAs
Indicates strong directional control
Plotted only on the first bar of zone entry (no repetition)
▸ GB / GS — Golden Buy / Golden Sell
EMA 100 / EMA 200 crossover
Represents a structural trend transition
Appears only on confirmed crossovers
Each signal type follows its own independent rule-set.
📊 Multi-Timeframe Dashboard (Context Only)
The optional dashboard provides:
Trend state across higher timeframes
Top-down market context for directional bias
The dashboard is informational only and does not generate signals.
🔔 Alerts
Alert conditions are available for all signal types.
Alerts trigger only on confirmed candles and are intended to support manual analysis, not automated trading.
🔐 Why Invite-Only & Closed-Source
Swing Master incorporates:
Stateful signal control
Multi-condition validation
Non-repeating signal logic
Custom pullback-zone evaluation
The source code is protected to preserve the internal interaction, sequencing, and state management logic, not to conceal commonly known indicators.
⚠ Disclaimer
This indicator is provided for educational and analytical purposes only.
It does not constitute financial advice and does not guarantee results.
All trading decisions, execution, and risk management remain entirely the user’s responsibility.

RSS3 - Reversal Score System v3 [Rulph]RSS3 - Reversal Score System v3
RSS3 is a quantitative reversal detection system that combines volatility pressure analysis with directional momentum exhaustion to produce a unified reversal strength score from -1 (extreme bullish) to +1 (extreme bearish).
Unlike traditional single-indicator divergence systems (RSI, MACD), RSS3 cross-validates signals between two independent analytical engines (VPI and TDFI) and applies multi-timeframe contextual filtering to reduce false signals.
RSS3 is not a visual overlay of separate indicators. It implements a unified calculation pipeline where VPI and TDFI components feed into a single normalized Score through weighted aggregation. The divergence bonus system creates feedback loops where price-indicator relationships dynamically adjust the final Score, producing signals that cannot be replicated by simply viewing RSI, Bollinger Bands, and moving averages side-by-side.
━━━━━━━━━━━━━━━━━━━━━━━━━━━━━━━━━━
WHY COMBINE VOLATILITY + TREND FORCE?
━━━━━━━━━━━━━━━━━━━━━━━━━━━━━━━━━━
Most reversal systems rely on a single dimension:
• RSI divergence tracks momentum exhaustion
• Bollinger extremes track volatility expansion
• MACD divergence tracks trend deceleration
RSS3 recognizes that major reversals typically require both :
1. Volatility pressure buildup (market stretched beyond normal range)
2. Directional force exhaustion (trend losing momentum despite stretched price)
When VPI (volatility) and TDFI (trend force) diverge simultaneously from price, it signals a high-probability reversal zone. When only one diverges, the signal is weighted accordingly.
This dual-validation approach filters out:
• Momentum exhaustion in low-volatility consolidations (no VPI confirmation)
• Volatility spikes within strong trends (no TDFI exhaustion)
━━━━━━━━━━━━━━━━━━━━━━━━━━━━━━━━━━
COMPONENT 1: VOLATILITY PRESSURE INDEX (VPI)
━━━━━━━━━━━━━━━━━━━━━━━━━━━━━━━━━━
VPI quantifies how far the market has deviated from its equilibrium state using four factors:
1. RSI deviation from 50
Measures directional bias accumulation. When RSI stays at 70+ or 30- for extended periods, it signals persistent one-sided pressure.
2. Annualized volatility (VIX-style)
Calculates rolling standard deviation of returns scaled to annual terms. Rising volatility indicates increasing uncertainty and potential for mean reversion.
3. Normalized candle range
Compares current bar's range to recent average range. Expanding ranges signal climactic moves.
4. Bollinger Band position
Measures price distance from statistical mean (middle band). Touches or penetrations of outer bands indicate statistical overextension.
How they combine:
Each component is normalized to 0-1 scale, then weighted based on current market regime (trending vs ranging). The weighted average produces VPI reading where:
• VPI > 0.5 = overbought pressure zone
• VPI < -0.5 = oversold pressure zone
━━━━━━━━━━━━━━━━━━━━━━━━━━━━━━━━━━
COMPONENT 2: TREND DIRECTION FORCE INDEX (TDFI)
━━━━━━━━━━━━━━━━━━━━━━━━━━━━━━━━━━
TDFI measures the strength and sustainability of directional movement using moving average dynamics:
1. MA spread (fast MMA vs slow SMMA)
When fast MA pulls far from slow MA, it indicates strong directional momentum. When the spread contracts, momentum is fading.
2. Average impulse between MAs
Calculates the velocity of the spread change. Rapid expansion = acceleration phase; slowing expansion or contraction = deceleration/exhaustion.
3. Normalized trend strength
The spread and impulse are normalized relative to recent volatility to make TDFI comparable across different instruments and market conditions.
Output:
• TDFI > 0.7 = unsustainably strong bullish momentum
• TDFI < -0.7 = unsustainably strong bearish momentum
• TDFI near 0 = directionless or balanced market
━━━━━━━━━━━━━━━━━━━━━━━━━━━━━━━━━━
SCORE CALCULATION & DIVERGENCE INTEGRATION
━━━━━━━━━━━━━━━━━━━━━━━━━━━━━━━━━━
Base Score:
Score = (VPI_weight × VPI) + (TDFI_weight × TDFI)
This creates a continuous measure where:
• Score > +0.5 = bearish reversal zone (high VPI + weak bullish TDFI)
• Score < -0.5 = bullish reversal zone (low VPI + weak bearish TDFI)
Divergence Bonus System:
When classic divergences are detected (price makes new high/low but VPI or TDFI doesn't), a bonus/penalty is applied to Score:
• Decay mechanism: Divergence influence fades linearly over 15 bars (default). Fresh divergences have maximum impact; older ones gradually lose weight.
• Amplitude weighting: Larger divergences (bigger spread between price and indicator pivots) receive stronger bonuses.
• Dual-source amplification: When VPI and TDFI diverge on the same pivot (double divergence), their bonuses stack, creating extreme Score readings near ±1.0.
This means:
• Score = 0.9 with v3t2 label = third VPI + second TDFI bearish divergence, very high confidence
• Score = -0.85 with v1 label = first VPI bullish divergence, strong but early signal
━━━━━━━━━━━━━━━━━━━━━━━━━━━━━━━━━━
CALCULATION MECHANICS (DETAILED)
━━━━━━━━━━━━━━━━━━━━━━━━━━━━━━━━━━
VPI Component Weighting:
Weights are dynamically adjusted based on market regime detected by TDFI:
• Trending regime (|TDFI| > 0.5): RSI deviation 40%, BB position 30%, volatility 15%, range 15%
• Ranging regime (|TDFI| < 0.3): Volatility 35%, range 35%, RSI deviation 15%, BB position 15%
• Transition zones: linear interpolation between the two weight sets
Normalization Approach:
Each VPI/TDFI component is rescaled using rolling percentile rank over 100-bar window:
• Value at 100th percentile (highest) → 1.0
• Value at 0th percentile (lowest) → 0.0
• Current value → percentile position between 0-1
This makes the indicator adaptive to changing volatility and comparable across instruments.
Divergence Amplitude Measurement:
When a divergence is detected, its strength is quantified as:
Amplitude = (price_pivot_delta / ATR) × (indicator_pivot_delta / indicator_stddev)
Where:
• price_pivot_delta = distance between current and previous pivot
• indicator_pivot_delta = distance between indicator values at those pivots
• ATR and stddev provide normalization
Larger amplitude → larger bonus/penalty to Score (up to ±0.3 maximum).
Decay Function:
Divergence bonus decays linearly: Bonus(t) = Initial_Bonus × (1 - t/15), where t is bars since divergence. After 15 bars, bonus reaches zero. This ensures recent divergences dominate the Score.
Why This Design:
This architecture creates a system where:
• Components adapt to market regime automatically
• Signals are normalized across timeframes and instruments
• Multiple divergences create amplification (bonuses stack)
• Stale signals fade out naturally
This is fundamentally different from displaying RSI + Bollinger + MA separately, as the unified Score cannot be replicated by visual inspection alone.
━━━━━━━━━━━━━━━━━━━━━━━━━━━━━━━━━━
SEQUENTIAL DIVERGENCE LABELS (v/t SYSTEM)
━━━━━━━━━━━━━━━━━━━━━━━━━━━━━━━━━━
Each divergence is tracked separately for VPI and TDFI:
v-series: VPI divergences (v1, v2, v3...)
t-series: TDFI divergences (t1, t2, t3...)
The counter increments each time a new divergence appears in the same direction (e.g., consecutive bearish divergences). When direction flips (bearish → bullish), counters reset to 1.
Why this matters:
• v1 or t1 = early warning, potentially premature
• v3 or v4 = late-stage exhaustion, higher probability of reversal
• v2t3 = double divergence with second VPI + third TDFI = strong confluence
Traders can filter signals by label:
• Aggressive: trade v1/t1
• Conservative: wait for v2+/t2+ or double divergences
━━━━━━━━━━━━━━━━━━━━━━━━━━━━━━━━━━
MULTI-TIMEFRAME FILTER
━━━━━━━━━━━━━━━━━━━━━━━━━━━━━━━━━━
The MTF filter analyzes a higher timeframe to determine if the current market structure supports the divergence signal.
Modes:
• Off: All divergences shown
• Reduce: Counter-trend divergences have their bonus reduced by 70% (visual indication: dimmed/gray markers)
• Block: Counter-trend divergences completely hidden
Logic:
If 1H shows bearish divergence but 4H is in strong uptrend (Score < -0.3), the 1H signal is likely premature. MTF filter prevents entering shorts against higher timeframe momentum.
This protects against:
• Catching falling knives in strong downtrends
• Shorting pullbacks in strong uptrends
• Low-probability mean-reversion attempts
━━━━━━━━━━━━━━━━━━━━━━━━━━━━━━━━━━
HOW TO USE RSS3
━━━━━━━━━━━━━━━━━━━━━━━━━━━━━━━━━━
Entry Setup:
1. Wait for divergence marker (green = bullish, red = bearish)
2. Check Score magnitude:
• |Score| > 0.5 = higher confidence
• |Score| > 0.8 = extreme zone
3. Check v/t label:
• v1/t1 = early (more risk, more reward potential)
• v2+/t2+ or double = late but more reliable
4. Optional: wait +2 bars for pivot confirmation
Exit Options:
• Conservative: opposite divergence appears
• Aggressive: Score crosses through 0 or opposite ±0.5 threshold
• Always use volatility-based stop (2-3× ATR)
Timeframe Recommendations:
• 5-15m: intraday (use MTF 1H-4H)
• 1-4H: swing trading (use MTF Daily-Weekly)
• Daily: position trading (use MTF Weekly-Monthly)
Complementary Tools:
RSS3 is a reversal timing engine, not a complete strategy. Combine with:
• Support/resistance for target zones
• Volume analysis for confirmation
• Trend filters for directional bias
━━━━━━━━━━━━━━━━━━━━━━━━━━━━━━━━━━
WHAT MAKES RSS3 ORIGINAL
━━━━━━━━━━━━━━━━━━━━━━━━━━━━━━━━━━
vs Traditional RSI Divergence:
• RSI divergence = binary yes/no
• RSS3 = quantified strength score with dual-source validation
vs MACD Divergence:
• MACD = single dimension (momentum)
• RSS3 = volatility pressure + trend force + MTF context
vs Bollinger + RSI mashup:
• Standard mashup = two separate signals
• RSS3 = unified scoring system where components interact through weighted bonuses
Unique features:
• Decay-weighted divergence bonuses (recent divergences matter more)
• Amplitude-sensitive scoring (stronger divergences = higher score impact)
• Sequential tracking (v/t labels show signal maturity)
• MTF-aware filtering (context-dependent signal validation)
• Closed-loop system (divergences → Score → priority weighting → signal)
━━━━━━━━━━━━━━━━━━━━━━━━━━━━━━━━━━
EXAMPLE INTERPRETATION
━━━━━━━━━━━━━━━━━━━━━━━━━━━━━━━━━━
Scenario: BTC 2H chart shows:
• Red triangle appears above price
• Label: v1 + t2
• Recent Score Value: 1
What this means:
• Second consecutive TDFI bearish divergence detected (t2)
• First VPI bearish divergence on same pivot (v1)
• Double divergence stacking → Score near maximum
• Market is in extreme overbought/overextended zone
• High probability of short-term reversal
Trading decision:
• Aggressive trader: short immediately with tight stop
• Conservative trader: wait for Score to drop below 0.5 or opposite divergence for exit
━━━━━━━━━━━━━━━━━━━━━━━━━━━━━━━━━━
CHART LEGEND
━━━━━━━━━━━━━━━━━━━━━━━━━━━━━━━━━━
The published chart shows:
• Green triangles below price = bullish divergences (v/t labels indicate sequence)
• Red triangles above price = bearish divergences
• Score line in lower panel = reversal strength from -1 to +1
• Colored clouds = pressure accumulation zones (optional display)
• Text annotations = example entry/exit points for educational purposes
━━━━━━━━━━━━━━━━━━━━━━━━━━━━━━━━━━
Disclaimer: All trading involves risk. This indicator does not guarantee profits. Always backtest and apply proper risk management.

Delta Aggregator - XWiseTradeReal-time delta and buy/sell volume label for the current candle.
Aggregates lower timeframe volume to show aggressive buying/selling activity directly on the chart via a clean label:
• Delta (Buy - Sell)
• Percentage
• Buy / Sell / Total volume
Features:
• Supports 1s to 15min lower timeframes
• Customizable label position
• No chart clutter — label only
Perfect for order flow traders who want key numbers at a glance.
More premium indicators and strategies coming soon at:
xwisetrade.com
Be Wise. Trade X.

POC Simulator - XWiseTradeReal-time Point of Control (POC) for the current candle using lower timeframe volume data.
This indicator calculates the price level with the highest traded volume within the current bar (based on 1s to 15min data) — a dynamic approximation of the developing POC.
Features:
• Selectable lower timeframe source (1s, 15s, 1, 3, 5, 15min)
• Clean POC line + price label
• Lightweight and responsive
Perfect for intraday traders identifying developing value areas and potential support/resistance.
More premium indicators and strategies coming soon at:
xwisetrade.com
Be Wise. Trade X.
Estimated Volume - XWiseTradeReal-time projected volume for current and higher timeframes.
This indicator estimates the final volume of the current candle (and 3 selectable HTFs) based on elapsed time—perfect for spotting unusual activity early.
Features:
• Live estimated volume for current TF + 3 higher TFs
• Customizable table position
• Volume surge alert (when estimated volume exceeds previous candle by X%)
• Lightweight and accurate
Ideal for volume profile traders, breakout hunters, and anyone watching institutional activity.
More premium indicators and strategies coming soon at:
xwisetrade.com
Be Wise. Trade X.

WT + MACD Multi-Timeframe VisualWT + MACD Multi-Timeframe Visual is a technical analysis indicator that combines WaveTrend and MACD in a separate panel.
The script allows users to:
Visualize WaveTrend (WT1 and WT2).
Display the MACD using a selectable timeframe, independent from the chart timeframe.
Draw vertical lines when MACD crossovers are detected across multiple timeframes.
Important notes:
This indicator is a visual and educational tool and does not constitute financial advice.
The script uses multi-timeframe data through request.security().
Signals from higher timeframes may adjust while the higher timeframe candle is still forming.
lookahead_off is used to prevent the use of future data.
Users are encouraged to validate any analysis with proper market context and risk management.

AI Market Weather Forecast ProAI Market Weather Forecast Pro - Advanced Trading Indicator
Overview
AI Market Weather Forecast Pro is an innovative multi-timeframe trading system that uses global meteorological metaphors to visualize market conditions. By analyzing dimensional latitude regions, it transforms complex market data into intuitive global weather forecasts and temperature readings, helping traders quickly assess market sentiment and trend strength.
Core Features
🌍 Global Weather System
- Temperature Scale: -51°C to +51°C market temperature readings
- Weather Classifications: 9 distinct weather conditions from Freezing Cold to Scorching Heat
- Multi-Latitude Analysis: 5 climate zones representing different regional AI parameters
- Dynamic Temperature Engine: AI-powered algorithm calculates market "temperature" in real-time
- Trend Direction Indicator: Clear bullish/bearish/neutral classification
🌡️ Temperature-Based Signals
Hot Weather (Bullish Conditions):
- 🌡️ Scorching (35°C+): Strong Bull - Extreme bullish conditions
- ☀️ Hot (25°C-35°C): Bullish - Strong upward momentum
- 🌤️ Sunny (15°C-25°C): Mild Bull - Moderate bullish trend
- ⛅ Partly Cloudy (5°C-15°C): Weak Bull - Light bullish bias
Neutral Weather:
- ☁️ Overcast (-5°C to 5°C): Neutral - Consolidation/ranging market
Cold Weather (Bearish Conditions):
- 🌧️ Light Rain (-15°C to -5°C): Weak Bear - Light bearish bias
- 🌨️ Sleet (-25°C to -15°C): Mild Bear - Moderate bearish trend
- ❄️ Blizzard (-35°C to -25°C): Bearish - Strong downward momentum
- 🧊 Freezing Cold (-35°C-): Strong Bear - Extreme bearish conditions
📊 Five Latitude Climate Zones
Detects market conditions across 5 distinct "latitude zones", each representing progressively longer timeframes:
Each zone displays real-time weather status: ☀️ Clear (bullish), ❄️ Snow (bearish), or ☁️ Cloudy (neutral)
🎨 Advanced Visualization
Color-Coded Background:
- Orange/Yellow spectrum for bullish temperatures
- Gray for neutral conditions
- Blue spectrum for bearish temperatures
- Intensity increases with temperature extremes
Smart Weather Labels:
- Emoji-based weather icons for instant recognition
- Temperature readings in degrees
- Auto-positioned to avoid chart clutter
- Updates dynamically with trend changes
Comprehensive Weather Panel:
- Current weather condition
- Market temperature (°C)
- Trend direction classification
- Real-time status of all 5 latitude zones
- Current price and percentage change
Configuration Options
Display Settings
- Panel Position: 9 position options (corners, edges, center)
- Show Weather Panel: Toggle weather information panel on/off
- Show Background Color: Toggle background coloring on/off
- Show Weather Labels: Toggle weather labels on/off
- Background Display Days: Control how many days of coloring to display (1-30 days)
Alert System
Pre-configured alerts include:
- Weather Warming: Alert when temperature rises above 15°C
- Weather Cooling: Alert when temperature falls below -15°C
- Strong Trend Change: Alert when trend shifts to "Strong Bull" or "Strong Bear"
Information Panel Metrics
Real-time display includes:
- Current Weather: Visual weather condition with emoji
- Market Temperature: Numerical temperature reading (°C)
- Trend Direction: Clear classification (Strong Bull/Bullish/Mild Bull/Weak Bull/Neutral/Weak Bear/Mild Bear/Bearish/Strong Bear)
- Latitude Status: Weather conditions across all 5 climate zones
- Price & Change: Current price and percentage change
How to Interpret
Temperature Readings
- Above +25°C: Strong bullish conditions, consider long positions
- +15°C to +25°C*: Moderate bullish, good for trend following
- +5°C to +15°C: Mild bullish, cautious long bias
- -5°C to +5°C*: Neutral range, wait for clarity or range trade
- -15°C to -5°C: Mild bearish, cautious short bias
- -25°C to -15°C: Moderate bearish, good for short positions
- Below -25°C: Strong bearish conditions, consider short positions
Best Practices
1. Temperature Extremes: Focus on temperatures above +25°C or below -25°C for clear signals
2. Temperature Trend: Watch for rising/falling temperature trends, not just absolute values
3. Combine with Barometer*: Use alongside AI Market Barometer Pro for comprehensive analysis
4. Background Color: Quick visual assessment of overall market climate
Recommended Timeframes
- Scalping: 1-minute charts
- *Day Trading: 5-minute, 15-minute charts
Technical Requirements
- TradingView Pro, Pro+, or Premium account (required for multi-timeframe functionality)
- Compatible with all markets: Forex, Crypto, Stocks, Indices, Commodities
- Works on all timeframes from 1-minute to Monthly
Disclaimer
This indicator is a tool to assist with trading decisions. Past performance does not guarantee future results. Trading involves substantial risk of loss. Always use proper risk management and never risk more than you can afford to lose. The AI algorithms and temperature calculations are based on historical price patterns and technical analysis, not predictive guarantees.
What Makes This Different?
Unlike traditional indicators, AI Market Weather Forecast Pro:
- ✅ Uses intuitive meteorological metaphors for instant comprehension
- ✅ Analyzes multiple timeframe combinations simultaneously
- ✅ Calculates dynamic market "temperature" readings
- ✅ Provides 5-zone latitude system for confirmation
- ✅ Offers clear visual weather classifications
- ✅ Features unique temperature-based trend strength measurement
- ✅ Complements AI Market Barometer Pro for complete market analysis
Transform complex multi-timeframe analysis into simple weather forecasts. Know the market climate before you trade.
Perfect Companion to AI Market Barometer Pro
When used together with AI Market Barometer Pro:
- Barometer provides directional signals with AI confidence scores
- Weather provides overall market climate and temperature readings
- Combined gives you both precise entry signals AND broader market context
- Result: More informed trading decisions with better timing
© 2024 AI Market Weather Forecast Pro. All rights reserved. Proprietary algorithms and methodologies protected.

Market Pressure Delta ProMarket Pressure Delta Pro is an analytical indicator designed to quantify the hidden "Determination" behind every price move. While traditional indicators focus on where the price is, this engine focuses on the conviction behind the move. It operates on the theory of Institutional Exhaustion. It observes the balance of power during the formation of a trend to determine if a move is backed by genuine intent or if it is merely a low-conviction spike.
