Chonky Initial Balance (crypto)Plots the Initial Balance for crypto assets.
I use it for XBTUSD specifically.
The Initial Balance range is an area watched by Market/Volume Profile traders.
The idea behind it is that participants will start the day with a premeditated bias towards the market, and this is the first glimpse into how the rest of the day may unfold.
Access: DM me and I will consider granting access
Levels

Areas of Support/Resistance & BreakoutA pretty little indicator showing pivotal breakouts - that is, locating critical pivot points within price action, connecting the dots and trading the breakouts from this area!
-----------
Useful for finding good entry levels, exit levels, areas of strong support/resistance and most importantly - the Breakout!
Includes "Bars to the Left" variable so you can shorten or lengthen the indicator as required.
Good Luck and Happy Trading!

gannsquareof9chart2This Indicator works on W.D.Gann Square of 9 chart
gann works on SQUARES: ODD and EVEN
HIGH and LOW of this chart will be the " SQUARES "
this chart provides 7 major and 8 minor levels in between the ODD or EVEN Squares .
major levels are colored in blue and white respectively.
minor levels are colored in olive .
better visibility in dark background
change the color of the levels according to your requirement.
Once the HIGH or LOW (or SQUARES) breaks The next ODD or EVEN SQUARES open up ,
As the breakout of Squares happens the chart expands and acquire the new HIGH or LOW.
I have given Three different resolution option user can switch between:
DAILY ; WEEKLY ; MONTHLY .
thankyou

Chonky ATR LevelsChoose any custom ATR settings (smoothing, period, time frame, lookback)
and project daily high/low with current daily high/low values

[e2] Fibonacci slicerFibonacci slicer function.
The script is a simple calculator that accepts any 2 input values and divides the distance between those values using Fibonacci proportions.
- Easy for script integration (lines 21-35).
- The function accepts any 2 values and their order doesn't matter.
- Correctly divides negative-negative, negative-positive, positive-negative and positive-positive values.
- Calculates 7 levels derived from the Golden ratio (1.618033).

NSDT Colored Support And Resistance ZonesScript that allows you to plot four (4) different support/resistance zones. The zones will change color whether the candle is over or under or within the zone area. All options can be modified. Tip: If you want eight (8) zones, just load the indicator twice.

RSI LevelsRSI Levels
- The relative strength index ( RSI ) is a technical indicator used in the analysis of financial markets.
It is intended to chart the current and historical strength or weakness of a stock or market based on the closing prices of a recent trading period.
- This indicator allows us to visualize the levels of rsi in the chart, so that we can calculate take profit and stop points in a simple way,
knowing what position the price is currently in relation to these levels and how much space we have.
- We can also visualize the slope of the three levels of rsi , overbought, oversold and level 50, something that is not possible in the oscillator version.
- It allows you to display 2 rsi values at the same time.
- Allows to change the color of candlesticks based on rsi.

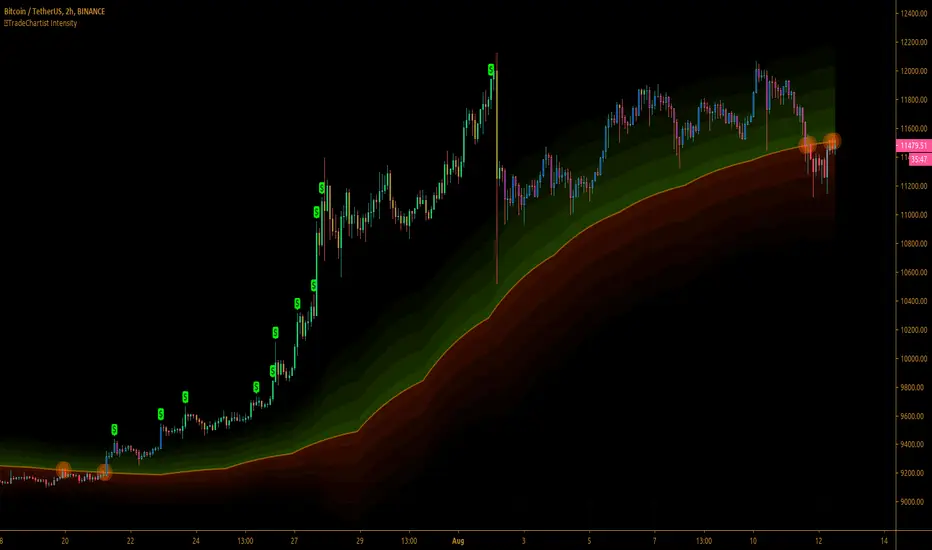
™TradeChartist Intensity™TradeChartist Intensity is a visual indicator that comes with Intensity color candles and Auto-fibs feature that helps any trader with Entry/Exit and levels confirmation based on where the price is, in relation to the Orange Price Equilibrium line and the 5 zones of Bull/Bear limits that fade into the top or bottom outer space.
™TradeChartist Intensity itself doesn't plot BUY or SELL signals, but when used with ™TradeChartist Rubicon gives a better picture for trade confirmations. It can also be used as a standalone indicator and works equally effective with other traditional and non-traditional indicators.
The indicator comes with simple settings with useful features outlined below.
Intensity Color Candles
Intensity Color Candles when activated from settings paints the candles/bars with colors specific to the Bull/Bear limits or the outer space and is easy to identify the signal strength over time.
Uptrend - The bars/candles move away from the Orange Price Equilibrium line towards the upper Bull limits with bar color fading slowly leading to outer space where the bar color turns neon green.
Downtrend - The bars/candles move away from the Orange Price Equilibrium line towards the lower Bear limits with bar color fading slowly leading to outer space where the bar color turns neon red.
When the price candle wick or body touches the Orange Price Equilibrium line, distinct torchlight circle appears to signal the trader of a potential change in price direction which can be used as a signal confirmation in conjunction with another indicator before taking a trade position.
Show Auto Fib Levels
Auto Fib Levels plot automatic Fib levels based on significant Highs and Lows based on Intensity strategy which mostly are reference prices of recent highest high above Orange Equilibrium price line and recent lowest low below the Orange Equilibrium price line.
15m XBT chart with 'Show Auto Fib Levels' checked and 'Show Fibs from current High/Low' unchecked under indicator settings
These Auto Fib Levels change when the price movement/trend changes direction and will be based on trending price direction.
Show Fibs from current High/Low
When this option is chosen from indicator settings, the auto fib levels are drawn from the highest high of the trending price direction to lowest low of last trend for uptrend or vice-versa for downtrend.
15m XBT chart as above with 'Show Fibs from current High/Low' unchecked under indicator settings
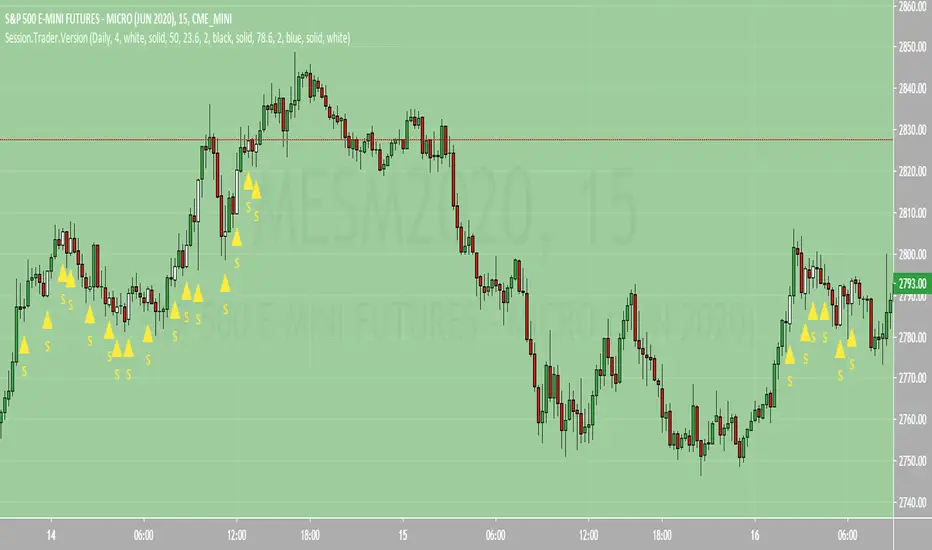
Show Profit Candles
Activating this option from indicator settings will automatically plot $ labels above candle highs that hit important resistance levels during uptrend and candle lows that hit important support levels during downtrend. This will help traders take out profits during trades based on their personal profit goals and realistic trade targets based on momentum/RSI/volatility etc.
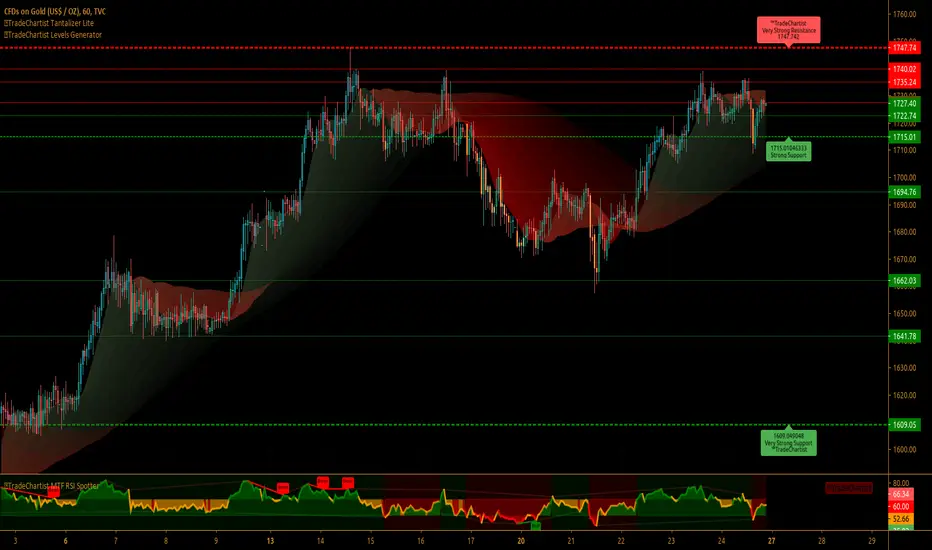
Example chart of XAUUSD 1hr Gold chart showing both Long and Short trade Profit candles
Give a thumbs up or leave a comment if you like the script.
™TradeChartist Levels Generator V4"™TradeChartist Levels Generator" is an easy to use script that can be used by traders of all levels from beginners to advanced professionals.
What does the script do?
Plots the support and resistance levels automatically based on user preference of Local levels of Lower or Higher Timeframe from indicator settings.
Plots Fibonacci retracement levels between high and low based on 'Days' or 'Candles' lookback from indicator settings.
The script proves to be very effective when used with another indicator for trend confirmation like the ribbon (not included in this script) shown on chart.
What markets can this script be used on?
Forex
Stocks
Commodities
Cryptocurrencies
and almost any asset on Trading View
What is the difference between "Plot Levels" and "Plot Fibonacci Levels"?
"Plot Levels" plots support and resistance levels automatically without any input from the user other than preferred levels 'plot' from the indicator settings namely
Plot Local Levels for Higher TF - Plots all important Support/Resistance levels for mostly higher time frames (1hr or higher) - Short to Mid term outlook
Plot Local Levels for Lower TF - Plots all important Support/Resistance levels for mostly smaller time frames (can be used for up to 1hr in most cases) -
Recommended for Scalping/Swing Trading mostly dependent on volatility
"Plot Fibonacci Levels" plots all standard Fibonacci retracement levels - 0, 23.6%, 38.2%, 50%, 61.8%, 78.6% and 100% based on
"Days" Lookback - Fibonacci levels between High and Low based on number of days in the past, starting from the current day on any time frame chart
"Candles" Lookback - Fibonacci levels between High and Low based on number of candles in the past, starting from the current candle on any time frame chart
Can the Fibonacci levels be reversed?
Yes. The Fibonacci levels can be reversed by checking the "Reverse" checkbox from the indicator settings. This is very handy if the trend looks like there may be a support or resistance from one of the Fib levels and a possibility of a new high or a new low based on the price action.
What is the need for "Plot 1.272 Fibonacci Level" under "Plot Fibonacci Levels"?
1.272 is an important Fibonacci number as it is the square root of 1.618 and is the near support or resistance after 100% price retracement. Even though it keeps moving on the chart dependent on the new high or new low based on Days/Candles lookback, it serves as a 'nice to have' reference for any trader looking beyond 100% retracement for support/resistance .
Why do the 'local levels' lines' color changes between green and red?
The nearby levels lines change color based on price closing above or below them. This happens to only closest local levels for lower TF near price action and for top/bottom lines of the local levels for higher TF.
The line turns green when it becomes support as price closes above it.
The line turns red when it becomes resistance as price closes below it.
This is a free to use indicator. Give a thumbs up or leave a comment if you like the script.
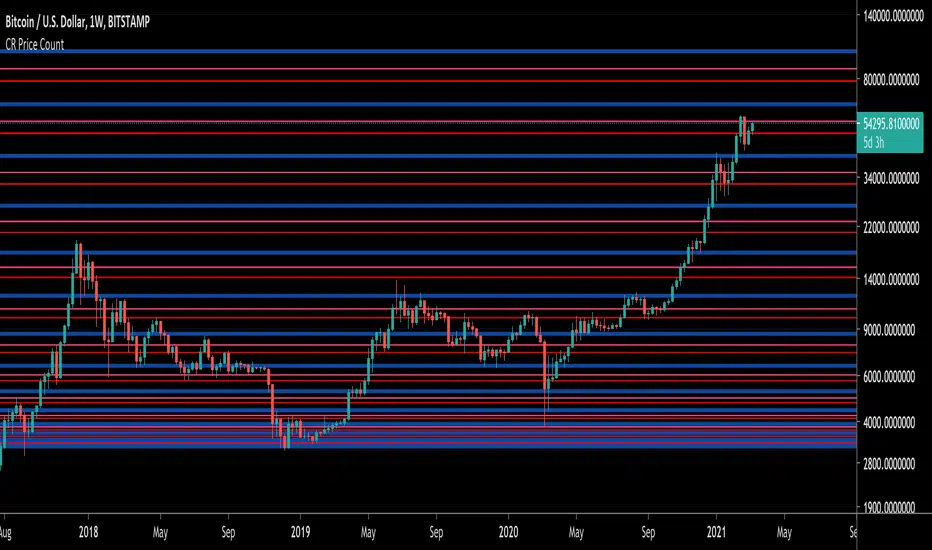
CR Price CountThis indicator calculates previous and upcoming S/R levels to predict potential targets and pivot points.
PipSniperThis is a script that trades a variety of instruments and can be configured for day trading stock index futures or swing trading FX pairs. The script focuses on the retrace trade using a proprietary Fibonacci setting to help identify the resumption of the trend. The script uses a variety of visual cues to identify trade signals quickly and efficiently. It's part of BK Forex member script library
cPOC [Plot]This is a point of control script based between the length of two different conditions and the last time they were true (barssince() or whatever)
Been wanting to make this for a while simply because volume doesn't care about time, so why would a session based POC matter with that logic mind?
Will be improving on this more in time, just happy with the results of this prototype for now and figured it may be the first script I've ever made people will find useful so why not release it
This is the plots version (utilizing plot() instead of line.new) for longer lines and for the color change. Laggy if utilizing all the levels but my preferred version.
P.S. Thanks, Showerhead. You're finally cool

cPOC [Line]This is a point of control script based between the length of two different conditions and the last time they were true (barssince() or whatever)
Been wanting to make this for a while simply because volume doesn't care about time, so why would a session based POC matter with that logic mind?
Will be improving on this more in time, just happy with the results of this prototype for now and figured it may be the first script I've ever made people will find useful so why not release it
This is the lines version (utilizing line.new instead of plot()) for people who want a less laggy chart. Sacrifices the color flip for minimal lag and lines are much shorter.
P.S. Thanks, @paaax for the color switcher

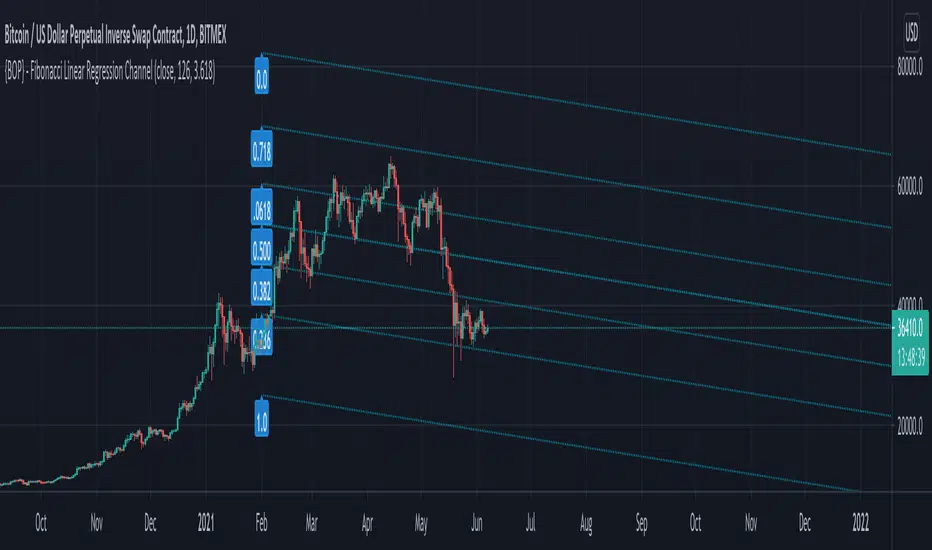
{BOP} - Fibonacci Linear Regression ChannelHere is a test model of a fibonacci linear regression channel. Have fun.
[RS][V4]ZigZag Percent Reversal - Helper - Retrace LevelsA helper script with multiple retrace level options.

Auto-fibsAutomatically plots Fibonacci Retracement levels.
Uses the all time high (ATH) for a specified number of days back, and the lowest value since the ATH, to plot the levels.

Previous Day Week Highs & LowsThis script plots the previous n day and week highs and lows (previous two days and previous week by default).
Here are some additional info about the script behavior:
Plots highs and/or lows
Plots for days and/or weeks
Day highs and lows are shown only on intraday timeframes
Week highs and lows are shown only on timeframes < weekly
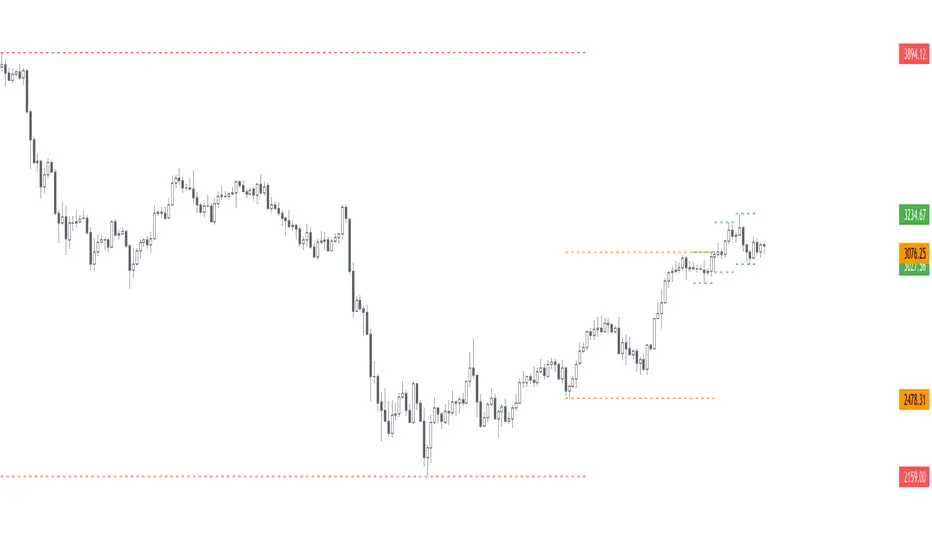
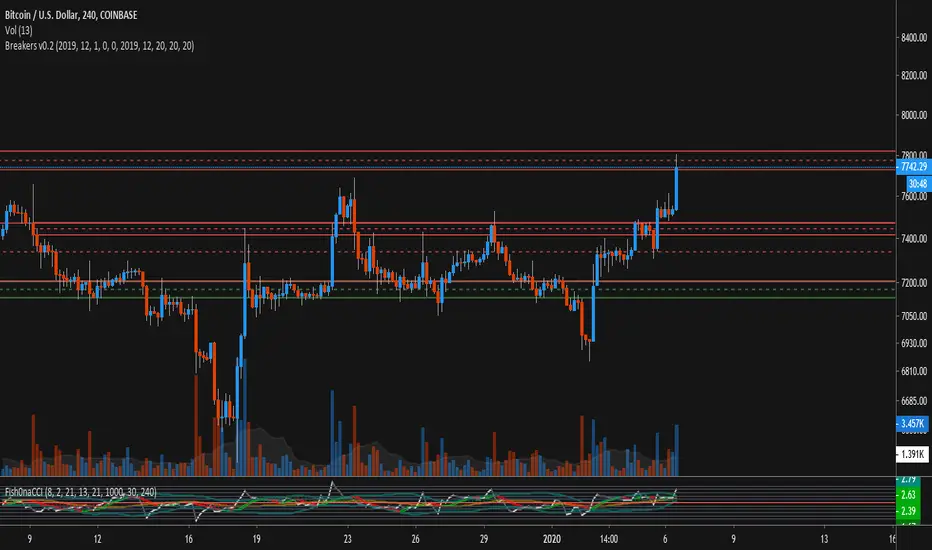
bg_Breakers_orderBlocks_detection (Breakers)Version 0.1
Using Pivots / Swing Point detection, this script plots the final swing candle's body span from top to bottom with an extended horizontal line, with a mid-channel point at 50% between open and close.
Once the trend changes, these zones serve as support and resistance zones, and can help identify breakouts from ranges and probable reversal points moving forward.
To avoid clutter, the script allows you to select a specific date-range (start / end date) which the rule will only apply and plot for.
Other customizable options are the length in bars of the pivot/swing point detection, which is defaulted at 20 bars for both highs and lows.
Works best on time-frames 4H, 1D, etc. with some luck to be had in occasionally shorter time-frames as shown above.
4H:
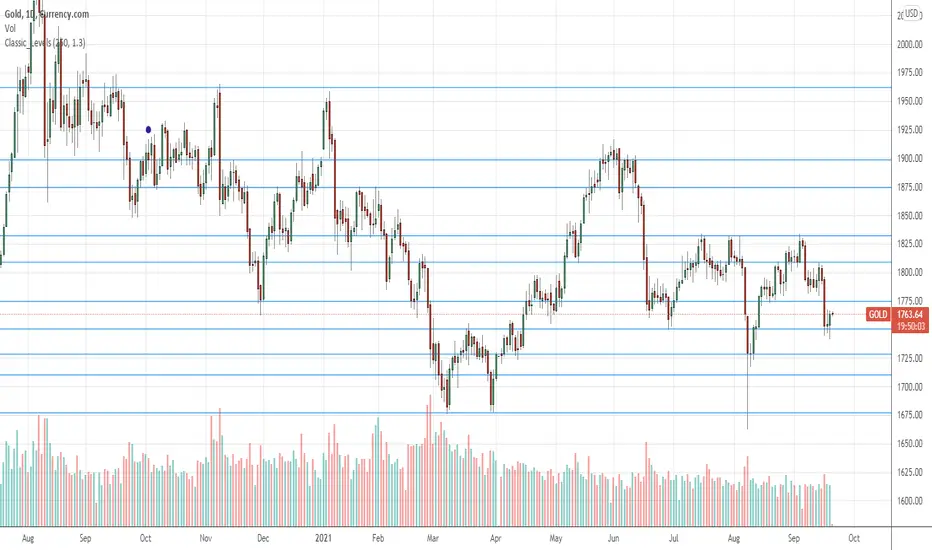
Classic_LevelsDisplays horizontal lines that represent support and resistance levels.
You can use it with any symbol and on any timeframe.
Parameter 'Time range' means number of candles in consideration. The beginning of the range is marked with a little violet circle.
The more 'Sensitivity' is, the more levels are displayed.
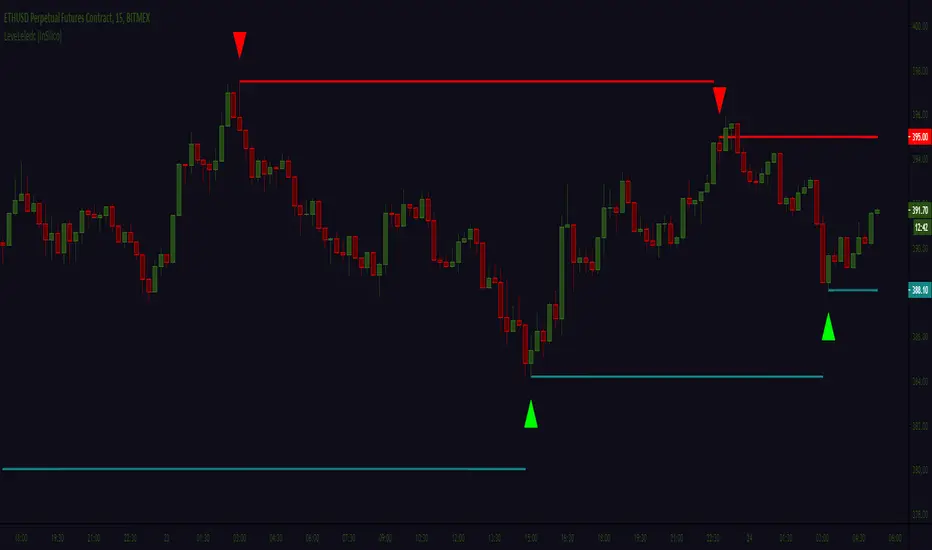
Leledc levels (IS) LeveLeledc - Exhaustion levels (InSilico)
Method for zero confirmation support/resistance level detection using Leledc Exhaustion Bars
Study is extension/mod of glaz script ,its implementing simple but unorthodox use-case for "Leledc Exhaustion Bars"
More information on core function in source scripts page ->
P.s Written quickly and spontaneously
BB-levels_MTFThis indicator draws Bollinger Bands- levels from higher timeframes on the chart's right border as a horizontal support/resistance lines. BB(20)- levels are shown from timeframes MN, 2W, 1W, 1D, 4H and 1H.
Levels are shown both for Standard Deviation 1 (dotted BB25- and BB75- lines) and STD 2 (solid BB0- and BB100- lines), as well as SMA20 (blue BB50- line).
You can choose if you want to see only the lines or the labels also. And you can modify the line's length and width, and the label's position on the screen also.

Simple EMA_Hull_RSI StrategyAnother simple strategy. Crossing EMA & Hull MA and the level of RSI (overbought/oversold) defines long or short.
Can be improved by varying the parameters and adding take profit / stop loss.
Backtest: ETHUSD (Bitmex): 5m

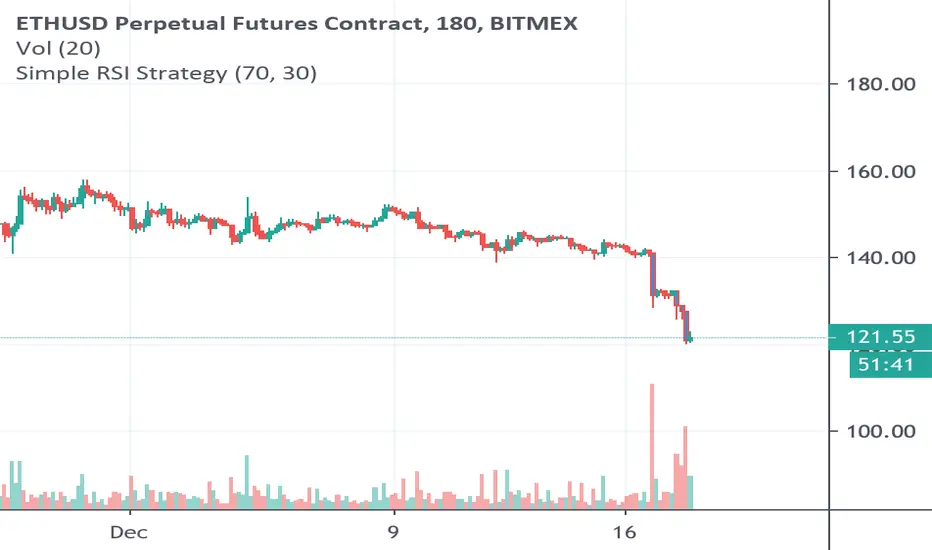
Simple RSI Strategy Buy/Sell at a certain levelSimple Strategy based on RSI, using overbought or oversold levels, defined by us, sell or buy an asset.
Backtest: ETHUSD (Bitmex) - 3h