Robust Cycle Measurement [Ehlers]The last of Ehlers Instantaneous Frequency Measurement methods.
This is a more robust version of this script.
I wrote it as a function, so you can simply copy and paste it into any script to add an adaptive period setting capability.
Cheers,
DasanC
Frequency
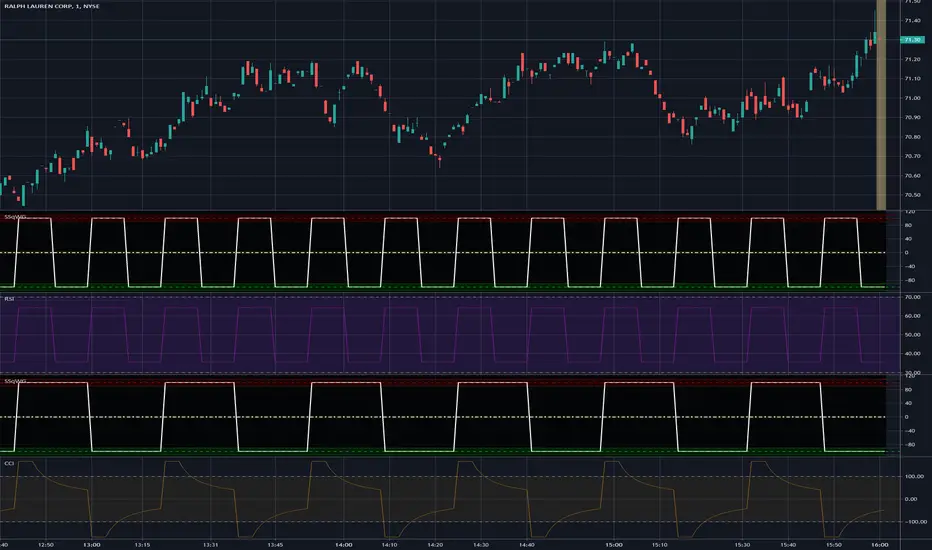
Simple Square Wave GeneratorThe title pretty much sums up what purpose this tool serves. It is NOT an indicator, just a simple square wave generator. I built this from scratch to test transient responses of filters I have devised to visually inspect the performance of smoothers, moving averages, lag, etc... I'm not sure if anyone may find it useful, but I figured you might be able to source the square wave TO another indicator as long as your indicator/filter you have has: price = input(close, "Source", source), plot(yourMovingAverageOrFilter(price, integerFromInput)). Look for the lowest "SSqWG" in your source selection. I coupled the built-in CCI and RSI to show how it's easily possible. Features include a "Wave Length (Bars)" setting in the "Format" panel, the square wave phase is shift-able to the left and the right, and there is also an amplitude adjustment as well. Let me know if you have any ideas on how you may personally use this if you wish to elaborate briefly. I would like to thank the entire TV development team for making the "Apply Indicator to" feature. That's some really cool tech for tethering indicator windows together, so we can now Frankenstein our scripts together while inspecting the different wave form results in separate windows. That's some revolutionary thinking, awesome job Tradingview DEV team!
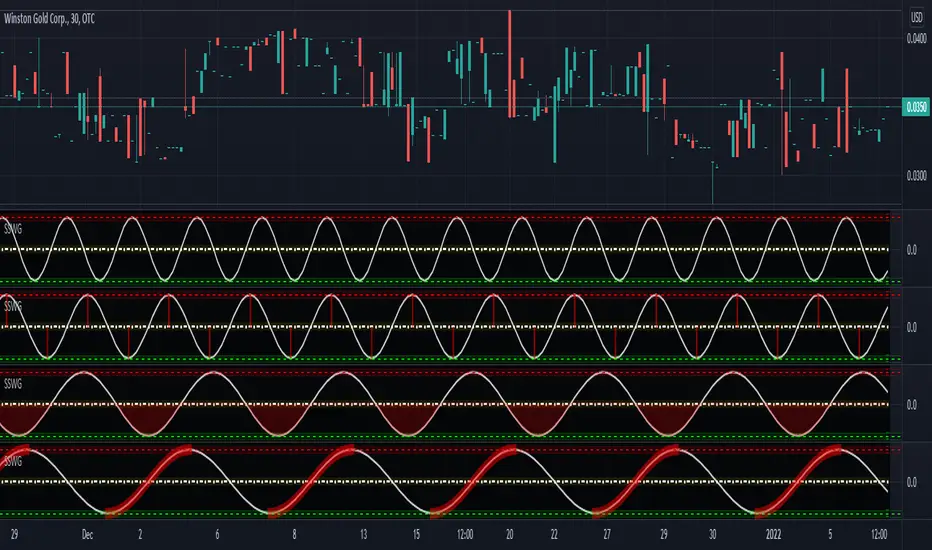
Simple Sine Wave GeneratorThe title pretty much sums up what purpose this tool serves. It is NOT an indicator, just a simple sine wave generator. You may use it to attempt to measure cycle periods occurring in the markets using "Wave Length (Bars)" setting in the "Format" panel. Other features include the sine wave phase is shift-able to the left and the right, and there is also an amplitude adjustment as well.
CMYK RYTHM ◊ Introduction
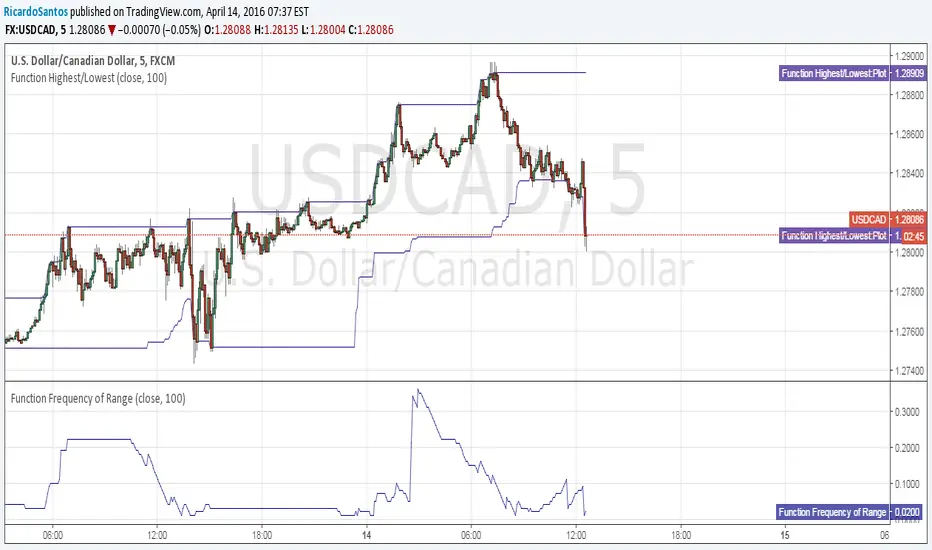
This script makes use of a sliding matrix, to search the highest/lowest point in the slider, it then counts the amount of times it was high/low, giving the distance from a previous high/low.
Every High/low are granted values, being a lower value for shorted periods, and a larger value for Longer periods.
This reveals the different period lengths of active frequencies.
Doing this with different slider lenghts would result in measuring with different mean period lenghts.
◊ Origin
From my dream last night.
This is a part of Project XIAM.
◊ Theoretical Approach
Philosophy β :: Rythmic
Searching for the period lenght of several frequencys at once.
◊ Usage
This is an alalythical tool, to be used for Automatically adjusting settings on Indicators that presume a period length for calculation.
Calculations are based on Past values, and no reversal measures or fail-safes are applied, so it will only be useful during a continuation of trend.
◊ Features
Matrix Calculation of Lowest/Highest points in a sliding series with Steady Length.
In the future Several slider lenghts will be applied to search for Frequencies of different magnitudes.
Lenght between TOPS, DIPS , and an SMA that smoothens this.
BIAS Is TOP to DIP Minus DIP to TOP, to uncover Bullish/Bearish index of market movements.
◊ Community
CMYK :: discord.gg
AUTOVIEW :: discordapp.com
TRADINGVIEW UNOFFICIAL :: discord.gg
Should I FOMO??Should I FOMO?? (number of revisited candles in a timeframe)
=============================================================
idea: hecate
I fomo way too much so i have created this little indicator to show me how many times (PERCENT) a candle is revisited in a period P
with the idea that i should not panic and maybe just wait patiently for a better price.
Just set the period P to your desired timeframe, days hours, whatever and WAIT patiently because many times it does come back :D and many times !!

Function Frequency of RangeFunction to derive the frequency a range is visited over time.
returns value (0 to 1) percent multiplier