TradeChartist Catalyst™TradeChartist Catalyst is an elegant script that combines Catalyst Trade Bands and automatic ZigZag/Fibonacci plots using an original logic to help users interact in a visually engaging and meaningful way with the charts.
===================================================================================================================
™TradeChartist Catalyst features
=============================
1. Catalyst Trade Bands
Catalyst Trade Bands comprises Equilibrium or Mean Bands, Inner Bands, Outer Bands and a Overall Mean Line. Catalyst Trade Bands help visualize the price action in relation to the Equilibrium Bands and clearly show how far away from the mean the current price is. The Trade Bands are of two types - Normal and Weighted. Weighted Bands are very sensitive to price action and a higher Bands length is recommended.
Simple 144 vs Weighted 144 Trade Bands
2. Equilibrium Touch Points
Every time the price touches the Equilibrium, an orange touch point appears on the chart. Normally, the Equilibrium line, for an optimal sample, acts as support or resistance. Price breaching or failing this line usually signals a Pull Back, a Throw Back or a Trend Change based on how the price interacts with it. This can be used with a secondary confirmation like RSI, Stochastic etc. For example, if the price falls back significantly only to touch the Equilibrium Line and fails to test the Overall Mean Line when Stochastic is below 30, this could mean a strong Pull Back rather than a Trend Change as shown in the example chart below.
When price fails the Equilibrium Bands, the fill colour of the Equilibrium bands changes to Bearish colour. If the Overall Mean line is below the Equilibrium bands and is in a reasonable distance, Mean will act as support as shown in the example below. Price failing the mean will test Inner Bands and strong bear momentum could take price to Outer Bands and beyond.
All the components of the Catalyst Trade Bands including the Touch Points can be enabled or disabled from the settings.
3. ZigZag & Fibonacci
Catalyst automatically plots ZigZag and Auto Fibonacci Retracement based on an intelligent logic and can be tweaked by changing the Zigzag & Auto-Fibs Factor from the settings. It also plots Fib ratios and connectors along with price highs and lows of ZigZag. The ratios can be especially useful to visually detect harmonic patterns and also serves as a useful feature for Fibonacci traders.
4. Fibonacci Customisation
Catalyst users can customise Fibonacci type and levels, including levels colour from Catalyst settings. In addition to Auto-Fibs, users can also plot Fibonacci levels based on Days or Candles lookback. This is a very useful feature if the user wants to override Auto-Fibs to suit his/her needs. Users can also reverse the Fibonacci Levels by enabling Reverse from settings.
In the following example chart of OANDA:USDCAD , Fibonacci levels based on 10 days lookback is plotted.
===================================================================================================================
Best Practice: Test with different settings first using Paper Trades before trading with real money
===================================================================================================================
Equilibrium
TradeChartist Trend Splitter ™TradeChartist Trend Splitter is a visual Trend spotting script based on two simple models fused together - Dynamic Volatility Bands and Dynamic Mean Bands. The fusion of these two models based on user defined parameters of length, Volatility Risk and Mean Bands type, along with optional Trend Splitter color bars and Trend background split will make it visually engaging for any trader to understand the price action.
===================================================================================================================
Trend Splitter User Manual
========================
Trend Splitter settings has option to enable and disable the Volatility Bands and also the Mean Bands.
Under each heading, user can adjust the parameters to suit the trading style, based on time-frame traded.
Volatility Bands track the price action based on volatility trend lookback (Default - 55, MIn - 5, Max - 337) and also uses a Detector plot based on user defined risk (Default is 2.618, Min - 0.618, Max - 5) to continuously track the price action.
Mean Bands track the Mean values of the price action based on TradeChartist's original Mean Reversion Model based on one of 4 time tested Fib Lengths (Default - 55, Options - 55, 89, 144, 233, 337) and detects the price testing of Mean using Orange touchpoints.
Using Price Action in relation to both Volatility Bands and the Mean Bands, the script creates Mean Bands filtered Trend splits that plot Bull or Bear Trend background.
The Mean Bands Filter can be disabled for Trend Splits by just disabling Mean Bands from the settings. Also the option to display Trend Split background can also be enabled or disabled from the settings.
The settings also includes a useful feature to enable or disable coloured price bars using one of 3 colour themes.
Users can create alerts for Price testing mean, Bull and Bear trends using Long or Short from Trend Splitter's Alert Condition.
The indicator doesn't repaint even though a potential repaint warning appears when creating alerts. This can be confirmed by doing bar replay with vertical lines at various lines and trend change zones to get confidence using the indicator. The vertical lines will stay in the same place on both current time and when running a bar replay.
===================================================================================================================
Example Charts
1. 5m chart of BINANCE:AXSUSDTPERP using Trend Splitter (144, 2.618, Normal, 55) and TradeChartist Momentum Drift Oscillator (144 with Drift Visualizer). The Trend Splitter and MDO combo work brilliantly on Lower Time Frames and even on 15s/30s charts with MDO length of 144.
Best Practice - Always wait for a very long trend (over 337 bars on both MDO and Trend Splitter before taking a reverse trend trade at either Exhaustion or Super OB/OS zones of MDO) when using very low time-frames.
2. 5m chart of NYSE:PLTR using Trend Splitter (144, 3.618, Normal, 55) connected to TradeChartist Fib Master to plot Automatic Fibs. Just use Trend Identifier of Trend Splitter from Fib Master signal dropdown from settings, having both scripts active on chart.
3. Daily chart of OANDA:XAUUSD using Trend Splitter (using only Mean Bands - Weighted/144) to spot areas of support and resistance at Mean Bands.
Best Practice - Mean Bands can also act as confirmation indicator when used with other Trading View Indicators like RSI, Stohastic, Bollinger Bands etc.
4. Daily chart of COINBASE:ETHUSD using Trend Splitter (55, 0.618, Weighted, 55) connected to TradeChartist Plug and Trade to show Trend Splitter based Entries with Targets and Past Performance to assess the settings parameters in Trend Splitter. Just use Trend Identifier of Trend Splitter from Plug and Trade signal dropdown from settings, having both scripts active on chart.
===================================================================================================================
Best Practice: Test with different settings first using Paper Trades before trading with real money
===================================================================================================================

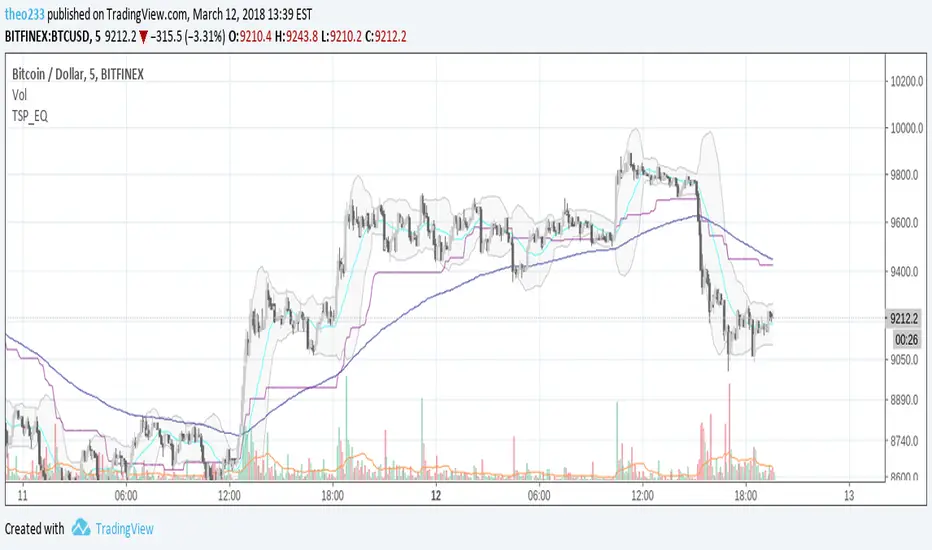
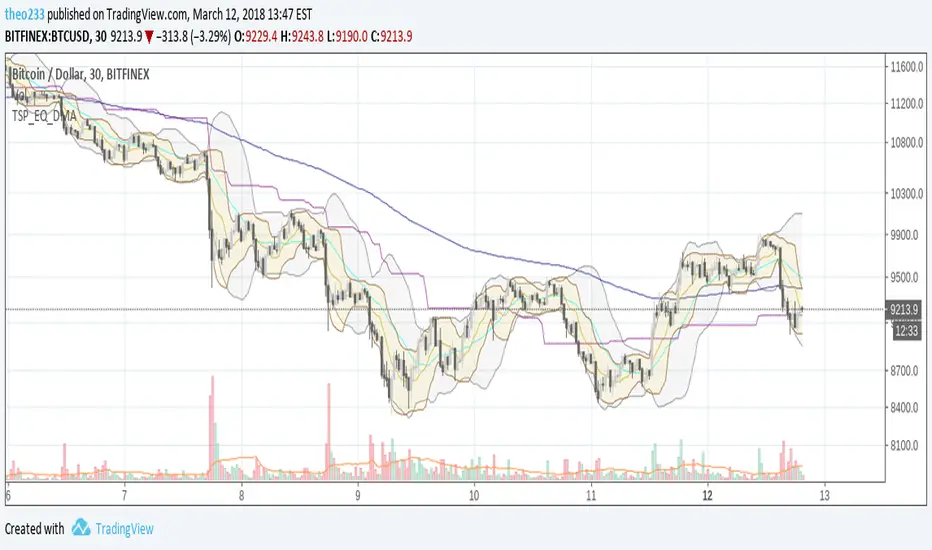
Equilibriums -- Based on Ichimoku Kinko HyoIntro:
Hello dear traders. Lately I have been studying Ichimoku for trading. Personaly I find myself in a long lasting quest of creating an automated trading strategy that works.
Let me tell you it aint easy. On this route I made countless of indicators some of which are worthless, others that have some potential. I did not publish these indicators as I do not want to bother people with sub par indicators that waste your time. My belief is strong and some day I will probably succeed in creating a working strategy.
About the indicator:
While researching Ichimoku Kinko Hyo (thanks chaostrader69 for providing such invaluable knowledge) I came across the numbers that define ichimoku. The Tenkan-sen and Kijun-sen lines and even the cloud are based on these numbers and create market equilibrium. The market always wants to return to this equilibrium. As a pine scripter and curious individual I made this indicator to expand the Tenkan and Kijun lines to more of these ichimoku number periods.
Ofcourse this creates a mess of an indicator especialy when combined with the real ichimoku which is already too much info to grasp and apply correctly for most traders. I can not recommend any strategy with this indicator and that is why I want to deliver this simple script to the public. Opinions and trading theorys regarding these lines are very welcome.
As you can see by the chart on the publication of this script the lines where nice and open and not crossing eachother in a clear uptrend. While when it was trading sideways the lines did not show direction at all and where close to eachother and crossing. Thx for taking the time to read this and possibly giving feedback. Feedback on the colors/line thickness is also welcome as I want my indicators to be beautiful!

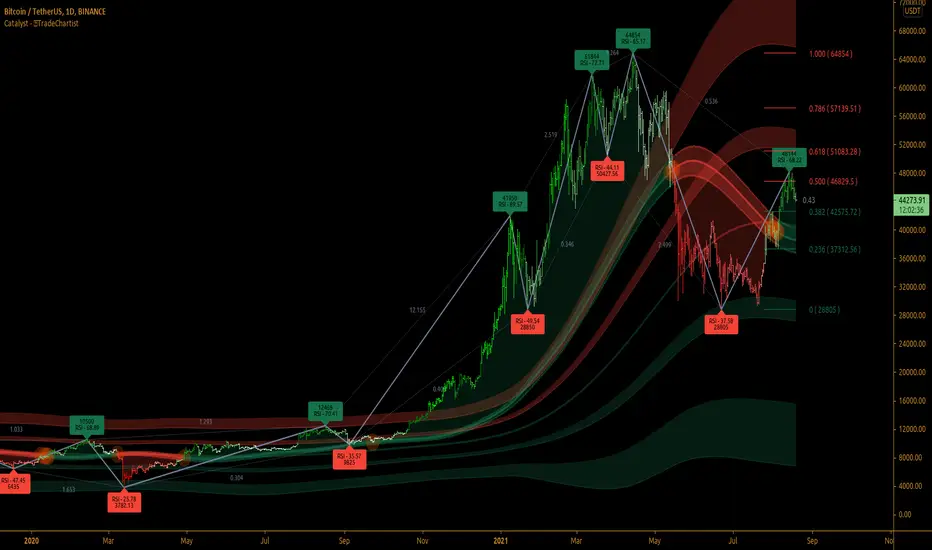
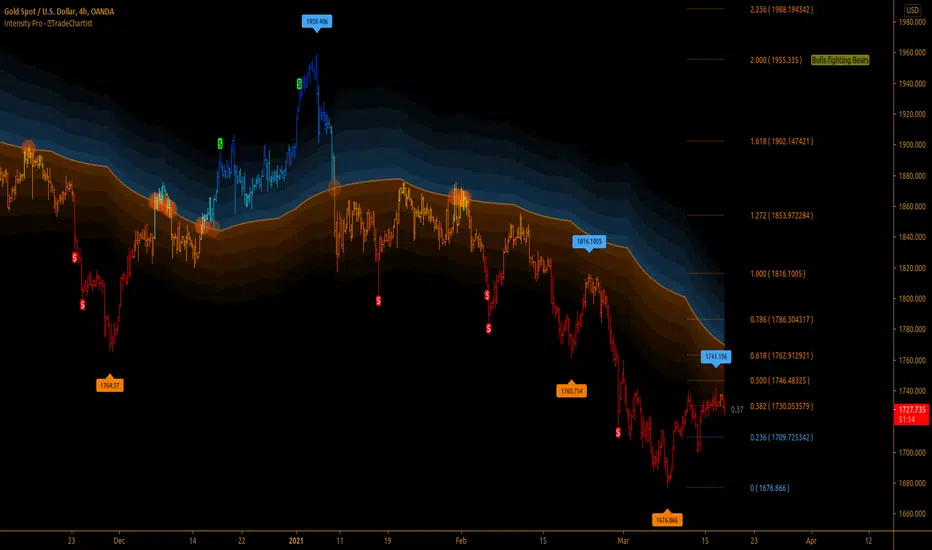
TradeChartist Intensity Pro™TradeChartist Intensity Pro is a visual indicator that comes with 5 Visual Themes and Auto-fibs feature that helps traders with Entry/Exit and levels confirmation based on where the price is, in relation to the Orange Price Equilibrium line and the 5 zones of Bull/Bear limits that fade into the top or bottom outer space.
™TradeChartist Intensity is an original Mean Reversion Model that requires no user input and Intensity Pro incorporates User adjustable Auto-Fibs and manual Fibonacci retracement feature and plots customisable Fib levels along with prices.
======================================================================================
Intensity Pro Features
Orange Mean Equilibrium Line
Bull and Bear Intensity Bands
5 Visual Themes
Trend based Bar Colours
Auto Fibonacci Levels
Custom Auto-Fib Levels
Fibonacci Levels based on Days or Bars Lookback
Current Fib Level label
High and Low Plots
Take Profit Bars
======================================================================================
Example Charts:
1. 4hr BTC-USDT
2. SPX Daily
3. EUR-USD 1hr
======================================================================================
Best Practice: Test with different settings first using Paper Trades before trading with real money
======================================================================================
This is not a free to use indicator. Get in touch with me (PM me directly if you would like trial access to test the indicator)
Premium Scripts - Trial access and Information
Trial access offered on all Premium scripts.
PM me directly to request trial access to the scripts or for more information.
======================================================================================
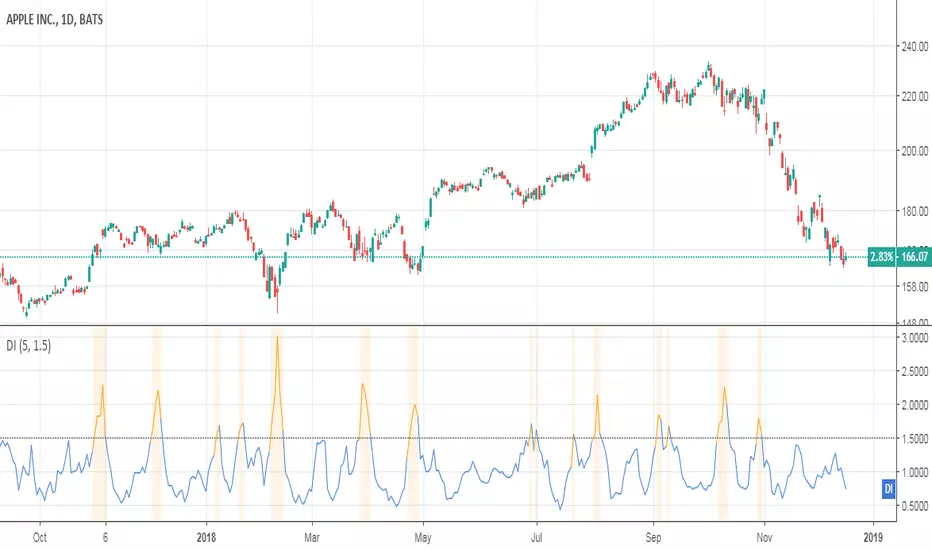
Damping IndexThis indicator was originally developed by Curtis McKallip Jr. (Stocks & Commodities, V.10:7 (296-299): "The Damping Index").
It indentifies bars where the highs and lows are getting close and closer. A high Damping Index value means that the difference between the high price and low price is becoming lower and the security price is reaching equilibrium. A low Damping Index value means that the difference between the high and low prices is increasing.
Good luck and happy trading!
Equil BB 20 + EMA 180 + Ret 90 + DonchianEMAMix of :
- Bollinger Bands (MA20)
- Donchian Average 90
- EMA 180
- Donchian EMA
Equil BB 20 + EMA 180 + Ret 90Mix of :
- Bollinger Bands (MA20)
- Donchian Average 90
- EMA 180
While MA20 is current period trend, EMA 180 is current period x5/6 trend