Price Extension from 8 EMAOverview
This indicator can be used to see how far away the price is from the 8 EMA. It compares this to the Average Daily Range % to see if the stock may be overextended. The "Extension Multiplier" represents how far the stock is extended away from the 8 EMA.
Core Concept
This indicator is best used for breakout trades that are trying to make sure they are not chasing the stock.
How to Use This Indicator
This tool is primarily intended for analyzing daily charts of individual stocks and is often used by breakout traders to evaluate potential entry areas.
If the stock is far away from the 8 EMA, it is likely not ready to break out. If it is close to the 8ema, it could be ready to move higher.
This indicator can also be used in the opposite way. For example, shorting or puts.
Understanding the colors
Green (Not Extended): Indicates the price is close to the 8 EMA. This often corresponds to periods of consolidation.
Yellow (Slightly Extended): The price is beginning to move away from the 8 EMA.
Orange (Extended): The price has moved a considerable distance from the 8 EMA.
Red (Very Extended): The price is at an extreme distance from the 8 EMA, historically increasing the likelihood of a pullback or consolidation.
Settings
Info Row Position: Adjusts the vertical position of the display table on the chart. Useful when using other indicators.
ADR Length: Sets the lookback period for calculating the Average Daily Range. Or the average range % for different timeframes.
Timeframe: Determines the timeframe for the EMA and ADR calculation (the default is Daily).
EMAS

Adaptive Cycle Oscillator with EMADescription of the Adaptive Cycle Oscillator with EMA Pine Script
This Pine Script, titled "Adaptive Cycle Oscillator with EMA", is a custom technical indicator designed for TradingView to help traders analyze market cycles and identify potential buy or sell opportunities. It combines an Adaptive Cycle Oscillator (ACO) with multiple Exponential Moving Averages (EMAs), displayed as colorful, wavy lines, and includes features like buy/sell signals and divergence detection. Below is a beginner-friendly explanation of how the script works, adhering to TradingView's Script Publishing Rules.
What This Indicator Does
The Adaptive Cycle Oscillator with EMA helps you:
Visualize market cycles using an oscillator that adapts to price movements.
Track trends with seven EMAs of different lengths, plotted as a rainbow of wavy lines.
Identify potential buy or sell signals when the oscillator crosses predefined thresholds.
Spot divergences between the oscillator and price to anticipate reversals.
Use customizable settings to adjust the indicator to your trading style.
Note: This is a technical analysis tool and does not guarantee profits. Always combine it with other analysis methods and practice risk management.
Step-by-Step Explanation for New Users
1. Understanding the Indicator
Adaptive Cycle Oscillator (ACO): The ACO analyzes price data (based on high, low, and close prices, or HLC3) to detect market cycles. It smooths price movements to create an oscillator that swings between overbought and oversold levels.
EMAs: Seven EMAs of different lengths are applied to the ACO and scaled based on the market's dominant cycle. These EMAs are plotted as colorful, wavy lines to show trend direction.
Buy/Sell Signals: The script generates signals when the ACO crosses above or below user-defined thresholds, indicating potential entry or exit points.
Divergence Detection: The script identifies bullish or bearish divergences between the ACO and the fastest EMA, which may signal potential reversals.
Visual Style: The indicator uses a rainbow of seven colors (red, orange, yellow, green, blue, indigo, violet) for the EMAs, with wavy lines for a unique visual effect. Static levels (zero, overbought, oversold) are also wavy for consistency.
2. How to Add the Indicator to Your Chart
Open TradingView and load the chart of any asset (e.g., stock, forex, crypto).
Click on the Indicators button at the top of the chart.
Search for "Adaptive Cycle Oscillator with EMA" (or paste the script into TradingView’s Pine Editor if you have access to it).
Click to add the indicator to your chart. It will appear in a separate panel below the price chart.
3. Customizing the Indicator
The script offers several input options to tailor it to your needs:
Base Cycle Length (Default: 20): Sets the initial period for calculating the dominant cycle. Higher values make the indicator slower; lower values make it more sensitive.
Alpha Smoothing (Default: 0.07): Controls how much the ACO smooths price data. Smaller values produce smoother results.
Show Buy/Sell Signals (Default: True): Toggle to display green triangles (buy) and red triangles (sell) on the chart.
Threshold (Default: 0.0): Defines overbought (above threshold) and oversold (below threshold) levels. Adjust to widen or narrow signal zones.
EMA Base Length (Default: 10): Sets the starting length for the fastest EMA. Other EMAs are incrementally longer (12, 14, 16, etc.).
Divergence Lookback (Default: 14): Determines how far back the script looks to detect divergences.
To adjust these:
Right-click the indicator on your chart and select Settings.
Modify the inputs in the pop-up window.
Click OK to apply changes.
4. Reading the Indicator
Oscillator and EMAs: The ACO and seven EMAs are plotted in a separate panel. The EMAs (colored lines) move in a wavy pattern:
Red (fastest) to Violet (slowest) represent different response speeds.
When the faster EMAs (e.g., red, orange) are above slower ones (e.g., blue, violet), it suggests bullish momentum, and vice versa.
Zero Line: A gray wavy line at zero acts as a neutral level. The ACO above zero indicates bullish conditions; below zero indicates bearish conditions.
Overbought/Oversold Lines: Red (overbought) and green (oversold) wavy lines mark threshold levels. Extreme ACO values near these lines may suggest reversals.
Buy/Sell Signals:
Green Triangle (Bottom): Appears when the ACO crosses above the oversold threshold, suggesting a potential buy.
Red Triangle (Top): Appears when the ACO crosses below the overbought threshold, suggesting a potential sell.
Divergences:
Green Triangle (Bottom): Indicates a bullish divergence (price makes a lower low, but the EMA makes a higher low), hinting at a potential upward reversal.
Red Triangle (Top): Indicates a bearish divergence (price makes a higher high, but the EMA makes a lower high), hinting at a potential downward reversal.
5. Using Alerts
You can set alerts for key events:
Right-click the indicator and select Add Alert.
Choose a condition (e.g., "ACO Buy Signal", "Bullish Divergence").
Configure the alert settings (e.g., notify via email, app, or pop-up).
Click Create to activate the alert.
Available alert conditions:
ACO Buy Signal: When the ACO crosses above the oversold threshold.
ACO Sell Signal: When the ACO crosses below the overbought threshold.
Bullish Divergence: When a potential upward reversal is detected.
Bearish Divergence: When a potential downward reversal is detected.
6. Tips for Using the Indicator
Combine with Other Tools: Use the indicator alongside support/resistance levels, candlestick patterns, or other indicators (e.g., RSI, MACD) for confirmation.
Test on Different Timeframes: The indicator works on any timeframe (e.g., 1-minute, daily). Shorter timeframes may produce more signals but with more noise.
Practice Risk Management: Never rely solely on this indicator. Set stop-losses and position sizes to manage risk.
Backtest First: Use TradingView’s Strategy Tester (if you convert the script to a strategy) to evaluate performance on historical data.
Compliance with TradingView’s Script Publishing Rules
This description adheres to TradingView’s Script Publishing Rules (as outlined in the provided link):
No Performance Claims: The description avoids promising profits or specific results, emphasizing that the indicator is a tool for analysis.
Clear Instructions: It provides step-by-step guidance for adding, customizing, and using the indicator.
Risk Disclaimer: It notes that trading involves risks and the indicator should be used with other analysis methods.
No Misleading Terms: Terms like “buy” and “sell” are used to describe signals, not guaranteed actions.
Transparency: The description explains the indicator’s components (ACO, EMAs, signals, divergences) without exaggerating its capabilities.
No External Links: The description avoids linking to external resources or soliciting users.
Educational Tone: It focuses on educating users about the indicator’s functionality.
Limitations
Not a Standalone System: The indicator is not a complete trading strategy. It provides insights but requires additional analysis.
Lagging Nature: As with most oscillators and EMAs, signals may lag behind price movements, especially in fast markets.
False Signals: Signals and divergences may not always lead to successful trades, particularly in choppy markets.
Market Dependency: Performance varies across assets and market conditions (e.g., trending vs. ranging markets).

Super MTF Clouds (4x3 Pairs)Overview:
This script is based on Ripster's MTF clouds, which transcends the standard moving average cloud indicator by offering a powerful and deeply customizable Multi-Timeframe (MTF) analysis. Instead of being limited to the moving averages of your current charts from the current timeframe, this tool allows you to project and visualize the trend and key support/resistance zones from up to 4 different timeframes simultaneously. User can input up to 6 different EMA values which will form 3 pairs of EMA clouds, for each of the timeframes.
The primary purpose is to provide traders with immediate confluence. By observing how price interacts with moving average clouds from higher timeframes (e.g., Hourly, Daily, Weekly), you can make more informed decisions on your active trading timeframe (e.g., 10 Minute). It's designed as a complete MTF Cloud toolkit, allowing you to display all necessary MTFs in a single script to build a comprehensive view of the market structure without having to flick to different timeframe to look for cloud positions.
Key features:
Four Independent Multi-Timeframe Slots: Each slot can be assigned any timeframe available on TradingView (e.g., D, W, M, 4H).
Three MA Pairs Per Timeframe: For each timeframe, configure up to three separate MA clouds (e.g., a 9/12 EMA pair, a 20/50 EMA pair, and a 100/200 SMA pair).
Complete Customisation: For every single moving average (24 in total), you can independently control:
MA Type: Choose between EMA or SMA.
Length: Any period you require.
Line Color: Full colour selection.
Line Thickness: Adjust the visual weight of each line.
Cloud Control: For every pair (12 in total), you can set the fill colour and transparency.
How To Use This Script:
This tool is best used for confirmation and context. Here are some practical strategies that one can adopt:
Trend Confluence: Before taking a trade based on a signal on your current timeframe, glance at the higher timeframe clouds. If you see a buy signal on the 15-minute chart and the price is currently trading above a thick, bullish Daily cloud, the probability of that trade succeeding is significantly higher. Conversely, shorting into strong HTF support is a low-probability trade.
Dynamic Support & Resistance: The edges of the higher timeframe clouds often act as powerful, dynamic levels of support and resistance. A pullback to the 4-Hour 50 EMA on your 15-minute chart can be a prime area to look for entries in the direction of the larger trend.
Gauging Market Regimes: Use the toggles in the settings to quickly switch between different views. You can have a "risk-on" view with short-term clouds and a "macro" view with weekly and monthly clouds. This helps you adapt your trading style to the current market conditions.
Key Settings:
1. Global Setting
Source For All MAs: This determines the price data point used for every single moving average calculation.
Default: hl2 (an average of the High and Low of each bar). This gives a smooth midpoint price.
Options: You can change this to Close (the most common method), Open, High, Low, or ohlc4 (an average of the open, high, low, and close), among others.
Recommendation: For most standard trend analysis, the default hl2 is the common choice.
2. The Timeframe Group Structure
The rest of the settings are organized into four identical, collapsible groups: "Timeframe 1 Settings" through "Timeframe 4 Settings". Each group acts as a self-contained control panel for one multi-timeframe view.
Within each timeframe group, you have two master controls:
Enable Timeframe: This is the main power switch for the entire group. Uncheck this box to instantly hide all three clouds and lines associated with this timeframe. This is perfect for quickly decluttering your chart or focusing on a different set of analyses.
Timeframe: This dropdown menu is the heart of the MTF feature. Here, you select the higher timeframe you want to analyse (e.g., 1D for Daily, 1W for Weekly, 4H for 4-Hour). All calculations for the three pairs within this group will be based on the timeframe you select here.
3. Pair-Specific Controls
Inside each timeframe group, there are three sections for "Pair 1", "Pair 2", and "Pair 3". These control each individual moving average cloud.
Enable Pair: Just like the master switch for the timeframe, this checkbox turns a single cloud and its two MA lines on or off.
For each pair, the settings are further broken down:
Moving Average Lines (A and B): These two rows control the two moving averages that form the cloud. 'A' is typically used for the shorter-period MA and 'B' for the longer-period one.
Type (A/B): A dropdown menu to select either EMA (Exponential Moving Average) or SMA (Simple Moving Average). EMAs react more quickly to recent price changes, while SMAs are smoother and react more slowly.
Length (A/B): The lookback period for the moving average (e.g., 21, 50, 200).
Color (A/B): Sets the specific colour of the MA line itself on your chart.
Cloud Fill Settings
Fill Color: This controls the colour of the shaded area (the "cloud") between the two moving average lines. For a consistent look, you can set this to the same colour as your shorter MA line.
Transparency: Controls how see-through the cloud is, on a scale of 0 to 100. 0 is a solid, opaque colour, while 100 is completely invisible. The default of 85 provides a light, "cloud-like" appearance that doesn't obscure the price action.
----------------------------------------------------------------------
If anything is not clear please let me know!

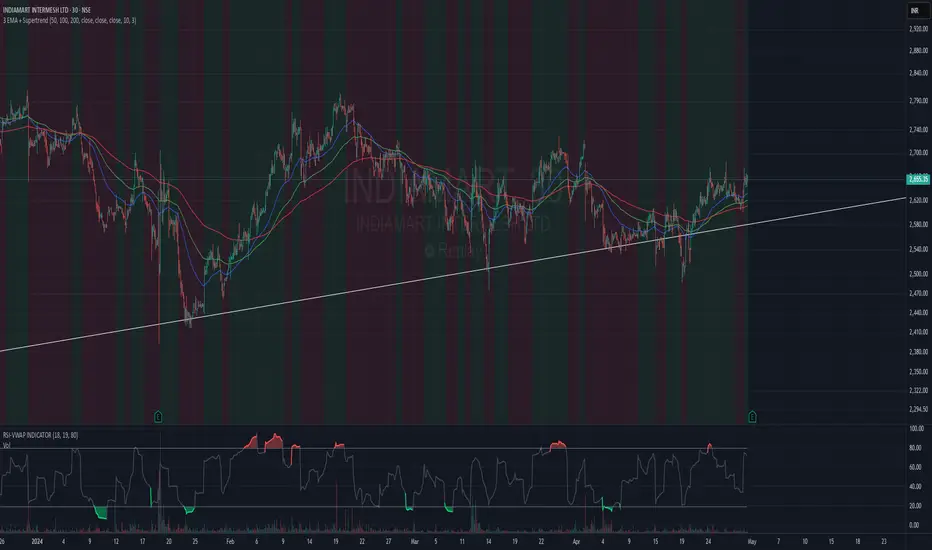
3 EMA + SupertrendThree EMAs: Helps you identify the general trend direction and potential crossovers.
When the Fast EMA crosses above the Medium or Slow EMAs, it may indicate a bullish trend, and vice versa for bearish trends.
Supertrend: Works as a trend filter. You can use it to identify overall market conditions:
When the Supertrend is green, it indicates an uptrend.
When the Supertrend is red, it indicates a downtrend.
Combination: The EMAs help you confirm the trend, and the Supertrend can act as a filter or confirmation tool for your entries and exits.
Potential Strategy Idea:
Long Entry: When the Fast EMA crosses above the Medium EMA, and the Supertrend is green.
Short Entry: When the Fast EMA crosses below the Medium EMA, and the Supertrend is red.
Exit: You can use either the Supertrend turning from green to red (for long exits) or vice versa.
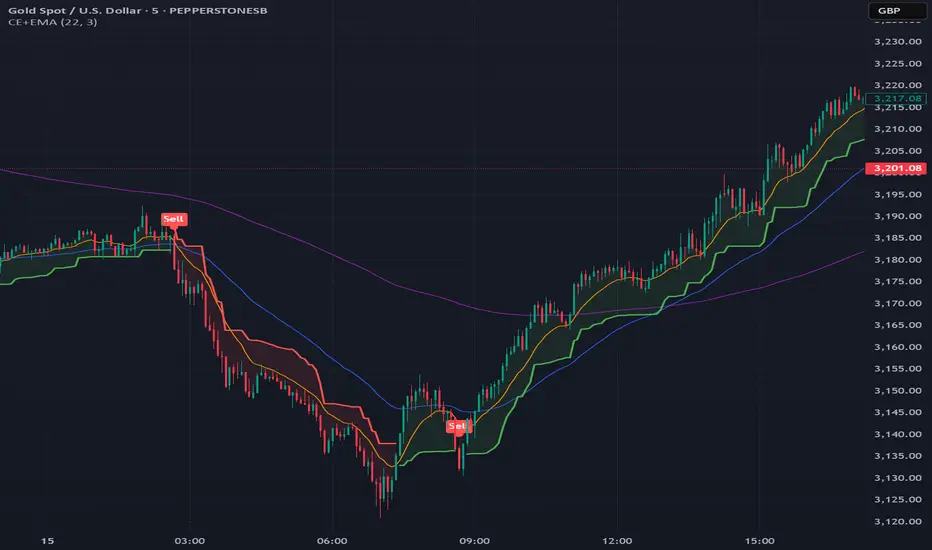
Chandelier Exit + EMA Filtered SignalsThis script is a powerful upgrade to the original Chandelier Exit by Alex Orekhov (everget), combining trend-following logic with higher-quality trade filtering.
✅ Key Features:
Chandelier Exit logic with ATR-based stop levels
Buy/Sell signals only when trend is confirmed:
Buy: Price must be above EMA 13, 50, and 200
Sell: Price must be below EMA 13, 50, and 200
Candle highlighting: Green for Buy, Red for Sell
Signal labels for visual clarity
Toggle to show/hide EMAs
Built-in alerts for:
Buy signal
Sell signal
Trend direction change
🛠️ Inputs:
ATR Period and Multiplier
Toggle: Use Close Price for High/Low Calculation
Toggle: Show/Hide Labels and State Highlight
Toggle: Show/Hide EMA 13, 50, 200
Toggle: Await confirmed bar for alerts
🔔 Alerts Included:
Chandelier Exit Buy
Chandelier Exit Sell
Direction Change (long to short or vice versa)
💡 How to Use:
Use on trending assets (e.g., Gold, Indices, Crypto).
Combine with support/resistance or session filters for optimal results.
Enable alerts to be notified on trade setups.
📢 Credits:
Based on the original Chandelier Exit script by everget.
Enhancements by AP Capital for filtered signals and better visual feedback.
HiLo EMA Custom bandsHILo Ema custom bands
This advanced technical indicator is a powerful variation of "HiLo Ema squeeze bands" that combines the best elements of Donchian channels and EMAs. It's specially designed to identify price squeezes before significant market moves while providing dynamic support/resistance levels and predictive price targets.
Indicator Concept:
The indicator initializes EMAs at each new high or low - the upper EMA tracks highs while the lower EMA tracks lows. It draws maximum of 6 custom bands based on percentage, fixed value or Atr
Upper EM bands are drawn below uper ema, Lower EMA bands are drawn above lower ema
Customizable Options:
Ema length: 200 default
Calculation type: Ema (Default), HILO
Calculation type: Percent,Fixed Value, ATR
Band Value: Percent/Value/ATR multiple This is value to use for calculation type
Band Selection: Both,Upper,Lower
Key Features:
You can choose to draw either of one or both, the latter can be overwhelming initially but as you get used to it, it becomes a powerful tool.
When both bands are selected, upper and lower bands provide provides dual references and intersections
This creates a more trend-responsive alternative to traditional Donchian channels with clearly defined zones for trade planning.
If you select percaentage, note that the calulation is based FROM the respective EMA bands. So bands from lower EMA band will appear narrower compared to the those drawn from upper EMA band
Price targets or reversals:
Look of alignment of lines and price. The current level of one order could align with that of previous level of a different order because often markets move in steps
Settings Guide:
Recommended Settings:
Ema length: 200
Use one of the bands (not both) if using large length of say 1000
Calculation type: EMA
HILO will draw donchian like bands, this is useful if you only want flat price levels. In a rising market use upper and vise versa
Calculation type:
percentage for indices : 5, for symbols 10 or higher based on symbol volatility
Fixed value: about 10% of symbol value converted to value
Atr: 2 ideally
Perfect for swing traders and position traders looking for a more sophisticated volatility-based overlay that adapts to changing market conditions and provides predictive reversal levels.
Note: This indicator works well across multiple timeframes but is especially effective on H4, Daily and Weekly charts for trend trading.

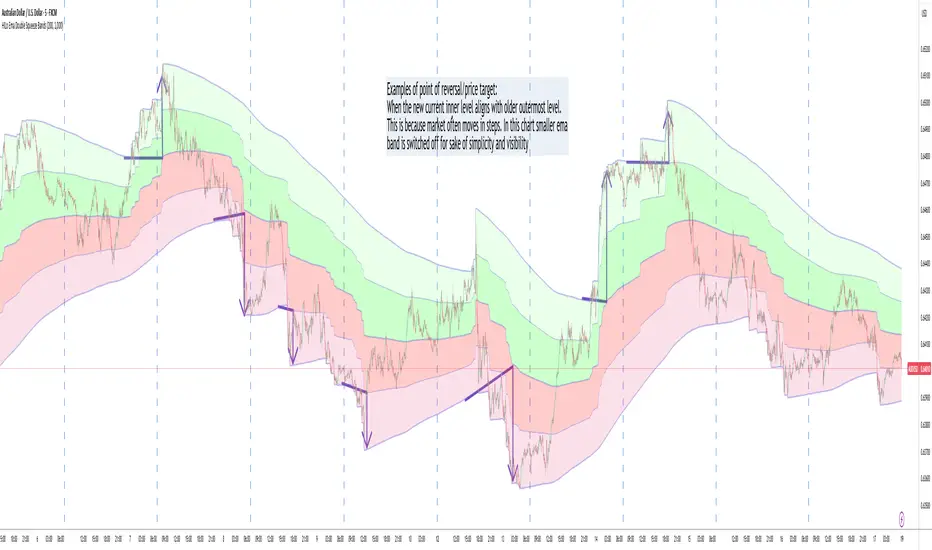
HILo Ema Double Squeeze BandsHILo Ema Double Squeeze Bands
This advanced technical indicator is a powerful variation of "HiLo Ema squeeze bands" that combines the best elements of Donchian channels and EMAs. It's specially designed to identify price squeezes before significant market moves while providing dynamic support/resistance levels and predictive price targets.
Indicator Concept:
The indicator initializes EMAs at each new high or low - the upper EMA tracks highs while the lower EMA tracks lows. The price range between upper and lower bands is divided into 4 equal zones by these lines:
Upper2 (uppermost line)
Upper1 (upper quartile)
Middle (center line)
Lower1 (lower quartile)
Lower2 (lowermost line)
This creates a more trend-responsive alternative to traditional Donchian channels with clearly defined zones for trade planning.
Key Features:
Dual EMA Band System: Utilizes both short-term and long-term EMAs to create adaptive price channels that respond to different market cycles
Quartile Divisions: Each band set includes middle lines and quartile divisions for more precise entry and exit points
Customizable Parameters: Easily adjust EMA periods and display options to suit your trading style and timeframe
Visual Color Zones: Clear color-coded zones help quickly identify bullish and bearish areas
Optional Extra Divisions: Add more granular internal lines (eighth divisions) for enhanced precision with longer EMA periods
Price Labels Option: Display exact price values for key levels directly on the chart
Price Target Prediction:
One of the most valuable features of this indicator is its ability to help predict potential reversal points:
When price breaks above the Upper2 level, look for potential reversals when the new Upper1 or Middle line aligns with previous Upper2 levels
When price breaks below the Lower2 level, look for potential reversals when the new Lower1 or Middle line aligns with previous Lower2 levels
Settings Guide:
Recommended Settings: 200 for Short EMA, 1000 for Long EMA works extremely well across most timeframes and symbols
Display options allow you to show/hide either band system based on your analysis preferences
The new option to divide the long EMA range into 8 parts instead of 4 is particularly useful when:
Long EMA period is >500
Short EMA is switched off and long EMA is used independently
Perfect for swing traders and position traders looking for a more sophisticated volatility-based overlay that adapts to changing market conditions and provides predictive reversal levels.
Note: This indicator works well across multiple timeframes but is especially effective on H4, Daily and Weekly charts for trend trading.
Z-Score Trend Monitor [EdgeTerminal]The Z-Score Trend Monitor measures how far the short-term moving average deviates from the long-term moving average using the spread difference of the two — in standardized units. It’s designed to detect overextension, momentum exhaustion, and potential mean-reversion points by converting the spread between two moving averages into a normalized Z-score and tracking its change and direction over time.
The idea behind this is to catch the changes in the direction of a trend earlier than the usual and lagging moving average lines, allowing you to react faster.
The math behind the indicator itself is very simple. We take the simple moving average of the spread between a long term and short term moving average, and divide it by the difference between the spread and spread mean.
This results in a relatively accurate and early acting trend detector that can easily identify overbought and oversold levels in any timeframe. From our own testing, we recommend using this indicator as a trend confirmation tool.
How to Use It:
Keep an eye on the Z-Score or the blue line. When it goes over 2, it indicates an overbought or near top level, and when it goes below -2, it indicates an oversold or near bottom.
When Z-Score returns to zero or grey line, it suggests mean reversion is in progress.
You can also change the Z-Score criteria from 2 and -2 in the settings to any number you’d like for tighter or wider levels.
For scalping and fast trading setups, we recommend shorter SMAs, such as 5 and 20, and for longer trading setups such as swing trades, we recommend 20 and 100.
Settings:
Short SMA: Lookback period of short term simple moving average for the lower side of the SMA spread.
Short Term Weight: Additional weight or multiplier to suppress the short term SMA calculation. This is used to refine the SMA calculation for more granular and edge cases when needed, usually left at 1, meaning it will take the entire given value in the short SMA field.
Long SMA: Lookback period of long term simple moving average for the upper side of the SMA spread.
Long Term Weight: Additional weight or multiplier to suppress the long term SMA calculation. This is used to refine the long SMA calculation for more granular and edge cases when needed, usually left at 1, meaning it will take the entire given value in the long SMA field.
Z-Score Threshold: The threshold for upper (oversold) and lower (overbought) levels. This can also be set individually from the style page.
Z-Score Lookback Window: The lookback period to calculate spread mean and spread standard deviation

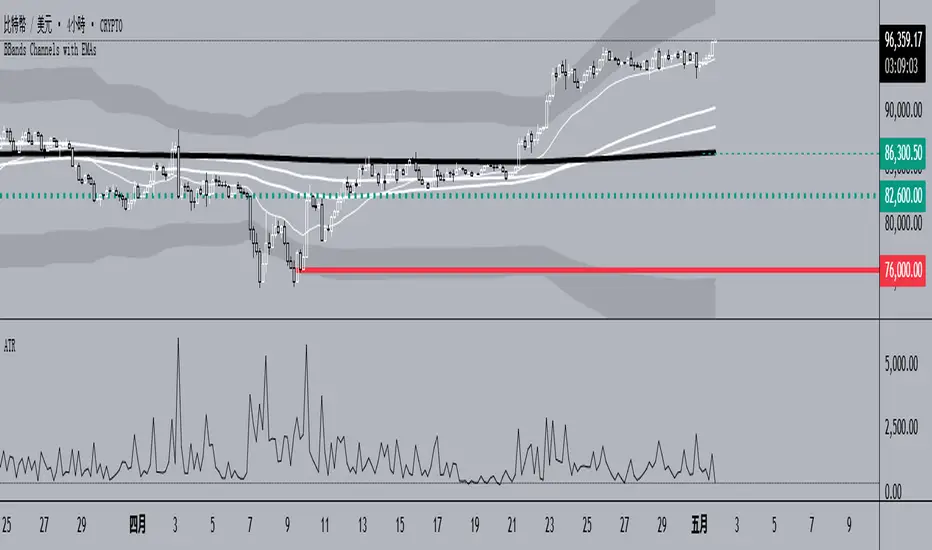
BBands Channels with EMAs# **BBands Channels with EMAs Indicator Explanation**
---
## **📌 Feature Overview**
### **1. Bollinger Bands**
- **Basis Line**: 160-period SMA (adjustable)
- **Inner Bands**:
- **Upper**: Basis + 2× Standard Deviation
- **Lower**: Basis - 2× Standard Deviation
- **Outer Bands**:
- **Upper Top**: Basis + 3× Standard Deviation
- **Lower Low**: Basis - 3× Standard Deviation
- **Fill Effect**: Semi-transparent black fill between inner and outer bands
### **2. Exponential Moving Averages (EMAs)**
| Period | Purpose | Line Style |
|--------------|-----------------------------|------------------|
| **EMA 27** | Short-term trend | Thin line |
| **EMA 120** | Short-to-medium-term trend | Medium line |
| **EMA 200** | Medium-term trend | Medium line |
| **EMA 1120** | Ultra-long-term trend | Thick line |
---
## **⚙️ Parameter Settings**
### **Bollinger Bands**
| Parameter | Default | Description |
|---------------|---------|--------------------------------------|
| `length` | 160 | SMA calculation period |
| `mult` | 2.0 | Standard deviation multiplier (inner bands) |
| `multOuter` | 3.0 | Standard deviation multiplier (outer bands) |
| `offset` | 0 | Time offset for plots (±500 bars) |
### **Exponential Moving Averages (EMAs)**
| Parameter | Default | Description |
|-----------------|---------|---------------------------|
| `ema1Length` | 27 | EMA 1 period |
| `ema2Length` | 120 | EMA 2 period |
| `ema3Length` | 200 | EMA 3 period |
| `ema4Length` | 1120 | EMA 4 period |
---
## **📊 Use Cases**
### **1. Trend Confirmation**
- **Bullish Trend**: Price above EMA200 + Bollinger Band expansion
- **Bearish Trend**: Price below EMA200 + Bollinger Band expansion
### **2. Overbought/Oversold Signals**
- **Upper Band Touch**: Price reaches Upper Top → Potential overbought
- **Lower Band Touch**: Price reaches Lower Low → Potential oversold
### **3. Volatility Strategies**
- **Band Squeeze**: Narrowing gap between bands → Breakout warning
- **Band Expansion**: Price breaks outer band → Trend acceleration
---
**✅ Summary**
This indicator combines **Bollinger Bands + Multi-period EMAs** for:
- Trend tracking
- Volatility analysis
- Multi-timeframe strategies
---
# **BBands Channels with EMAs 指標說明**
---
## **📌 功能概述**
### **1. 布林通道 (Bollinger Bands)**
- **基礎線 (Basis Line)**: 160週期SMA(可調整)
- **內通道 (Inner Bands)**:
- 上軌 (Upper): 基礎線 + 2倍標準差
- 下軌 (Lower): 基礎線 - 2倍標準差
- **外通道 (Outer Bands)**:
- 上外軌 (Upper Top): 基礎線 + 3倍標準差
- 下外軌 (Lower Low): 基礎線 - 3倍標準差
- **填充效果**: 內外通道間半透明黑色填充
### **2. 指數移動平均線 (EMAs)**
| 週期 | 用途 | 線條樣式 |
|-------------|-------------------|-----------------|
| **EMA 27** | 短期趨勢 | 細線 |
| **EMA 120** | 中短期趨勢 | 中等線 |
| **EMA 200** | 中期趨勢 | 中等線 |
| **EMA 1120**| 超長期趨勢 | 粗線 |
---
## **⚙️ 參數設定**
### **布林通道 (Bollinger Bands)**
| 參數名 | 預設值 | 說明 |
|-------------|--------|---------------------------|
| `length` | 160 | SMA計算週期 |
| `mult` | 2.0 | 內通道標準差倍數 |
| `multOuter` | 3.0 | 外通道標準差倍數 |
| `offset` | 0 | 線圖時間偏移(±500根K棒) |
### **指數移動平均線 (EMAs)**
| 參數名 | 預設值 | 說明 |
|----------------|---------|-------------------|
| `ema1Length` | 27 | 第一條EMA週期 |
| `ema2Length` | 120 | 第二條EMA週期 |
| `ema3Length` | 200 | 第三條EMA週期 |
| `ema4Length` | 1120 | 第四條EMA週期 |
---
## **📊 應用場景**
### **1. 趨勢確認**
- **多頭趨勢**: 價格在EMA200上方 + 布林通道擴張
- **空頭趨勢**: 價格在EMA200下方 + 布林通道擴張
### **2. 超買超賣信號**
- **觸及外軌**: 價格觸碰Upper Top → 可能超買
- **觸及下軌**: 價格觸碰Lower Low → 可能超賣
### **3. 波動率策略**
- **通道收窄**: 內外通道間距縮小 → 突破預警
- **通道擴張**: 價格突破外軌 → 趨勢加速
---
**✅ 總結**
本指標透過**布林通道+多週期EMA**的組合,適用於:
- 趨勢跟蹤
- 波動率分析
- 多時間框架策略
Crypto EMA TableCrypto EMA Trend Scanner
A powerful tool for crypto traders to quickly identify trend strength across multiple timeframes
This indicator helps you spot potential trading opportunities by analyzing the EMA (Exponential Moving Average) alignment across four different timeframes. It displays a clean, color-coded table showing which cryptocurrencies are in a strong uptrend.
Key Features:
Multi-Timeframe Analysis: Simultaneously scan 3-minute, 15-minute, 1-hour, and 4-hour charts
Clear Visual Signals: Green cells indicate bullish EMA alignment (EMA 20 > EMA 50 > EMA 200)
Customizable Symbols: Track up to 3 different cryptocurrencies of your choice
Exchange Selection: Compatible with major exchanges (Bybit, Binance, Coinbase, Kraken, KuCoin, FTX)
Flexible Positioning: Place the table anywhere on your chart
How to Use:
Add the indicator to your chart
Select your preferred cryptocurrencies in the settings
Position the table where you want it
Look for green cells indicating EMA lineup.
Use this information to identify potential entry points or confirm your trading bias

Easy MA SignalsEasy MA Signals
Overview
Easy MA Signals is a versatile Pine Script indicator designed to help traders visualize moving average (MA) trends, generate buy/sell signals based on crossovers or custom price levels, and enhance chart analysis with volume-based candlestick coloring. Built with flexibility in mind, it supports multiple MA types, crossover options, and customizable signal appearances, making it suitable for traders of all levels. Whether you're a day trader, swing trader, or long-term investor, this indicator provides actionable insights while keeping your charts clean and intuitive.
Configure the Settings
The indicator is divided into three input groups for ease of use:
General Settings:
Candlestick Color Scheme: Choose from 10 volume-based color schemes (e.g., Sapphire Pulse, Emerald Spark) to highlight high/low volume candles. Select “None” for TradingView’s default colors.
Moving Average Length: Set the MA period (default: 20). Adjust for faster (lower values) or slower (higher values) signals.
Moving Average Type: Choose between SMA, EMA, or WMA (default: EMA).
Show Buy/Sell Signals: Enable/disable signal plotting (default: enabled).
Moving Average Crossover: Select a crossover type (e.g., MA vs VWAP, MA vs SMA50) for signals or “None” to disable.
Volume Influence: Adjust how volume impacts candlestick colors (default: 1.2). Higher values make thresholds stricter.
Signal Appearance Settings:
Buy/Sell Signal Shape: Choose shapes like triangles, arrows, or labels for signals.
Buy/Sell Signal Position: Place signals above or below bars.
Buy/Sell Signal Color: Customize colors for better visibility (default: green for buy, red for sell).
Custom Price Alerts:
Custom Buy/Sell Alert Price: Set specific price levels for alerts (default: 0, disabled). Enter a non-zero value to enable.
Set Up Alerts
To receive notifications (e.g., sound, popup, email) when signals or custom price levels are hit:
Click the Alert button (alarm clock icon) in TradingView.
Select Easy MA Signals as the condition and choose one of the four alert types:
MA Crossover Buy Alert: Triggers on MA crossover buy signals.
MA Crossover Sell Alert: Triggers on MA crossover sell signals.
Custom Buy Alert: Triggers when price crosses above the custom buy price.
Custom Sell Alert: Triggers when price crosses below the custom sell price.
Enable Play Sound and select a sound (e.g., “Bell”).
Set the frequency (e.g., Once Per Bar Close for confirmed signals) and create the alert.
Analyze the Chart
Moving Average Line: Displays the selected MA with color changes (green for bullish, red for bearish, gray for neutral) based on price position relative to the MA.
Buy/Sell Signals: Appear as shapes or labels when crossovers or custom price levels are hit.
Candlestick Colors: If a color scheme is selected, candles change color based on volume strength (high, low, or neutral), aiding in trend confirmation.
Why Use Easy MA Signals?
Easy MA Signals is designed to simplify technical analysis while offering advanced customization. It’s ideal for traders who want:
A clear visualization of MA trends and crossovers.
Flexible signal generation based on MA crossovers or custom price levels.
Volume-enhanced candlestick coloring to identify market strength.
Easy-to-use settings with tooltips for beginners and pros alike.
This script is particularly valuable because it combines multiple features into one indicator, reducing chart clutter and providing actionable insights without overwhelming the user.
Benefits of Easy MA Signals
Highly Customizable: Supports SMA, EMA, and WMA with adjustable lengths.
Offers multiple crossover options (VWAP, SMA10, SMA20, etc.) for tailored strategies.
Custom price alerts allow precise targeting of key levels.
Volume-Based Candlestick Coloring: 10 unique color schemes highlight volume strength, helping traders confirm trends.
Adjustable volume influence ensures adaptability to different markets.
Flexible Signal Visualization: Choose from various signal shapes (triangles, arrows, labels) and positions (above/below bars).
Customizable colors improve visibility on any chart background.
Alert Integration: Built-in alert conditions for crossovers and custom prices support sound, email, and app notifications.
Easy setup for real-time trading decisions.
User-Friendly Design: Organized input groups with clear tooltips make configuration intuitive.
Suitable for beginners and advanced traders alike.
Example Use Cases
Swing Trading with MA Crossovers:
Scenario: A trader wants to trade Bitcoin (BTC/USD) on a 4-hour chart using an EMA crossover strategy.
Setup:
Set Moving Average Type to EMA, Length to 20.
Set Moving Average Crossover to “MA vs SMA50”.
Enable Show Buy/Sell Signals and choose “arrowup” for buy, “arrowdown” for sell.
Select “Emerald Spark” for candlestick colors to highlight volume surges.
Usage: Buy when the EMA20 crosses above the SMA50 (green arrow appears) and volume is high (dark green candles). Sell when the EMA20 crosses below the SMA50 (red arrow). Set alerts for real-time notifications.
Scalping with Custom Price Alerts:
Scenario: A day trader monitors Tesla (TSLA) on a 5-minute chart and wants alerts at specific support/resistance levels.
Setup:
Set Custom Buy Alert Price to 150.00 (support) and Custom Sell Alert Price to 160.00 (resistance).
Use “labelup” for buy signals and “labeldown” for sell signals.
Keep Moving Average Crossover as “None” to focus on price alerts.
Usage: Receive a sound alert and label when TSLA crosses 150.00 (buy) or 160.00 (sell). Use volume-colored candles to confirm momentum before entering trades.
When NOT to Use Easy MA Signals
High-Frequency Trading: Reason: The indicator relies on moving averages and volume, which may lag in ultra-fast markets (e.g., sub-second trades). High-frequency traders may need specialized tools with real-time tick data.
Alternative: Use order book or market depth indicators for faster execution.
Low-Volatility or Sideways Markets:
Reason: MA crossovers and custom price alerts can generate false signals in choppy, range-bound markets, leading to whipsaws.
Alternative: Use oscillators like RSI or Bollinger Bands to trade within ranges.
This indicator is tailored more towards less experienced traders. And as always, paper trade until you are comfortable with how this works if you're unfamiliar with trading! We hope you enjoy this and have great success. Thanks for your interested in Easy MA Signals!

Multi-Timeframe Trend Analysis [BigBeluga]Multi-Timeframe Trend Analysis
A powerful trend-following dashboard designed to help traders monitor and compare trend direction across multiple higher timeframes. By analyzing EMA conditions from five customizable timeframes, this tool gives a clear visual breakdown of short- to long-term trend alignment.
🔵Key Features:
Multi-Timeframe EMA Dashboard:
➣ Displays a table in the top-right corner showing trend direction across 5 user-defined timeframes.
➣ Each row shows whether ema is rising or falling its corresponding EMA for that timeframe.
➣ Green arrows (🢁) indicate uptrends, purple arrows (🢃) signal downtrends.
Custom Timeframe Selection:
➣ Traders can input any 5 timeframes (e.g., 1h, 2h, 3h, etc.) with individual EMA lengths for flexible trend mapping.
➣ The tool auto-adjusts to match and align external timeframe EMAs to the current chart for seamless overlay.
Dynamic Chart Arrows:
➣ On-chart arrows mark when EMA rising or falling EMAs from the current chart timeframe.
➣ Each EMA arrows has a unique transparency level—shorter EMA arrows are more transparent, longer EMA arrows are more vivid. (Hover Mouse over the arrow to see which EMAs it is)
Gradient EMA Plotting:
➣ All five EMAs are plotted with gradually increasing opacity.
➣ Gradient fills between EMAs enhance visual structure, making it easier to track convergence/divergence.
🔵Usage:
Trend Confirmation: Use the dashboard to confirm multi-timeframe trend alignment before entering trades.
Entry Filtering: Avoid countertrend trades by spotting when higher timeframes disagree with the current one.
Momentum Insight: Track the transition of arrows from lighter to stronger opacity to visualize trend shifts over time.
Scalping or Swinging: Customize timeframes depending on your strategy—from intraday scalps to longer-term swings.
Multi-Timeframe Trend Analysis is the ultimate visual companion for traders who want clarity on how price behaves across multiple time horizons. With its smart EMA mapping and dashboard feedback, it keeps you aligned with dominant trend directions and transition zones at all times.

ADR Nivele Horizontale dhe EMAThe user provided a Pine Script code for an indicator called "ADR Nivele Horizontale dhe EMA". The task is to explain how this code works. Hmm, first, I need to understand what this indicator does. The title mentions ADR levels and EMA, so it's probably combining horizontal lines based on Average Daily Range and some Exponential Moving Averages.
Looking at the code, the first part is the indicator declaration with version 6. The settings include an ADR period, levels above and below the mid, and line style. Then there's a section for calculations. They request daily high and low to compute the daily range. The ADR is the SMA of the daily range over the specified period. The mid is the average of daily high and low. The adr_val is half of ADR, maybe to create symmetrical levels around the mid.
Next, they create arrays for lines and labels above and below the mid. The loops go from 1 to levels_above/below, calculate each level, draw lines and labels. The mid line is also drawn with a different color. Then, there are several EMAs plotted: 13, 50, 200, 400, 600, 800, each with different colorsWait, but in Pine Script, when you use arrays to store lines and labels, you have to manage them properly to avoid repainting or memory issues. The code uses array.concat to add new lines and labels each bar. However, since this code is running on each bar, the for loops might be creating multiple lines each time, leading to too many objects. Oh right, but they use var to initialize the arrays, so they are only initialized once. Wait, no. The var keyword initializes the variable once, but in each iteration, they are concatenating new lines. Wait, no: the for loops are inside the main script, which runs on each bar. So every time a new bar is processed, the loops will run again, adding new lines and labels. That's a problem because each bar would create new lines, leading to an ever-increasing number of lines, which could hit the maximum limit (max_lines_count is set to 20, but maybe they have more bars). Oh, the indicator has max_lines_count=20, but the code might be creating multiple lines per bar. So maybe the code isn't handling the line management correctly. For example, if levels_above is 2, then each bar would create 2 new lines above and 2 below, plus the mid line. Over 20 bars, that's way over 20 lines. So this could cause the indicator to stop drawing after 20 lines. The user might not have realized that the lines are being recreated every bar, leading to a buildup. But perhaps the original code intended to have the lines update each bar, extending to the current bar. Let's see: in line.new, they use bar_index as the starting x1 and bar_index as x2. So each line is drawn from the previous bar's index to the current one. But since this is done on every bar, each line is only one bar long. Wait, no. Because on each new bar, the code creates a new line from the previous bar's index (bar_index , which is now the bar before the current one) to the current bar_index. So each line is just a segment from the previous bar to the current bar. But when the next bar comes, a new line is created again. So the result is that each level line is a series of one-bar-length segments, which might not be intended. The user probably wants continuous lines that extend from the left to the right, not just per bar. So this approach is incorrect. The correct way would be to have a line that starts at the first bar of the calculation and extends to the right, updating each bar. But the current code creates a new line each bar, leading to multiple short lines instead of one continuous line. That's a mistake.
So the main issue here is that the code is generating a new line segment for each bar, which is not efficient and would quickly hit the line limit. To fix this, instead of creating a new line every bar, they should create the line once and then update its position each bar. But in Pine Script, you can't directly update a line after it's created; instead, you need to track the line ID and use line.set_xy() to extend it. However, the current code uses array.concat to add new lines each bar, which isn't the right approach.
Therefore, the code as written will create multiple short lines instead of continuous horizontal lines. The correct approach for horizontal levels that extend to the right is to create the line once, starting at a certain bar and extending indefinitely, or to update the line's end point each new bar. But in Pine Script, you can't extend lines infinitely; you have to manage them each bar. Alternatively, using the 'line.extend' style might help, but I think the original code's logic is flawed here.
Additionally, the EMA part is straightforward: plotting multiple EMAs with different periods. That part should work as expected.
So the explanation should mention that the ADR levels are calculated based on the daily high and low, then the code attempts to draw horizontal lines above and below the mid-point. However, the way the lines are drawn may lead to multiple short segments instead of continuous lines, potentially causing performance issues or hitting the maximum line count. The EMAs are plotted correctly with various periods..

HILo Ema Squeeze BandsThis indicator combines uses ema to identify price squeeze before a big move.
The ema gets initialised at new high low. It used 3 ema's lengths. For result use x, 2x ,4x ie 50, 100, 200 or 100,200,400 and so on . On more volatile asset use a higher settings like 100,200,400. The inner band is divided into 4 zones, which can give support resistance. As you use it you will become aware of subtle information that it can give at times. Like you may be able to find steps at which prices move, when the market is trending
Just like in Bollinger bands, in a trending market the price stays within sd=1 and sd=2 so does in the inner band the price will remain in band1 and band2. But Bollinger band cannot print steps this indicator shows steps

Air Gap MTF with alert settingsWhat it shows:
This indicator will show a horizontal line at a price where each EMAs are on on different time frames, which will remove the effort of having to flick through different time frames or look at different chart.
The lines itself will move in real time as price moves and therefore as the EMA values changes so no need to manually adjustment the lines.
How to use it:
The price gap between each of the lines are known as "air gaps", which are essentially zones price can move with less resistance. Therefore bigger the airgap there is more likely more movement in price.
In other words, where lines are can be a resistance (or support) and can expect price stagnation or rejection.
On the chart it is clear to see lines are acting as resistances/supports.
Key settings:
The time frame are fixed to: 30min, 1hr and 4hr. This cannot be changed as of now.
EMA values for each time frame are user changeable in the settings, and up to 4 different values can be chosen for each time frame. Default is 5,12,34 and 50 for each timeframe.
Line colour, thickness and style can be user adjusted. Start point for where line will be drawn can be changed in the settings, either: start of day, user defined start or across the chart. In case of user defined scenario user can input a number that specifies a offset from current candle.
Label colour, font, alignment, text size and text itself can be user adjusted in the settings. Price can be also displayed if user chooses to do so. Position of label (offset from current candle) is user specified and can be adjusted by the user.
Both the lines and labels can be turned off (both and individually), for each lines.
Alert Settings:
Manually, user can set alerts for when price crosses a specific line.
This can be done by:
right click on any of line
choose first option (add alert on...)
On the second option under condition, use the dropdown menu to choose the desired EMA/timeframe to set alert for.
Hit "create" at bottom right of option
----------------------------------------------------------------------
If anything is not clear please let me know!

Forward-Backward Exponential Oscillator [LuxAlgo]The Forward-Backward Exponential Oscillator is a normalized oscillator able to estimate directional shifts by making use of a unique "Forward-Backward Filtering" calculation method for Exponential Moving Averages (EMAs).
This unique method provides a smooth normalized representation of the price with reduced lag.
🔶 USAGE
The oscillator consists of 2 series of values derived from normalizing the sum of each EMA's change across the selected user lookback window (length), one less reactive computed forward (in grey), and the other re-calculated backward for each bar (in blue).
Given this "Forward-Backwards" calculation method, we are able to produce a more reactive oscillator compared to the same operation done on a simple double-smoothed EMA.
The interaction between these 2 values (Forward Value and Backward Value) can highlight shifts in market momentum over time.
When the Forward Value is above the Backward Value, the price is seen moving up, and likewise, when the Forward EMA is below, the Backward EMA price is seen moving down.
The indicator specifically displays the difference between values through a histogram located at the 50 mark on the oscillator.
🔹 Projection
We project the approximated future values of the forward value in front of the current line. This helps show the data that is being used for the creation of the Forward Value.
🔹 Length & Smoothing
The Smoothing Input controls the length of the EMAs which are analyzed.
The Length Input controls the lookback for the sum of changes from the EMAs.
Displayed below is a comparison of varying input sizes and their results.
As seen above:
A larger length input will result in slower, gradual movement by the oscillator since the summed values are from a larger lookback.
A higher smoothing setting will result in smoother EMAs, leading to a smoother oscillator output that is less contaminated by noisy variations.
Note: The length of the projection is tied to the "length" input, to get a longer projection, a larger length is required.
🔶 DETAILS
Forward-backward filtering is a method applied to LTI (linear time-invariant) filters to provide a filter response with zero-phase shift, this has the visible effect of shifting a regular causal filter response to the right, making it appear has have effectively 0 lag.
The name of this operation indicates that the filter is first calculated forward over a series of values (like regular moving averages), then calculated backward, using the previous output as input for the filter, effectively applying the filter twice.
While this operation effectively allows us to obtain a zero-lag response when applied to an EMA, it is subject to repainting, as this indicator only returns the normalized sum of changes of the forward-backward EMA, which does not introduce any repainting behaviors in the final output of the oscillator.
🔶 SETTINGS
Length: Change the calculation lookback length for the oscillator.
Smoothing: Alter the smoothness of the back-end EMA calculations.
Source: Change the source input used for the indicator.

Smoothed EMA LinesThe "Smoothed EMA Lines" script is a technical analysis tool designed to help traders identify trends and potential support/resistance levels in financial markets. The script plots exponential moving averages (EMAs) of the closing price for five commonly used time periods: 8, 13, 21, 55, and 200.
Key features of the script include:
Overlay: The EMAs are plotted directly on the price chart, making it easy to analyze the relationship between the moving averages and price action.
Smoothing: The script applies an additional smoothing function to each EMA, using a simple moving average (SMA) of a user-defined length. This helps to reduce noise and provide a clearer picture of the trend.
Customizable lengths: Users can easily adjust the length of each EMA and the smoothing period through the script's input parameters.
Color-coded plots: Each EMA is assigned a unique color (8: blue, 13: green, 21: orange, 55: red, 200: purple) for easy identification on the chart.
Traders can use the "Smoothed EMA Lines" script to:
Identify the overall trend direction (bullish, bearish, or neutral) based on the arrangement of the EMAs.
Spot potential support and resistance levels where the price may interact with the EMAs.
Look for crossovers between EMAs as potential entry or exit signals.
Combine the EMA analysis with other technical indicators and price action patterns for a more comprehensive trading strategy.
The "Smoothed EMA Lines" script provides a clear, customizable, and easy-to-interpret visualization of key exponential moving averages, helping traders make informed decisions based on trend analysis.

MTF Moving Averages (only EMA)MTF Moving Averages (only EMA)
This script provides a Multi-Timeframe (MTF) Exponential Moving Average (EMA) indicator for traders to visualize multiple EMAs across different timeframes directly on a single chart.
The indicator dynamically calculates and plots up to four EMAs per timeframe (15-minute, 30-minute, 1-hour, and Daily) with user-defined lengths, offering valuable insight into price trends and potential entry or exit points.
Key Features:
Multiple Timeframe Support: The script allows you to view EMAs from different timeframes simultaneously. This is especially useful for traders who follow trends across different timeframes to make more informed decisions.
Customizable Lengths: For each timeframe, the lengths of the EMAs are fully customizable. You can adjust the length of up to four EMAs per timeframe to suit your strategy.
EMA Calculation: The Exponential Moving Average (EMA) is used, which gives more weight to recent prices and reacts faster to price changes compared to the simple moving average (SMA).
Timeframe Flexibility: The indicator supports the following timeframes:
15-minute: Ideal for short-term traders and scalpers.
30-minute: For intraday trading with a slightly longer perspective.
1-hour: Suitable for swing traders and those who prefer a more medium-term view.
Daily: Great for longer-term trend-following strategies.
Interactive and User-Friendly: You can toggle the visibility of each EMA on each timeframe, allowing you to choose exactly which EMAs you wish to display, depending on your trading strategy.
Color-Coded for Clarity: The script uses distinct colors for each EMA on the chart:
Blue: EMA1
Green: EMA2
Red: EMA3
Purple: EMA4
Line Width Customization: Each plotted EMA line has a customizable width for better visual clarity.
Use Case:
Traders who use multiple timeframes for analysis (e.g., those using the "multi-timeframe analysis" technique) will find this script particularly useful. For example, a trader may look at the 15-minute chart to catch short-term movements, the 30-minute chart for intraday trends, the 1-hour chart for swing positions, and the Daily chart for identifying the overarching market trend. The script enables them to view the EMAs for all these timeframes in one glance without having to manually switch between them.
By observing the relationships between EMAs across multiple timeframes, traders can gain valuable insights into market conditions such as:
Crossovers: When a shorter-term EMA crosses above or below a longer-term EMA, it can signal a potential trend reversal or continuation.
Trend Strength: Multiple EMAs in alignment across different timeframes can indicate strong trend strength.
Support and Resistance: EMAs can act as dynamic support and resistance levels, guiding traders on price action levels to watch for potential price reversals.
Instructions:
Enable/Disable EMAs: Toggle on or off the EMAs for each timeframe (15-min, 30-min, 1-hour, Daily) using the script’s settings.
Adjust EMA Lengths: Change the default lengths for each EMA to match your preferred settings for different timeframes.
Monitor Key Levels: Watch how price interacts with the plotted EMAs to spot potential trading signals based on your strategy.
This indicator is designed to enhance your multi-timeframe analysis and help make more informed, data-driven trading decisions.

[COG]TMS Crossfire 🔍 TMS Crossfire: Guide to Parameters
📊 Core Parameters
🔸 Stochastic Settings (K, D, Period)
- **What it does**: These control how the first stochastic oscillator works. Think of it as measuring momentum speed.
- **K**: Determines how smooth the main stochastic line is. Lower values (1-3) react quickly, higher values (3-9) are smoother.
- **D**: Controls the smoothness of the signal line. Usually kept equal to or slightly higher than K.
- **Period**: How many candles are used to calculate the stochastic. Standard is 14 days, lower for faster signals.
- **For beginners**: Start with the defaults (K:3, D:3, Period:14) until you understand how they work.
🔸 Second Stochastic (K2, D2, Period2)
- **What it does**: Creates a second, independent stochastic for stronger confirmation.
- **How to use**: Can be set identical to the first one, or with slightly different values for dual confirmation.
- **For beginners**: Start with the same values as the first stochastic, then experiment.
🔸 RSI Length
- **What it does**: Controls the period for the RSI calculation, which measures buying/selling pressure.
- **Lower values** (7-9): More sensitive, good for short-term trading
- **Higher values** (14-21): More stable, better for swing trading
- **For beginners**: The default of 11 is a good balance between speed and reliability.
🔸 Cross Level
- **What it does**: The centerline where crosses generate signals (default is 50).
- **Traditional levels**: Stochastics typically use 20/80, but 50 works well for this combined indicator.
- **For beginners**: Keep at 50 to focus on trend following strategies.
🔸 Source
- **What it does**: Determines which price data is used for calculations.
- **Common options**:
- Close: Most common and reliable
- Open: Less common
- High/Low: Used for specialized indicators
- **For beginners**: Stick with "close" as it's most commonly used and reliable.
🎨 Visual Theme Settings
🔸 Bullish/Bearish Main
- **What it does**: Sets the overall color scheme for bullish (up) and bearish (down) movements.
- **For beginners**: Green for bullish and red for bearish is intuitive, but choose any colors that are easy for you to distinguish.
🔸 Bullish/Bearish Entry
- **What it does**: Colors for the entry signals shown directly on the chart.
- **For beginners**: Use bright, attention-grabbing colors that stand out from your chart background.
🌈 Line Colors
🔸 K1, K2, RSI (Bullish/Bearish)
- **What it does**: Controls the colors of each indicator line based on market direction.
- **For beginners**: Use different colors for each line so you can quickly identify which line is which.
⏱️ HTF (Higher Timeframe) Settings
🔸 HTF Timeframe
- **What it does**: Sets which higher timeframe to use for filtering (e.g., 240 = 4 hour chart).
- **How to choose**: Should be at least 4x your current chart timeframe (e.g., if trading on 15min, use 60min or higher).
- **For beginners**: Start with a timeframe 4x higher than your trading chart.
🔸 Use HTF Filter
- **What it does**: Toggles whether the higher timeframe filter is applied or not.
- **For beginners**: Keep enabled to reduce false signals, especially when learning.
🔸 HTF Confirmation Bars
- **What it does**: How many bars must confirm a trend change on higher timeframe.
- **Higher values**: More reliable but slower to react
- **Lower values**: Faster signals but more false positives
- **For beginners**: Start with 2-3 bars for a good balance.
📈 EMA Settings
🔸 Use EMA Filter
- **What it does**: Toggles price filtering with an Exponential Moving Average.
- **For beginners**: Keep enabled for better trend confirmation.
🔸 EMA Period
- **What it does**: Length of the EMA for filtering (shorter = faster reactions).
- **Common values**:
- 5-13: Short-term trends
- 21-50: Medium-term trends
- 100-200: Long-term trends
- **For beginners**: 5-10 is good for short-term trading, 21 for swing trading.
🔸 EMA Offset
- **What it does**: Shifts the EMA forward or backward on the chart.
- **For beginners**: Start with 0 and adjust only if needed for visual clarity.
🔸 Show EMA on Chart
- **What it does**: Toggles whether the EMA appears on your main price chart.
- **For beginners**: Keep enabled to see how price relates to the EMA.
🔸 EMA Color, Style, Width, Transparency
- **What it does**: Customizes how the EMA line looks on your chart.
- **For beginners**: Choose settings that make the EMA visible but not distracting.
🌊 Trend Filter Settings
🔸 Use EMA Trend Filter
- **What it does**: Enables a multi-EMA system that defines the overall market trend.
- **For beginners**: Keep enabled for stronger trend confirmation.
🔸 Show Trend EMAs
- **What it does**: Toggles visibility of the trend EMAs on your chart.
- **For beginners**: Enable to see how price moves relative to multiple EMAs.
🔸 EMA Line Thickness
- **What it does**: Controls how the thickness of EMA lines is determined.
- **Options**:
- Uniform: All EMAs have the same thickness
- Variable: Each EMA has its own custom thickness
- Hierarchical: Automatically sized based on period (longer periods = thicker)
- **For beginners**: "Hierarchical" is most intuitive as longer-term EMAs appear more dominant.
🔸 EMA Line Style
- **What it does**: Sets the line style (solid, dotted, dashed) for all EMAs.
- **For beginners**: "Solid" is usually clearest unless you have many lines overlapping.
🎭 Trend Filter Colors/Width
🔸 EMA Colors (8, 21, 34, 55)
- **What it does**: Sets the color for each individual trend EMA.
- **For beginners**: Use a logical progression (e.g., shorter EMAs brighter, longer EMAs darker).
🔸 EMA Width Settings
- **What it does**: Controls the thickness of each EMA line.
- **For beginners**: Thicker lines for longer EMAs make them easier to distinguish.
🔔 How These Parameters Work Together
The power of this indicator comes from how these components interact:
1. **Base Oscillator**: The stochastic and RSI components create the main oscillator
2. **HTF Filter**: The higher timeframe filter prevents trading against larger trends
3. **EMA Filter**: The EMA filter confirms signals with price action
4. **Trend System**: The multi-EMA system identifies the overall market environment
Think of it as multiple layers of confirmation, each adding more reliability to your trading signals.
💡 Tips for Beginners
1. **Start with defaults**: Use the default settings first and understand what each element does
2. **One change at a time**: When customizing, change only one parameter at a time
3. **Keep notes**: Write down how each change affects your results
4. **Backtest thoroughly**: Test any changes on historical data before trading real money
5. **Less is more**: Sometimes simpler settings work better than complicated ones
Remember, no indicator is perfect - always combine this with proper risk management and other forms of analysis!

Pivot Point+ Supertrend + EMA + Support/Resistance- LAXMANTAK98
Pivot Point Supertrend with EMA and Support/Resistance Indicator
This custom trading indicator combines the following key components to assist in market analysis and trade decision-making:
Pivot Points:
Pivot points are calculated based on a chosen price source (High, Low, Open, or Close). These levels are used to determine potential support and resistance zones.
Pivot Highs (Resistance) and Pivot Lows (Support) are plotted as labels on the chart for easy identification.
Supertrend Indicator:
The Supertrend is a trend-following indicator that helps to identify bullish or bearish trends.
It uses the Average True Range (ATR) to calculate dynamic support/resistance levels, with adjustable settings for ATR length and multiplier factor.
The trend direction is visually represented by green (bullish) and red (bearish) lines on the chart.
Exponential Moving Averages (EMA):
The indicator plots up to four EMAs with user-defined periods (e.g., 9, 21, 50, 200).
EMAs are commonly used to smooth out price data and identify trends over various timeframes.
Support and Resistance Levels:
Based on Pivot Points, support and resistance levels are plotted using crosses on the chart.
These levels indicate possible price reversal points, helping traders spot key zones for entry and exit.
Visual Alerts:
The indicator includes built-in alerts for trend changes and potential buy/sell signals based on the transition between uptrend and downtrend states.
This combined indicator allows traders to analyze trends, identify key levels for trading, and make more informed decisions by integrating Pivot Points, Supertrend, EMAs, and Support/Resistance in one cohesive system.

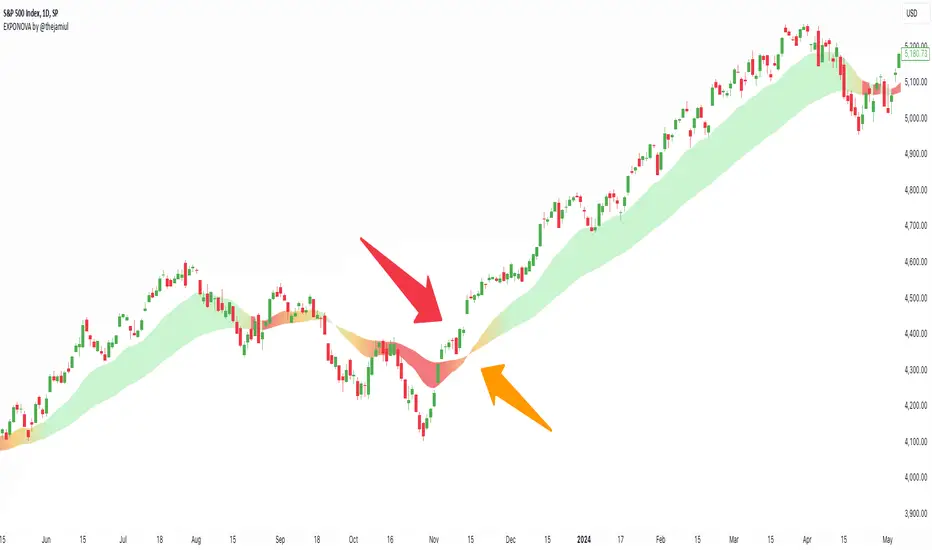
EXPONOVA by @thejamiulEXPONOVA is an advanced EMA-based indicator designed to provide a visually intuitive and actionable representation of market trends. It combines two EMAs (Exponential Moving Averages) with a custom gradient fill to help traders identify trend reversals, strength, and the potential duration of trends.
This indicator uses a gradient color fill between two EMAs—one short-term (20-period) and one longer-term (55-period). The gradient dynamically adjusts based on the proximity and relationship of the closing price to the EMAs, giving traders a unique visual insight into trend momentum and potential exhaustion points.
Key Features:
Dynamic Gradient Fill:
The fill color between the EMAs changes based on the bar's position relative to the longer-term EMA.
A fading gradient visually conveys the strength and duration of the trend. The closer the closing price is to crossing the EMA, the stronger the gradient, making trends easy to spot.
Precision EMA Calculations:
The indicator plots two EMAs (20 and 55) without cluttering the chart, ensuring traders have a clean and informative display.
Ease of Use:
Designed for both novice and advanced traders, this tool is effective in identifying trend reversals and entry/exit points.
Trend Reversal Detection:
Built-in logic identifies bars since the last EMA cross, dynamically adjusting the gradient to signal potential trend changes.
How It Works:
This indicator calculates two EMAs:
EMA 20 (Fast EMA): Tracks short-term price movements, providing early signals of potential trend changes.
EMA 55 (Slow EMA): Captures broader trends and smoothens noise for a clearer directional bias.
The area between the two EMAs is filled with a dynamic color gradient, which evolves based on how far the price has moved above or below EMA 55. The gradient acts as a visual cue to the strength and duration of the current trend:
Bright green shades indicate bullish momentum building over time.
Red tones highlight bearish momentum.
The fading effect in the gradient provides traders with an intuitive representation of trend strength, helping them gauge whether the trend is accelerating, weakening, or reversing.
Gradient-Filled Region: Unique visualization to simplify trend analysis without cluttering the chart.
Dynamic Trend Strength Indication: The gradient dynamically adjusts based on the price's proximity to EMA 55, giving traders insight into momentum changes.
Minimalist Design: The EMAs themselves are not displayed by default to maintain a clean chart while still benefiting from their analysis.
Customizable Lengths: Pre-configured with EMA lengths of 20 and 55, but easily modifiable for different trading styles or instruments.
How to Use This Indicator
Trend Detection: Look at the gradient fill for visual confirmation of trend direction and strength.
Trade Entries:
Enter long positions when the price crosses above EMA 55, with the gradient transitioning to green.
Enter short positions when the price crosses below EMA 55, with the gradient transitioning to red.
Trend Strength Monitoring:
A brighter gradient suggests a sustained and stronger trend.
A fading gradient may indicate weakening momentum and a potential reversal.
Important Notes
This indicator uses a unique method of color visualization to enhance decision-making but does not generate buy or sell signals directly.
Always combine this indicator with other tools or methods for comprehensive analysis.
Past performance is not indicative of future results; please practice risk management while trading.
How to Use:
Trend Following:
Use the gradient fill to identify the trend direction.
A consistently bright gradient indicates a strong trend, while fading colors suggest weakening momentum.
Reversal Signals:
Watch for gradient changes near the EMA crossover points.
These can signal potential trend reversals or consolidation phases.
Confirmation Tool:
Combine EXPONOVA with other indicators or candlestick patterns for enhanced confirmation of trade setups.
AI InfinityAI Infinity – Multidimensional Market Analysis
Overview
The AI Infinity indicator combines multiple analysis tools into a single solution. Alongside dynamic candle coloring based on MACD and Stochastic signals, it features Alligator lines, several RSI lines (including glow effects), and optionally enabled EMAs (20/50, 100, and 200). Every module is individually configurable, allowing traders to tailor the indicator to their personal style and strategy.
Important Note (Disclaimer)
This indicator is provided for educational and informational purposes only.
It does not constitute financial or investment advice and offers no guarantee of profit.
Each trader is responsible for their own trading decisions.
Past performance does not guarantee future results.
Please review the settings thoroughly and adjust them to your personal risk profile; consider supplementary analyses or professional guidance where appropriate.
Functionality & Components
1. Candle Coloring (MACD & Stochastic)
Objective: Provide an immediate visual snapshot of the market’s condition.
Details:
MACD Signal: Used to identify bullish and bearish momentum.
Stochastic: Detects overbought and oversold zones.
Color Modes: Offers both a simple (two-color) mode and a gradient mode.
2. Alligator Lines
Objective: Assist with trend analysis and determining the market’s current phase.
Details:
Dynamic SMMA Lines (Jaw, Teeth, Lips) that adjust based on volatility and market conditions.
Multiple Lengths: Each element uses a separate smoothing period (13, 8, 5).
Transparency: You can show or hide each line independently.
3. RSI Lines & Glow Effects
Objective: Display the RSI values directly on the price chart so critical levels (e.g., 20, 50, 80) remain visible at a glance.
Details:
RSI Scaling: The RSI is plotted in the chart window, eliminating the need to switch panels.
Dynamic Transparency: A pulse effect indicates when the RSI is near critical thresholds.
Glow Mode: Choose between “Direct Glow” or “Dynamic Transparency” (based on ATR distance).
Custom RSI Length: Freely adjustable (default is 14).
4. Optional EMAs (20/50, 100, 200)
Objective: Utilize moving averages for trend assessment and identifying potential support/resistance areas.
Details:
20/50 EMA: Select which one to display via a dropdown menu.
100 EMA & 200 EMA: Independently enabled.
Color Logic: Automatically green (price > EMA) or red (price < EMA). Each EMA’s up/down color is customizable.
Configuration Options
Candle Coloring:
Choose between Gradient or Simple mode.
Adjust the color scheme for bullish/bearish candles.
Transparency is dynamically based on candle body size and Stochastic state.
Alligator Lines:
Toggle each line (Jaw/Teeth/Lips) on or off.
Select individual colors for each line.
RSI Section:
RSI Length can be set as desired.
RSI lines (0, 20, 50, 80, 100) with user-defined colors and transparency (pulse effect).
Additional lines (e.g., RSI 40/60) are also available.
Glow Effects:
Switch between “Dynamic Transparency” (ATR-based) and “Direct Glow”.
Independently applied to the RSI 100 and RSI 0 lines.
EMAs (20/50, 100, 200):
Activate each one as needed.
Each EMA’s up/down color can be customized.
Example Use Cases
Trend Identification:
Enable Alligator lines to gauge general trend direction through SMMA signals.
Timing:
Watch the Candle Colors to spot potential overbought or oversold conditions.
Fine-Tuning:
Utilize the RSI lines to closely monitor important thresholds (50 as a trend barometer, 80/20 as possible reversal zones).
Filtering:
Enable a 50 EMA to quickly see if the market is trading above (bullish) or below (bearish) it.

Boltzmann Weighted Moving average ( BWMA )Overview:
Introducing the Boltzmann Weighted Moving Average (BWMA) – a novel approach that draws inspiration from statistical mechanics to emphasize recent market data more than older data. By applying an exponential decay governed by a “temperature” parameter, BWMA provides a unique perspective on price trends and enhances noise filtering. An EMA-based smoothing is then applied for an even cleaner, more stable signal.
Key Features:
Boltzmann Weighting: The BWMA assigns weights to each data point based on a Boltzmann-like formula, giving more influence to recent bars and reducing the impact of older ones. This creates a dynamic, adaptive moving average that can quickly respond to market changes.
Adaptive Temperature Control: Users can adjust the “Temperature” (T) parameter. A lower T puts a stronger emphasis on the most recent data, while a higher T makes the weight distribution more uniform across the chosen period.
EMA Smoothing: After computing the weighted average, an EMA is applied to smooth out short-term noise, resulting in a cleaner trend indication.
Color-Coded Trend Indicator: The BWMA line changes color depending on its slope, allowing traders to quickly identify bullish (green) or bearish (red) conditions at a glance.
Parameters:
Period: Defines the lookback window over which the Boltzmann weights are calculated.
Temperature (T): Controls the steepness of the weight decay. Lower T emphasizes recency, while higher T spreads weights more evenly.
Alpha (Energy Scale): Adjusts how quickly “Energy” (and thus weight decay) increases with older data points.
Smoothing Period: Determines the EMA length for reducing noise after weighting, providing a more stable signal.
How It Works:
The BWMA calculates a weighted average of recent prices, where the weight for each data point i is given by:
weight = math.exp(-energy / (k_B * T))
Energy_i: Increases as the data point is further back in time.
k_B: A scaling constant, set to 1 for simplicity.
T: "Temperature" parameter that controls how quickly the weights decay. A lower T emphasizes more recent data strongly, while a higher T spreads out the emphasis more evenly.
Visuals:
BWMA Line: Plotted as a smooth line that changes color based on trend direction.
Green: BWMA is rising (bullish trend).
Red: BWMA is falling (bearish trend).
Usage:
The BWMA can be used similarly to traditional moving averages but offers greater flexibility and adaptability:
Adjust T and Alpha: Fine-tune the weighting profile to match your trading style, whether you prefer rapid response to recent changes or a more balanced view.
Trend Confirmation: Use color changes to confirm bullish or bearish momentum.
Filtering Noise: The combination of Boltzmann weighting and EMA smoothing can help reduce the impact of sudden price spikes and yield clearer trend signals.
By blending the concepts of statistical mechanics with classic technical analysis techniques, the Boltzmann Weighted Moving Average provides traders with an innovative tool for revealing underlying market trends.
