DMI Candle ColorPaints the color of the candles in accordance with the DMI Histogram. Two colors are supported - one for DMI Histogram above zero and one for DMI Histogram below zero. Inputs for ADX Smoothing and DI Length are also supported.
Índice de movimiento direccional (DMI)

Trend-Following Combo-SuperTrend, EMA, Aroon, DMI, Laguerre RSIThis is a trend-following indicator which condenses two SuperTrend indicators -- one based on analysis over a shorter period of time (1.5, 7), and one based on analysis over a longer period of time (1.65, 100) -- into a single indicator which appears on your chart only when both the shorter- and longer-term analysis indicates a "SuperTrend" in the same direction.
Additionally, potential trade entry indicators are displayed in the form of up and down arrows when (by default) three of the following five indicators suggest that the market is trending in the same direction as both the shorter- and longer-term SuperTrend indicators:
EMA Crossover (8, 15)
Aroon Indicator (8)
Aroon Oscillator (8)
Directional Movement Index (DI +/-) (8)
Laguerre RSI (13)
You may update the parameters of any of the indicators to match your own preferences.
Additionally, you may also adjust the "Threshold" of indicators that must be in agreement with the SuperTrend to show a potential trade entry arrow. Bear in mind that if you set the Indicator Threshold too low, you will see more frequent trade entry arrows, many of which will not be profitable if taken. Similarly, set this value too high, and you will see fewer trade entry arrows that may not appear until after most of the "juice" in the trend has evaporated. Ideal values for the threshold seem to be between 2-4, depending on the symbol you are trading.
The following image shows all of the indicators referenced above on a 5-minute chart of the SPY during a single trading day:
And, here is the same period of time showing only the Trend-Following Combo indicator with default settings:
This indicator would not have been possible save for work contributed by the following:
SuperTrend by Rajandran R
Aroon w/ crossovers highlighted by seiglerj
Aroon Oscillator by jcrewolinsky
Directional Movement Index by TradingView
Laguerre RSI (Self Adjusting Alpha with Fractals Energy) by everget

Directional Movement Index + Average Directional IndexPersonal DMI and ADX script
ADX color change from positive vs negative momentum
DMI Color fill based on DMI+/- positive momentum
No fill color during lack of momentum

(JS)DMI BarsAlright - so this is my own version of John Carter's "10x Bars"... I have done multiple things that are different from his version so they are slightly different..
So first of all the main indicator is based off of the ADX and the DMI;
For those who aren't familiar with it, Directional Movement is what you'd pull up under "built-in's" from the indicators tab (if you want to check it out).
The standard interpretation of this however, is when the ADX is above 20 that suggests the trend is strong, whereas under 20 suggests it is weak.
Also, when the D+ is above the D- that suggests a bullish trend, and D- above D+ suggests a bearish trend.
These bars take away the need to have it at the bottom of your screen, and places the data on the bars on your chart instead.
=========================================================================================================================================
So here's what the colors stand for -
Yellow - The ADX is under 20, no strength in trend
Shades of green occur when the ADX is above 20 and there's a bullish trend (D+ higher than D-)
Bright Green (Lime) - Bullish trend, D+ above 30
Green - Bullish Trend
Yellow Green - Bullish trend, D+ below 15
Shades of red occur when the ADX is above 20 and there's a bearish trend (D- higher than D+)
Bright Red - Bearish trend, D- above 30
Red - Bearish Trend
Orange - Bearish trend, D- below 15
=========================================================================================================================================
I have also added multiple time frame labels (label script used is the one created by Ricardo Santos)
These labels are color coded the same as the bars/candles, and they appear off to the right of your screen using every built in time increment from TradingView.
The purpose is to show you in real time, and on any chart resolution, what the current trend is on every individual time frame.
So using just one single chart you'll see your current resolutions candles, but also on the labels you'll see:
1 Minute
3 Minute
5 Minute
15 Minute
30 Minute
45 Minute
1 Hour
2 Hour
3 Hour
4 Hour
Daily
Weekly
Monthly
There is an input I added that allows you to adjust where your labels appear on the side of your screen as well!
=========================================================================================================================================
Now onto the volume spike portion of the indicator. This will plot a blue dot under each bar that has a spike in volume which meets your specified criteria.
I have 500% as the default setting.
What that means is that this indicator looks back and gets the 50 bar volume average and then applies dots where volume is 500% above average.
=========================================================================================================================================
Now finally, the reversal arrows. This is another simple to understand concept that I first read in John Carter's book "Mastering the Trade" that he calls "HOLP/LOHP".
I have added the ability to change the look back period you'd like the indicator to watch for highs and lows on.
What that stands for is 'High of Low Period' and 'Low of High Period', and it is used like this-
Whenever a bar makes a new high the indicator watches the low on that highest bar. Then when a bar afterwards makes a lower low then the one on the high bar,
a reversal arrow is given. Apply this same concept in the other direction in for the highs on the lowest bars.
=========================================================================================================================================
Now, I didn't want to make a "set" or have a bunch of different indicators out there that are all intended for the same package, so I took the time to put them together,
and if there's a part of it you don't care for they can easily be turned off in the settings.
Enjoy!

Mawreez' Trend OscillatorA positive reading indicates an uptrend, a negative reading indicates a downtrend. For an uptrend, increasing values indicate that the trend is sustaining or strengthening while decreasing values indicate that the trend is stagnating or weakening. Vice versa for a downtrend. When the indicator reads 0, the price is not trending.
This indicator is based on the existing DMI indicator, but familiarity with the DMI is not required. The author's goal was to make a less laggy, more intuitively interpretable indicator compared to the DMI.
A comparison to the DMI is given above. The reader may see for themselves that trends are recognized quicker. A technical rundown of adjustments made to the DMI is given below.
Instead of interpreting the ADX, a sensitivity setting is added and its default value is 25. The value of this sensitivity setting is subtracted from the ADX. Then, any ADX values which fell below 0 are set to 0. Now, just flip the value of the ADX when the -DI is greater than the +DI. The result is then plotted as a histogram.
In addition, this indicator has less lag between price action and trend recognition. This is achieved by removing the EMA applied to the ADX, and instead applying lag-free smoothing to +DI and -DI before computing the ADX and then once more applying lag-free smoothing to the result of the computation.


MultiTime_ADX&DM_V1Wilders Directional Movement Index & ADX
With three different lines that you can change
With two Signals that you can turn on and off
When you change the lines, the signals also change
You can activate alerts depending on the signals
The displayed time frame is changeable

modified DMI with MTF and alertsThis is special indicator based on DMI , I add to time length MTF that is not repainting
you can change the MTF using int2 function
the alerts are based on crossing the 0 (up or down)
I hope you like it
with no MTF


DMI ADX TREND 2.0 (edit by GeertVD)Edit of the popular script by @TraderR0BERT
New features:
- horizontal colored areas, indication weak/medium/strong trend
- vertical bars, signaling trend/momentum changes
- DI+ vs DI- contraction/expansion histogram (to measure the DI volatility)

stoch rsi dmi plusSo in this indicator I put the improved DMI together with stoch rsi
the area in light blue are buy zone by the improved DMI
the area in light red are potential sell zone by the improved DMI
the green columns are stoch rsi crossing up
the red columns are stoch rsi crossing down

improved DmiThis is a new indicator that make the normal DMI better
insread of the ADX I put a volume indicator that have been transformed to be on regular scripts
with this it much more easy to spot the true buy and sell points by the DMI
have fun

Geek's DMINot an upgrade as much as a tweek.
DMI+/- are slightly smoother.
ADX was modified to be a field that is negative or positive, the value of which was multiplied to be highly visible.
Hope you like it.

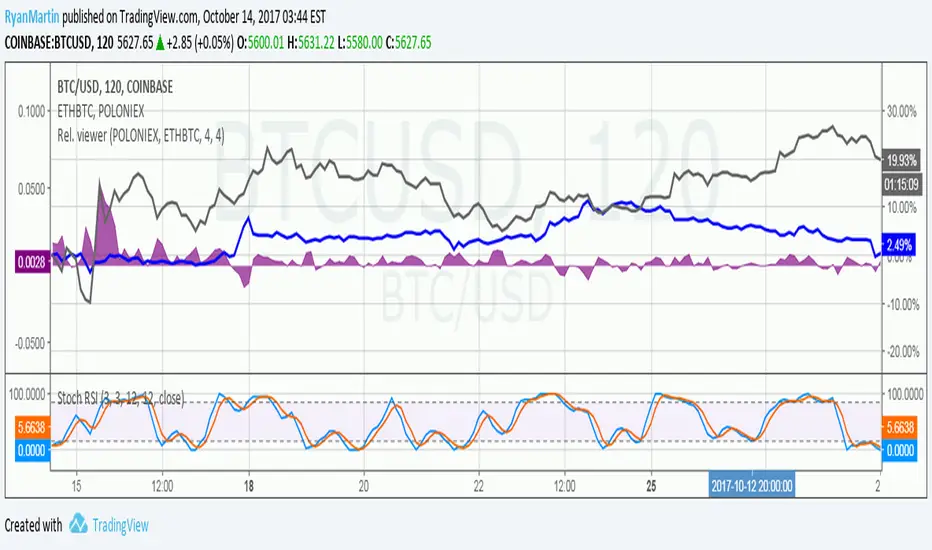
Price relation viewer - add percent change of two symbols (BETA)This script is very much beta!
This is a simple script to visualize how two symbols move in relation to each other. For example if the underlying symbol is a 2x Gold ETF (meaning the ticker moves at 2x the spot price of gold---if gold goes up 3% this ticker should go up 6%) and the comparison symbol is an 2x inverse gold ETF (at gold up 3% this should move down 6%). If these ETFs were 100% accurate at tracking the price of gold then this tool would report a value of zero at all times.
Day 1
Ticker - $10
Comparison - $10
Day 2
Ticker - $12
Comp - $11
This tool value - |20%| + -|10%| = 10%
It uses a short simple moving average to smooth things out a bit (see inputs). It is important to keep your axis scale in mind when using this! Two symbols that are always near zero mean they are offsetting each other very well but the value displayed might range from 0 to 0.005, but the graphed area can make it look extreme if autoscaled.
This is a tool with very specific uses : comparing how one digital currency moves in relation to bitcoin's price, comparing how gold moves in relation to silver, etc.
[INDICATOR]Renko Emulator OCC v1 by JustUncleLThis "Study" project has been created by request and is used in conjunction with the "Strategy" version.
*** EXPERIMENTAL ***
*** USE AT YOUR OWN RISK ***
Description:
Indicator based around Renko Bar Chart emulator (ATR) with direction change used to signal buy/sell trades.
I have generally found that setting the strategy ATR resolution to 3-5x that of the chart you are viewing tends to yield the good results, regardless of which chart time used. Positions get taken automatically following THE Renko Bar after a crossover.

Directional Movement Index 4 colors (DMI 4c)It is a normal Directional Movement Index, but instead of using lines for +DI and -DI it uses histogram and 4 colors. It also contains an horizontal line (default value @20) to indicate when a trend is confirmed or not.

Kay_BBandsV3This is the 3rd version of Kay_BBands.
When +DI (Directional Index ) is above -DI , then Upper band will be visible and vice-versa.
This is when the ADX is above the threshold. 28 is the default in this version. I found its more appealing in 5M time frame.
BLUE - ADX under 10
GREEN - Uptrend, ADX over 10
RED - Downtrend, ADX over 10
Use it with another band with setting 20, 0.6 deviation. Prices keeping above or below the 2nd bands upper or lower bounds shows trending conditions.
I didn't know how to update the old script so published it again.
Changes - :
1) Updated default settings for the indicator
2) ADX setting are now DI (28), ADX (10), adx level to check is 10.
3) IMPORTANT one - When DI is up/down, lower/upper band will also have color (more visible that way.)
Play around the settings.. It really eliminates extra indicator checking visually... Please like if you think idea is good.

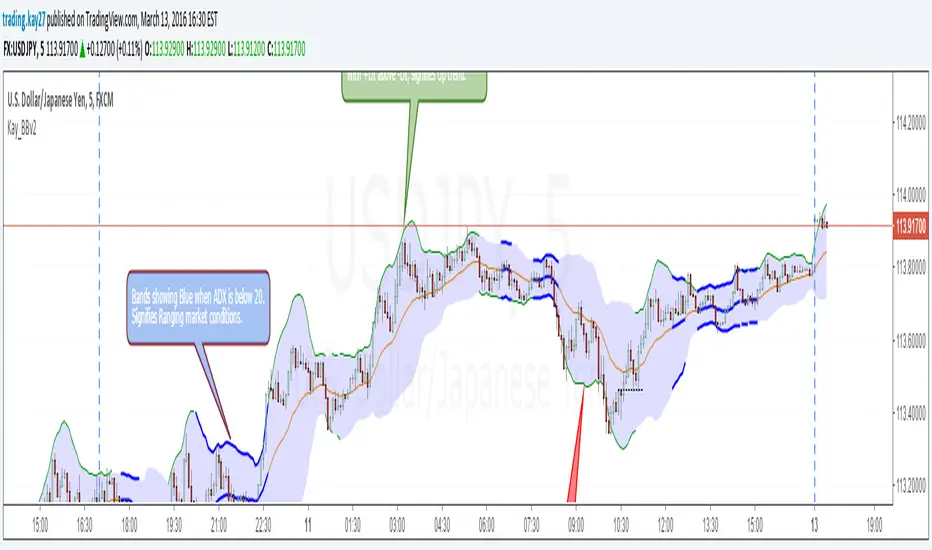
Kay_BBands v2This is the second version of Kay_BBands. But this is infused with ADX.
When +DI (Directional Index) is above -DI, then Upper band will be visible and vice-versa.
This is when the ADX is above the threshold. 20 is the default but can be set to 25.
When the ADX is below the specified threshold, both bands gets visible, showing no trending conditions.
Use it with another band with setting 20/21, 0.6 deviation. Prices keeping above or below the 2nd bands upper or lower bounds shows trending conditions.
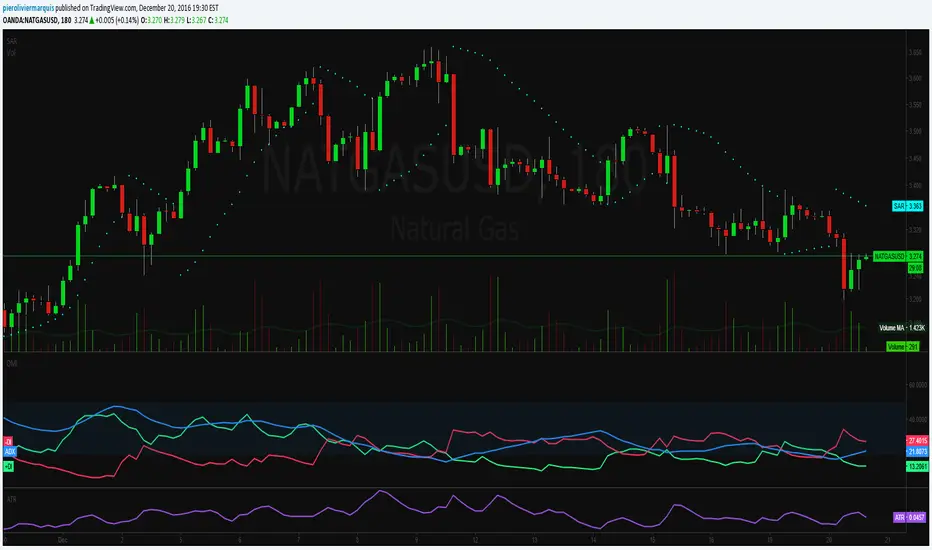
Directional Movement Index + ADX & Keylevel SupportADX and DMI oscillator with the keylevel coded in to the script, set for 23, suggested settings is 23 - 25 any trade with the ADX above the keylevel is a strong indicator that it is trending.

Directional Movement (DMI)Directional Movement indicator implemented in Pine script. Use it to customize ADX behavior.
