Cumulative Volume Delta [Aggregated]This Indicator is known as Cumulative Volume Delta (CVD), and it represents the total difference between buying and selling pressure.
This indicator use intrabar analysis to strike a balance between the most straightforward and accurate approaches of computing volume delta.
Intrabar analysis is the most accurate method to determine volume delta on historical bars on our charts when TradingView does not currently have historical tick data available.
What is included in the indicator:
Candle Type CVD
Line Type CVD
Aggregated Data which is derived from different exchanges
● Binance
● Bybit
● OKX
● Delta
● WooNetwork
You can choose between Aggregated Data or Single Data by choice.
Aggregated Data - Gathered Data from multiple exchanges which is summarize and became one.
Single Data - Data on your current chart.
Aggregated Data for CVD is still limited to BTC pair as of the moment. The indicator automatically switches to Single Data Type if the opened chart is not a BTC pair.
Candle Colors are fully customizable just like the Tradingview candle settings.
This indicator is mostly compatible to all Crypto.
NOTE: Most code is derived from my library to keep everything neat and clean.
Cumulativevolumedelta

Realtime Cumulative DeltaThis is a Real time volume Delta indicator which has to run real time on the chart to capture observation.
Start it when the session starts and log the data and observe. It plots histograms as well as candlesticks of the the cumulative volume delta, from the style switch whichever you want.
It is done based on real time tick and not based on candlesticks, so the accuracy of volume delta is more. Uptick volumes are added as buy and downtick volumes as sell which is the actual way of calculating CVD
Apply the CVD concepts for trading results.

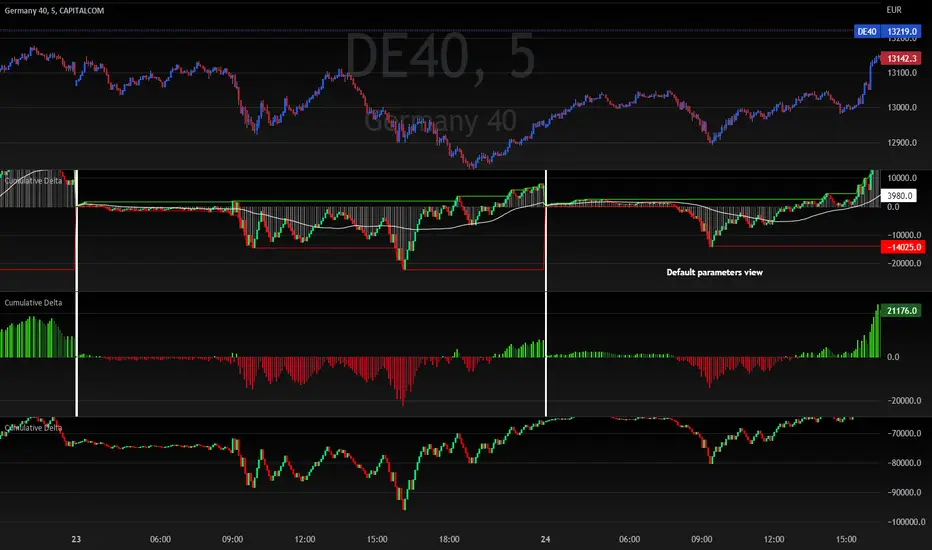
Cumulative DeltaThis scripts calculates the cumulative volume delta within the current day.
Options allow you to change the display type of this data (3 different configurations are given in the chart above)
The following options are available:
Colors selection
Reset cumulative delta everyday (can be disable to keep a continuous calculation of the delta over days)
Show histogram (used to display the delta as a positive/negative histogram)
Show daily High/Low levels (draw highest and lowest delta levels within the day)
Show candles (display the cumulative delta as candles)
Show Moving average (display a moving average which is reseted everyday at the same time as the cumulative delta itself)
Moving average length
This script will be updated if I feel the need to improve things or to add new features
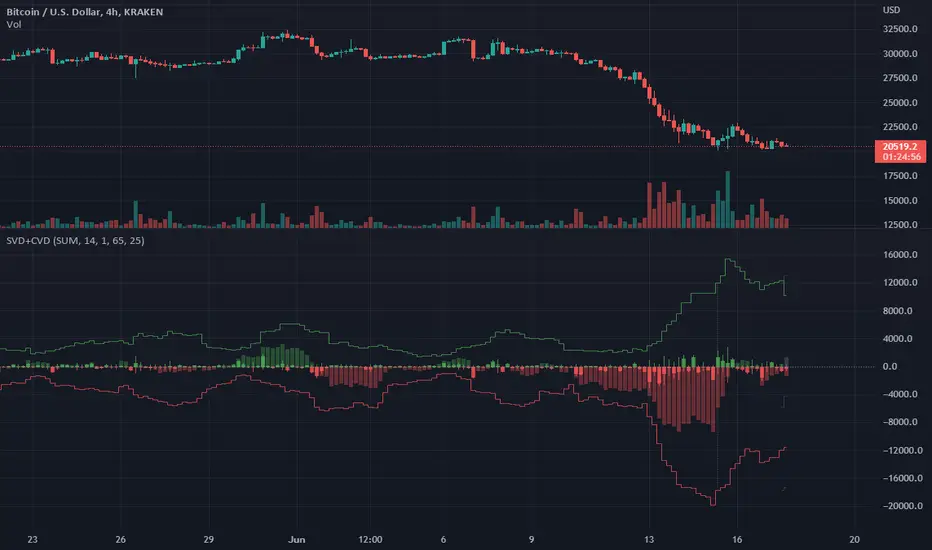
Singular and Cumulative Volume Delta (SVD+CVD)This a Volume Delta indicator with Cumulative Volume Delta.
I have been studying Volume Delta and CVD trading strategies and indicator styles.
This implementation was developed to test a basic trailing window / oscillator approach.
Script has been republished as public and searchable.
Changelog from private era follows.
Jun 9 (2022)
Release Notes:
Added option to use EMA/SMA based cumulation. This will not scale well with singular data, so default view is still SUM.
Jun 9 (2022)
Release Notes:
Outdated comment correction.
Jun 9 (2022)
Release Notes:
Added default option to normalilze visual scale of MA cumulation types. The averaging creates a singular value sized results, instead of a range-sums. This multiples that candle result by the range length to get a range-sum sized result.
Added option to scale the cumulation size relative to the volume size. 1-to-1 scaling creates singular deltas that can be hard to see with all options on. This allows you to beef them up for visual or weighting purposes.
Jun 15 (2022)
Release Notes: * Added break even level for current delta. Tells where current delta must land for cumulative delta to stay flat.
* Added comparison of historical cumulative levels to current level. The historical levels are the initial values going into current accumulation window.
* Changed title of indicator to be more generic, clear, and searchable.
Jun 15 (2022)
Release Notes: * Added option to have the cumulation cutoff line AFTER or OVER the end of the cumulation window. This change is to ensure the indicator clearly documents it's behavior and avoids confusion on this / last cumulation window semantics.
* Bugfix: Initial levels were pulled from cumulation line which was AFTER end of window. This has been changed to the initial values INSIDE the cumulation window.
* Code cleanup.
June 17th (2022)
Release Notes: Marked as beta because TV confirmed they no longer allow private scripts to be changed to public. (Despite lingering documentation that says otherwise.
June 17th (2022)
Re-published as public.
[VC] Cumulative Delta PLUS It is a Merged Version of our following two indicators.
V.C Box Chart Histogram
&
V.C Cumulative Delta Histogram.
We merged them at the user's request & convenience. This merged version also helps to save space for other indicators.
Description & Usage
Description & Usage will remain the same as described in individual descriptions of the above-mentioned parent indicators. Only one additional input is added to adjust the scale, named "Scale_Setting''.
Because now it's a merged version of 2 different indicators & both indicators have their different scale levels. To bring both indicators on an equal scale so that they can be visualised better, we have added scale adjustment settings that are easy to understand. Let's elaborate it.
Scale adjustment settings belong to the Cumulative length of the ' 'Cumulative Delta Indicator'' . Keep in mind that the best scale setting is keeping the scale setting values near or equal to cumulative length.
For example:
If you set cumulative length 20, the scale setting value should also be 20 or near 20 (like 17, 18, 19 etc.). (It depends on you, how large cumulative columns you want to see relative to Box chart Histogram)
Note: Any scale setting value can be used, it only affects visuals, not the actual calculations.
Disclaimer Note:
V.C Cumulative Delta Histogram It is purely Volume, Delta, Demand & Supply imbalance and comparative analysis-based tool. Before applying this Indicator to your study, you should clear your concepts about Volume, Delta & Spread, Demand & Supply, and Aggressive & Passive behaviour of buyers/sellers.
Some basic understanding of Sir Richerd Wyckoff's Theory can also be helpful.

[VC] Cumulative Delta Histogram V1.0The V.C Cumulative Delta Histogram shows the market's ongoing Buying/Selling pressure. It helps to determine whether Supply or Demand is dominating and in control.
➤If the Cumulative Delta Increases, the buyers are in control.➚
➤If the Cumulative Delta Decreases, the sellers are in control.➘
The use cases for this Indicator are vast and correlated with our other Delta Indicators. The following examples will explain how to use this Indicator.
Example 1 EUR / USD
In the above example, Negative Cumulative Delta Decreased & Turned into Positive Cumulative Delta. That indicates that sellers are losing control & buyers are getting power.
As a confirmation on the ' 'Box Chart Histogram'' it is evident that Demand is also increasing.
And on ''Wave Chart Index'' as a 3rd confirmation, you can see that the Delta has also increased compared to previous waves.
Example 2
Positive Delta on Cumulative Delta Histogram is decreasing & Negative Delta started increasing.
On the Box Chart Histogram , Demand is decreasing & Supply is increasing.
Additionally, on the Wave Chart Index , the Delta of the wave is also decreasing.
(in short, besides ''Cumulative Delta Histogram," Box chart Histogram & Wave Chart Index is also adding additional confirmation)
Note: Two types of Delta sources are included in this Cumulative Delta Indicator.
Type A: Simple Delta
Type B: Delta %
Simple Delta is the difference between Net Buying - Selling pressure.
Delta % also works in the same calculation, but a Volume weighted algorithm is applied on it.
You may use any of them that suits your analysis.
VC Cumulative Delta Histogram Settings & Inputs
Source:
Allows you to choose the source, Between Simple Delta & Delta %.
Cumulative Length:
Allows you to Change the cumulative length.
Positive & Negative Color:
It allows you to change the colors.
Style Menue
Allows you to change the style & color of the histogram.
Disclaimer Note:
V.C Cumulative Delta Histogram It is purely Volume , Delta, Demand & Supply imbalance and comparative analysis-based tool. Before applying this Indicator to your study, you should know about Volume , Delta & Spread, Demand & Supply, and Aggressive & Passive behaviour of buyers/sellers.
Some basic understanding of Sir Richerd Wyckoff's Theory can also be helpful.

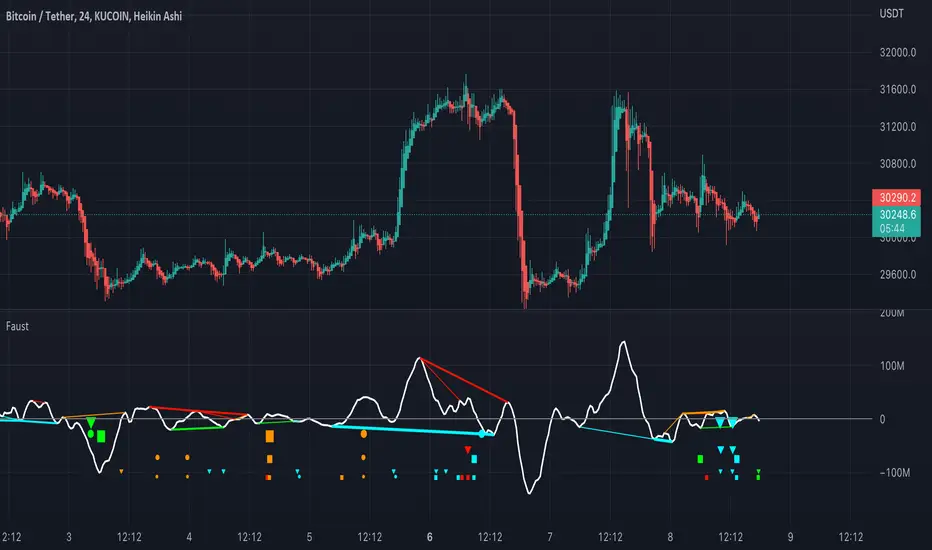
FaustFaust is a composite indicator that combines 3 volume indicators: TSV, OBV, and PVT.
TSV moving average is plotted as an oscillator. OBV and PVT are calculated internally.
Four divergences are calculated for each indicator (regular bearish, regular bullish, hidden bearish, and hidden bullish) with three look-back periods (high, mid, and small).
For TSV, the fattest plotted line is the divergence with the highest look-back period, and the thinnest line is the divergence with the shortest look-back period.
For PVT, the larger the circle, the higher the divergence look-back period.
For OBV, the larger the triangle, the higher the divergence look-back period.
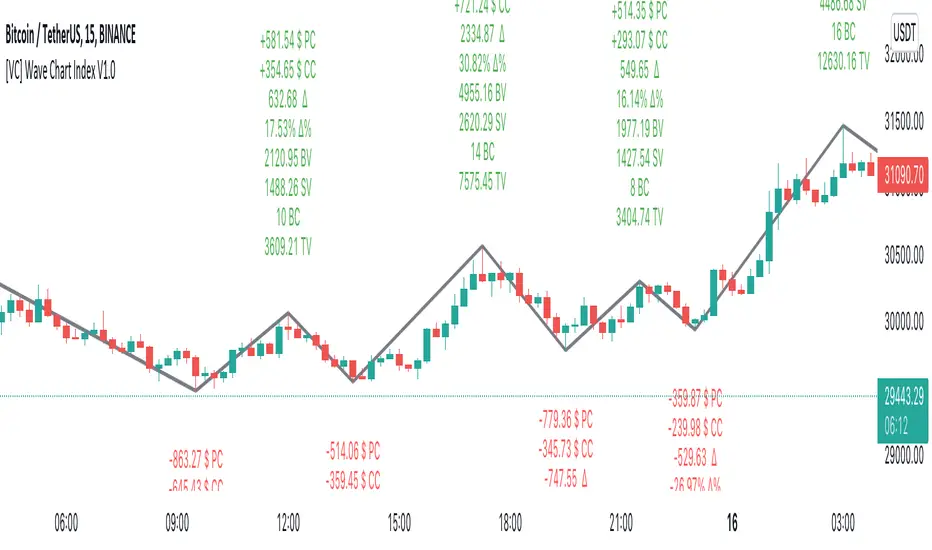
[VC] Wave Chart Index V1.0V.C Wave Chart Index
Richard D. Wyckoff created the first wave chart, and he instructed students to think in waves. He was an early 20th-century pioneer in the technical approach to studying the stock market and is considered one of the five "titans" of technical analysis, along with Dow, Gann, Elliott and Merrill.
V.C Wave Chart Index is the most comprehensive version of Wyckoff's theory. It is used to measure the strength & weakness of each market move by comparative data analysis. It draws waves on the chart based on Gann Swing theory. At the end of each wave, a label shows all the cumulative data & information of the wave.
With the help of this indicator, You can measure each swing or high/low movement of the market by comparing it with previous high/low price movements. The comparison can be made by using the following data of each wave.
Price Change
Volume Change
Delta Change
Delta % Change
Buy Volume
Sell Volume
Time Spent (Bar Counter)
V.C Wave Chart Index is not only an indicator but itself a unique & comprehensive tool kit to measure & compare each move of the market. This tool enables you to see deep inside each movement of the market. It allows you to observe the nitty-gritty data of each wave at the micro-level with your nacked eyes. With the help of Delta & (C.C) Close to Close Price Change, it is now easy to apply effort & result and cause & effect theory to your analysis. (total volume, buy volume, sell volume & delta % can also be used for comparative analysis)
V.C Wave Chart Index Properties
Price Change or (P.C): Shows the price Change of the Wave
Buy Volume (B.V): Shows the Cumulative Buy Volume of the Wave
Sell Volume (S.V): Shows the Cumulative Sell Volume of the Wave
Delta Volume (∆): Shows the Cumulative Buy - Sell Volume of the Wave
Delta % ∆ : Shows the Cumulative Delta % of the wave
Total Volume (T.V): Shows the Cumulative Total Volume of the Wave
Bar Count (B.C): Shows how much time it took to Complete the Wave
Swing Price: Shows the Reversal Price of the Wave
V.C Wave Chart Index Settings & Inputs Explained
Sensitivity (%): This input helps you adjust to the wave's steepness. 0.001 is my recommended value for all time frames.
Cumulation: This input helps you to control the length & formation of the wave: ( the fewer values = more wave formations & vice versa)
Wave Color: Allow you to change the color of the wave
Draw to Latest Candle: Allow you to show/hide the latest or real-time wave & data.
Divisor: Allow you to divide extensive numeric data into small numbers to read it easily.
Align Text: Allow you to align the text.
Size Text: Allow you to change the size of the text.
Display Toal Delta: Allow you to show or hide total Delta (∆).
Display Percentage Delta (%): Allow you to show or hide Delta (∆) %.
Color Wave Buy: Allow you to change the color.
Color Wave Sell: Allow you to change the color.
Display Total Volume (T.V): Allow you to show/hide total volume
Display Buy Volume (B.V): Allow you to show/hide buy volume
Display Sell Volume (S.V): Allow you to show/hide sell volume
Display Swing Price: Allow you to show/hide swing price
Display Swing Price Change (P.C): Allow you to show/hide price change
Display Close to Close Price Change (C.C): Allow you to show/hide close to close price changes. (previous wave close to current wave close) (recommended for comparative analysis)
P.C Format: Allow you to select the price formate
C.C Format: Allow you to select the price formate
Display Bar Counter (B.C): Allow you to show/hide the bar counter
Comparative Data Analysis Example in the light of Effort & Result Theory
A short explanation of the above analysis
On Wave A , the close to close price change (C.C) is $354 . (its the distance of price that price travelled from the low of the previous wave)
and price travelled this distance with 632 Delta (Delta is an effort which is used to travel the price)
On Wave B , close to close price change (C.C) is -$359 , almost the same distance as the previous wave. But for this distance price used 47% more Delta than the last wave. ( previous Delta is 632 , but current Delta is 931 that is 47% extra)
It indicates that sellers have put more effort in Wave B than Wave A . However, they got similar results as the previous wave. In other words
More Effort & Less Result = Reversal Sign
(that's why in the above example price reversed from a support level)
* Notice that Wave B is also on a key support area/level. And on key support or resistance area, this kind of comparative analysis can give an extra edge in your analysis.
Disclaimer Note:
V.C Wave Chart Index is not a BUY/SELL signal based indicator or a holy grail trading system.
It is purely Volume, Delta and comparative analysis based indicator. Before applying this indicator to your analysis, you should know about V.S.A, Volume, Delta & Spread.
Some basic understanding of Sir Richerd Wyckoff's Theory can also be helpful.
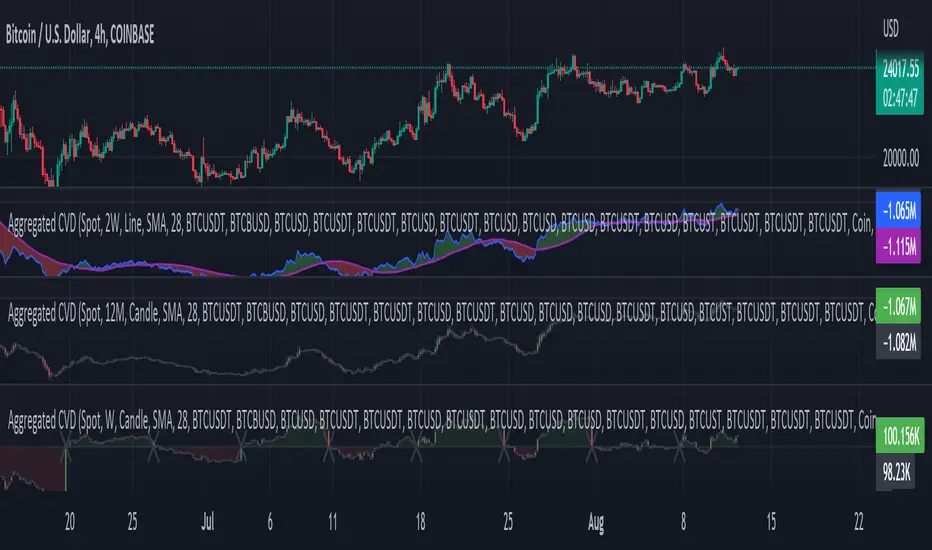
Aggr. CDV / Delta Volume - InFinitoModified & Updated script from MARKET VOLUME by Ricardo M Arjona @XeL_Arjona that Includes Aggregated Volume, Delta Volume, Volume by Side
Aggregation code originally from Crypt0rus
Candle Plotting code from LonesomeTheBlue
***The indicator can be used for any coin/symbol to aggregate volume , but it has to be set up manually***
***The indicator can be used with specific symbol data only by disabling the aggregation option, which allows for it to be used on any symbol***
- Calculated based on Aggregated Volume instead of by symbol volume . Using aggregated data makes it more accurate and allows to compare volume flow between different kinds of markets (Spot, Futures , Perpetuals, Futures+Perpetuals and All Volume ).
- As well, in order to make the data as accurate as possible, the data from each exchange aggregated is normalized to report always in terms of 1 BTC . In case this indicator is used for another symbol, the calculations can be adjusted manually to make it always report data in terms of 1 contract/coin.
All Aggregated Volume By Side: Based of Xel_Arjona's calculation, buy and sell volume is estimated each period. This indicators can display both Buy Volume and Sell Volume for each period.
Aggregated Delta Volume By Side: Displays the difference between Buy & Sell Volume as Delta (Down if Sell Vol - Up if Buy Vol)
Aggregated Cumulative Delta Volume: Displays the sum of Delta Volume as a line, candles or Heiken Aishi Candles. Great for observing Volume Flow and spotting divergences
- It is Possible to add an MA to the CVD and to color fill in between the indicator and the MA
- It is possible to reset the indicators basis to 0 periodically
Net Positions + SpaceManBTCNet Positions + SpaceManBTC
Includes 4 total features, for traders to help identify the positioning of participants.
Net Longs
Net Shorts
NL/NS
'CVD' Sessions
The indicator can be used to spot large positions occuring, e.g. large long positions, and how they can influence the market such as long positions opening towards a swing high can be seen, price moving away from said positions can lead to longs being squeezed when moving away.
Alternatively the diverging positions between Longs and Shorts can be useful,
This is bette represented in the 'CVD' replication feature.
The use of CVD can be done to show 3 things, Exhaustion, Absoprtion or strength.
Exhaustion and Absoprtion being shown with divergences.
Exhaustion in CVD is represented in, Higher highs in price but CVD produces a lower high (reverse for the opposite), this indicates a lack of participants in this case buyers which can signal a reversal.
Absorption in the case of CVD represented by, Higher highs in CVD but price produces a lower high, shows that aggressive buying and selling is being absorbed by the heavier hand in the market, limit orders. Likely reversion and has more weighting than exhuastion.
Strength can be represented with CVD following price e.g. an uptrend with higher highs and lows showing the same in CVD.

Delta Profile SpaceManBTCDelta Profile SpaceManBTC
Delta Profile SpaceManBTC, provides 2 very useful functions to tradingview traders with increased statistic for their candles in which case they can use to add confluence to their trading style.
Profile Types:
There are 2 main modes as it stands:
Delta Profile: Comes with the ability to show where buyers and sellers are stepping in more aggressively at which points to show a representation of trapped traders easier and aggression in the market.
Volume Profile: Can be used to do the same but in a more pure volume form, as well as allows for an ease in detecting a momentum shift.
Statistic Types: works with all modes
Ask/Bid Ask bid gives you the pure representation of that data showing at which points buyers stepped in and seller stepped in, no additional calculation on top.
Delta Delta shows the difference between, ie delta, for the ask and bid so its easier to view the difference at loss of the exact values used.
Volume Volume, shows the pure volumetric values no explanation of who buyers and sellers are allowing for a clean view of what is happening in the market with no code functionality applied.
The statistics are not isolated to their desired profile type as this provides the ability to use the volume profile type and delta values and vice versa, allowing users to choose which UI representation they want but which data.
This allows users to get both parts of the picture at any one time!
Using the tick data provided i am able to accurately caclulate the information, however this means for historical data there is none until the script is run for a period of time without stopping.
The tool is a method of providing flow data to the tradingview community, it can allow for good confluences at key levels of interaction E.G., key swing points/S/R points is when its accuracy for trading shines and can give you a good understanding of whats
happening at that time in the market.
Highly recommend dialing the ticksize manually. this provides greater consistency, auto ticksize was made for entry level users to quickly get a feel of the indicator but manually tuning to get the data you require without too much noise is very useful.
TO DO:
Sessions: accounting for Asia,Europe and North America
Tick based candles. e.g number of ticks before a new candle is generated.

Delta Continuum SpaceManBTCDelta Continuum SpaceManBTC
This is a tool that ive made with a brand new code base, to assist traders of all timeframes.
The new version of this tool makes use of the intra data to collect the tick for tick data that can be provided, this allows the provisioning of orderflow on tradingview.
Using a calculation of pure tick data and volume calculations, the display is created allowing the means to display a bid and ask seperation functionality to show the trades taking place in a market.
Taking account for this real time data it can show the exact moments a market participant is taking a trade.
This tool is an advanced way of determining the levels of which point is being interacted with to display the points at which a seller has stepped in to interact with a level, providing additional confluences when taking a trade.
Typically the best use case for this indicator is to see when their is a point of trapped traders in the trade, e.g. late longing resistance or late shorting support. Works best on futures contracts due to the high levels of execution volume in comparison.
Highly recommend dialing the ticksize manually. The ticksize for this indicator is best used manually as it allows for greater consistency when seeing who is participating at what level, as auto ticksize,
focuses on the volatility of the previous candle to display some data for the current candle. Now this will make it easier to use, it can reduce the consistency of the indicator when providing data.
Autoticksize will still be useful and will provide some confluence to the new flow traders.
to generate the data the candle must be the realtime candle and will not generate for historical candles, however this data for the real time candle will be only generated from the exact point in time to which the candle is loaded.
The indicator can show both the bid/ask split but alternatively the user can choose to just show the delta instead for ease of viewing.
TO DO:
Release the ticksize candles, to allow for tickbased charts and not just time based.

Realtime Volume Stats Panel w Delta, Buy/Sell%, Cumulative DeltaWhat is it?
Displays several realtime volume stats for each bar/candle.
Although it was originally created to be an assist tool for the Market Footprint (available as a separate indicator) to consolidate the numbers into a neat panel below, it can be used independently as an Orderflow Analysis tool as well.
It currently displays the following:
(1) Net Delta Volume for the bar; (2) Total Volume for the bar; (3) Cumulative Delta Volume for bars plotted up till this point (i.e., from the time the tool started collecting realtime data);
(4) Buy Volume for the bar as a percentage of the total volume for the bar; and, (5) Sell Volume for the bar as a percentage of the total volume for the bar.
All labels/colors etc. are configurable to suit your aesthetics.
All data are ONLY AVAILABLE FOR REAL-TIME BARS. The longer you keep a chart open with the study enabled, the more data it collects and displays, and the better your analysis can potentially be.
Note that the data gets reset every time (a) any of the options is changed, (b) the market is switched, (c) the browser is refreshed, or (d) the script is reloaded
DATA ISN'T STORED. I.e., every time a new symbol is loaded, the previous symbol's data is lost. So if you intend to monitor a symbol closely, you would need to keep it loaded all the time (and without tinkering with any of the Settings).
Who is it for?
For ultra short term traders who are used to looking at short term auction orderflow (and price action) to catch buy/sell anomalies and accurate trade entries
For traders who are already using Market Footprint but want the volume stats to be displayed on the bottom pane making for a cleaner interface.
For traders (, irrespective of their method of trading,) who wish to understand what is happening under the hood when a certain price action unfolds. (Who is in control, who got trapped, what does liquidity or the lack thereof look like, etc.)

ETS Prox Cumulative Volume Delta BBThis script is based on the work originally done by kprsa for the Monster Cumulative Delta indicator, but adds Bollinger Bands and upgrades it to version 4 from version 1.
It is an approximation of the Cumulative Delta Volume that is usually based on volume differences between market and limit orders, but because that data is not available, this indicator allocates a portion of the volume of a candle to the "upward" and "downward force" of each candle.
The upward force of a "Buy" candle is calculated by the High-Low
The downward force is calculated by (High-Close)+(Open-Low)
"Sell" candles are calculated in the same way just opposite
Total force=up force + down force
Up volume approximation = candle volume * up force/total force
Down volume approximation = candle volume * down force/total force
The result is similar to OBV, but not exactly the same, and allows for a "candle size" which you can't get with On Balance Volume.
I had never used a Cumulative Delta Volume indicator before, but when I started using it myself, it proved very effective when there was a deviation from price. It was also very effective in my opinion when Bollinger Bands was added to assess the standard deviation of the CDV compared to the Bollinger Band of price and looking for areas where the CDV reaction to hitting or getting close to the BB was different.
I hope you find it useful! Of course, it comes with no guarantee of profits or any investing advice whatsoever.
Recent Trades - Real-Time Volume AnalysisRecent Trades - Real-Time Volume Analysis 📈
Another orderflow tool to add to the arsenal.
It works with trading pairs with volume data (i.e. it doesn't work for price indexes).
It is independent of the chart timeframe.
The interval can be set to a value between 1 to 1440 minutes (check settings).
It is possible to choose a different symbol than the one on the current chart (check settings).
This makes it easy to analyze multiple pairs at once .
Volume Chart
The Volume Chart shows the last 100 trades.
The chart scale can be either standard or zero-centred, and it can be compact or take the whole main chart area.
Trades Counter
The Trades Counter shows the Ratio of Buys and Sells for the chosen interval.
The % Percentage value for Buys & Sells, the trades Size and their number are also shown.
Trades Feed
The Trades Feed can show up to 50 recent trades (check settings).
The Trades can be filtered by min & max limits.
Set min & max values and type of trade to filter the Large Trades. They can be highlighted in the feed.
The Trades Feed colours may not work on some OSystems (e.g. Mac). It can be fixed in settings.
▪ Available trade info:
- elapsed Time since the trade was recorded
- Price at which the trade was executed
- Size of the trade
▪ Various Metrics are available at the bottom:
- Chosen Interval
- Chosen Symbol (Exchange & Pair)
- CVD direction
- Volume Delta amount
- Buys & Sells Ratio
- Total Trades and their Speed
- Total Volume and its Speed
- Number of Significant Trades, their % Percentage and their Speed
- Total Significant Volume, its % Percentage and its Speed
▪ The Numbers are formatted for better reading.
▪ Alerts:
- CVD direction change (⚠️this can trigger too often)
- Ratio level +/-
- Buy Volume - % Percent
- Sell Volume - % Percent
- New Trade (⚠️this can trigger too often if the volume is not filtered)
- Trades - Speed Limit
- Volume - Speed Limit
- New Large Trade
- Large Trades - Speed Limit
- Large Volume - Speed Limit
- Large Trades - % Percent
- Large Volume - % Percent
▪ ⚠️Some metrics can have abnormal values at the start of the interval.
To avoid triggering alerts in such conditions, set the number of seconds to wait before checking whether they should fire.
▪ Note:
- Initially, the Recent Trades panel is positioned to the far right of the chart, so it may be hidden in the future. Drag the chart to the left to reveal it.
- The panel Position can be adjusted in settings.
▪ Related Studies:
- Volume Delta
- CumulativeVolumeDelta-CVD
- Counters Ratio
- Heatmap-Support-Resistance-Volume-Clusters
▪ Some layout examples:

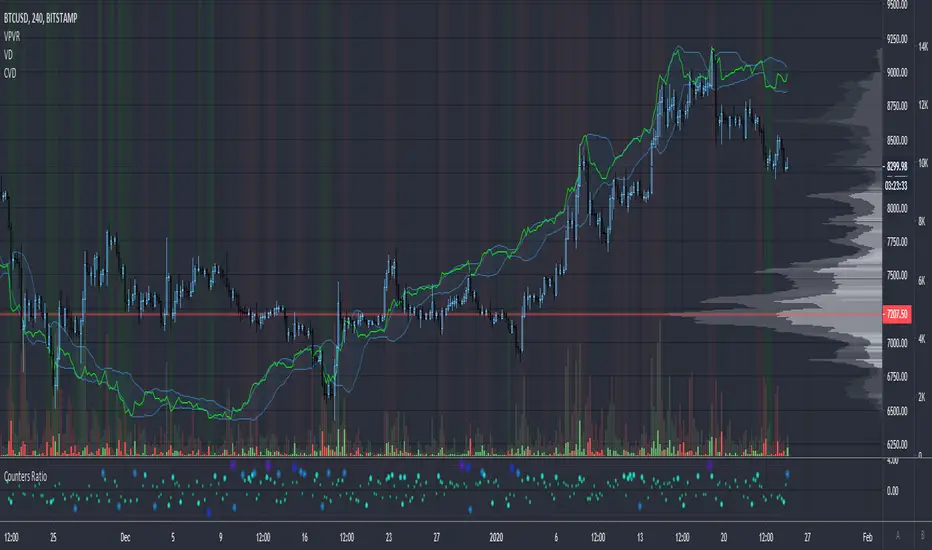
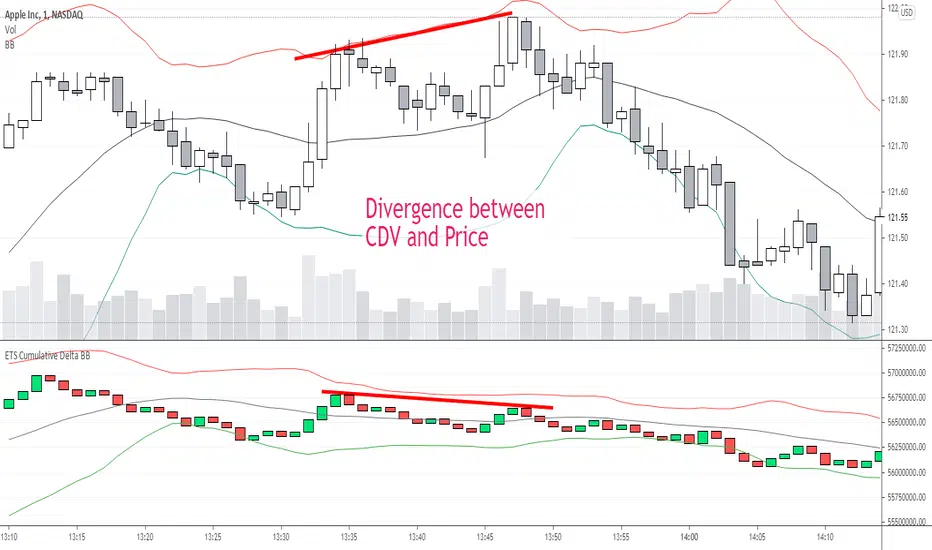
[astropark] Cumulative Volume Delta (CVD)Dear Followers,
today another awesome Analysis Tool, that you can use in your trading journey: Cumulative Volume Delta (CVD) , also known as Cumulative Delta Volume (CDV)!
Volume says a lot about price action:
price drops with low volume? or price pumps but no volume increase?
big sellers volume but price does not drop? or big buyers volume but price does not increase?
The Cumulative Volume Delta measures the effectiveness of buyers and sellers' actions, so basically if the volume they generate with their buy and sell market orders is effective on price or not.
When it's not effective, a divergence appears and we, as traders, can profit from it.
Here some examples how you can use the indicator by spotting divergences between price and cumulative volume delta.
EURUSD, 15m
sellers trying hard to make price fall, but volume is lacking on CVD (exhaustion): bullish divergence
EURUSD, 15m
buyers trying hard to make price go up, but volume is lacking on CVD (exhaustion): many bearish divergences
SPX500, 15m
buyers exhaustion: bearish divergence
XAUUSD, 15m
sellers exhaustion: bullish divergences
XAGUSD, 15m
buyers exhaustion: bearish divergence
BTCUSD, 15m
buyers exhaustion: bearish divergence (in red)
buyers absorbed sellers' pressure: hidden bullish divergence (in green)
BTCUSD, 15m
inefficiency by buyers: higher and higher buy volume but it's not effective on price (sellers absorbed): hidden bearish divergence (in blue)
sellers exhaustion: bullish divergences (in green)
buyers exhaustion: bearish divergence (in red)
ETHBTC, 15m
buyers exhaustion: bearish divergence (in red)
inefficiency by sellers: higher and higher sell volume but it's not effective on price (buyers absorbed): hidden bullish divergence (in blue)
TSLA, 15m
inefficiency by sellers, sellers pressure absorbed by buyers: hidden bullish divergence (in blue)
buyers exhaustion: bearish divergence (in red)
sellers exhaustion: bullish divergence (in green)
inefficiency by buyers, sellers pressure absorbed by sellers: hidden bearish divergence (in fuchsia)
This indicator works on every timeframe, market and pair, by the way must be said that it works best on 15m and 5m timeframes, as you can have access to a more detailed volume information.
As I always say, all tools are great if you use them correctly: this is not the "Holy Grail", so always use proper money and risk management strategies.
This is a premium indicator , so send me a private message in order to get access to this script.

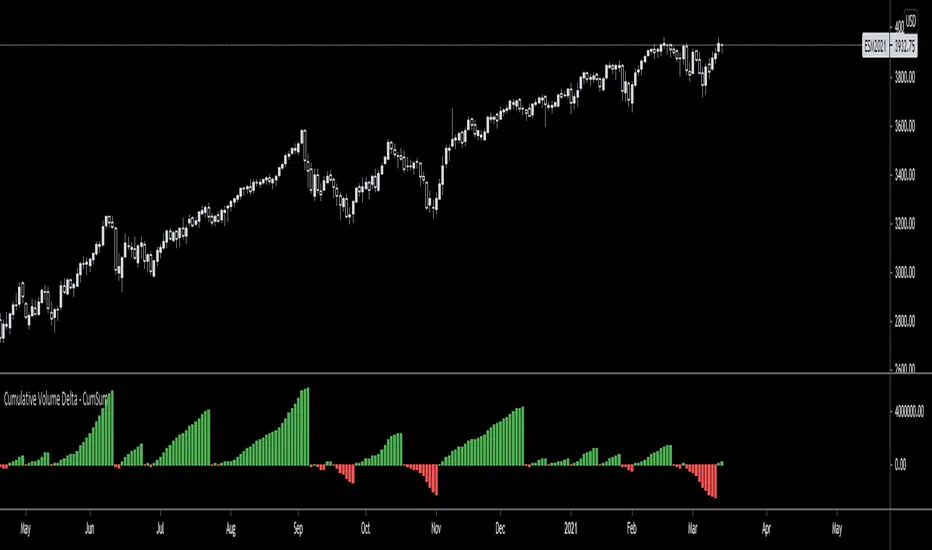
Cumulative Volume Delta - Cumulative SumCumulative Volume Delta but resets if there is a change in volume between buyers and sellers.
[co.n.g] - Simple CVD over MAThis Single Volume Delta (SVD), respectively Cumulative Volume Delta (CVD) is a really simple script computing the difference of the volume of the actual in comparison the the volume of the "Calculation Bars Threshold", calculated by smoothing through a simple moving average - the "CVD MA Smoothing".
Therefore, if the "Calculation Bars Threshold" and the "CVD MA Smoothing" are set to 1, the script will display the difference of the actual compared to the previous candle;
furthermore, if the "Calculation Bars Threshold" is set to 3 and the "CVD MA Smoothing" is set to 14, then the indicator will display the the summed difference of the past 3 values, smoothed over a period of 14 candles.
This indicator may also be set to a different time frame, allowing multi time frame analysis; f.e. if you're going to set a lower time frame than the actual, the deltas of the lower time frame will be displayed and will be showing the volume trend of the lower time frame; if you're going to set a higher time frame, this is respectively working as described.
To understand volume and price action, it is - imho - especially helpful to display the volume of higher time frames to visualize the "Where the heck am I and what are the big players doing?"
This indicator is coloring the histogram in green as positive, red as negative and gray as indecisive CVD.
Hopefully, this will be helpful in your VSA and your trading decisions.
Cheers,
Constantine
p.s.: I am also working on a far more sophisticated version of SVD/CVD, so stay tuned!

Cumulative Volume AverageHey traders!
I've received dozens of requests for this style of Cumulative Volume indicator over the past year since I released my RVOL By Time and standard RVOL indicators.
After studying Pine Script deeply and using a bit of old fashioned trial and error over the past few months, I finally got it to work!
This script adds up the cumulative volume throughout any given trading day (the blue & green volume bars) on any given intraday timeframe on any given market - and then it compares that cumulative volume value to the total volume of the previous day AND the average cumulative volume of the previous X days for whatever time of day the current bar is printing on.
By default it compares today's cumulative volume to yesterday's, but you can set the Lookback higher in the settings menu if desired.
It even takes into consideration random gaps in price action (unlike my RVOL By Time indicator) – so as far as I can tell, it’s as accurate as I can possibly make it.
However it does not work on extended hours for stocks so don’t use it if you have pre-market hours enabled. And there is an inbuilt limitation to how many bars a script can reference on TradingView, so on 5-minute timeframes and lower your Lookback period will be limited and may crash the script if you set it too high.
The PURPLE LINE is the total volume of the previous day.
The GRAY COLUMN is the average cumulative volume of the previous X days.
The COLORED COLUMN is the current cumulative volume for the current bar.
The BLACK LINE is the Previous Cumulative Volume Line which represents the average cumulative volume for the past X days. It only draws if today’s CV exceeds the average – this is useful for comparing exactly how far today’s cumulative volume exceeds the average, but it can be turned off in the Style menu if you don't want it there.
The ORANGE NUMBER is the ratio of today's CV compared to the average (CV ÷ Average CV).
If the current cumulative volume is less than the previous day's cumulative volume for that time of day, the bar is blue.
If the current cumulative volume is greater than the previous day's cumulative volume for that time of day, the bar is dark green.
If the current cumulative volume is greater than the previous day's total volume, the bar is bright green.
This script also comes with alert functionality.
You can set a Cumulative Volume Alert which will trigger an alert if the current bar's cumulative volume exceeds the average cumulative volume for that time of day.
You can also set a Total Cumulative Volume Alert which will trigger an alert only if the current bar's cumulative volume exceeds the total volume of the previous day.
And you can set a CV Ratio Alert which will trigger an alert if today's CV ÷ Average CV >= Specified Ratio.
Apart from that, the script is fairly self-explanatory so I hope you enjoy using it!
Check my signature for a link to the source code + all my other indicators.
Good luck with your trading, and feel free to drop any suggestions or bug reports and I'll do my best to help out :)
Kind regards,
Matthew

Cumulative Delta (Zeiierman)█ Overview
Cumulative Delta (Zeiierman) transforms raw volume and price data into a continuous buying and selling pressure narrative. Instead of treating volume as a static total, it accumulates the net delta (buying vs. selling activity) bar by bar, revealing whether real demand is supporting or contradicting price movement. This tool bridges microstructure-based order flow concepts with high-level market trend modeling, offering a refined look beneath traditional candles.
The indicator visualizes cumulative trade imbalance over time, layering it with adaptive confirmation lines, impulse recognition, and trend filtration. The result is a refined map of volume–price interaction that identifies hidden strength, fading momentum, or early accumulation before visible reversals occur.
This tool is designed for multi-context use — intraday scalping, swing confirmations, or structural bias analysis — offering a precise view of participation flow beneath price behavior.
⚪ Why This One Is Unique
Unlike conventional delta indicators, this version incorporates adaptive smoothing, multi-source delta modeling, and contextual confirmation layers that dynamically adjust based on both volume and price displacement. Its framework is powered by a volume re-normalization algorithm, combined with multi-dimensional weighted mapping between price flow, volume imbalance, and trend inertia.
█ Main feature: Cumulative Delta Candle
The Cumulative Delta Candles visualize how each bar’s internal buying vs. selling pressure builds over time. They represent volume-weighted displacement vectors of market aggression — when buyers dominate, the delta accumulates upward; when sellers dominate, the cumulative curve decays. Signal and confirmation overlays transform this raw delta motion into a structured view of market conviction, helping traders identify early inflows, exhaustion points, or continuation pressure.
█ How to Use
⚪ Trend Following
The Cumulative Delta is an effective tool for identifying who controls the market trend. When delta candles remain above the midline, buyers are in control. Conversely, when delta candles stay below the midline, sellers dominate.
Strong trends are identified when delta candles consistently cluster near the upper or lower levels, indicating sustained directional pressure in that trend’s favor.
⚪ Fading Momentum
The delta can also be used to detect waning momentum. If delta candles are above the midline but turn red with a declining slope, it signals that the current bullish move is losing strength.
If delta candles are below the midline but turn green with an upward slope, it suggests that bearish momentum is weakening.
⚪ Pullback Trading
To identify pullbacks, combine the overall trend of the Cumulative Delta candles with the Signal Line. Set the Signal Line length to 2 to create a fast-reacting delta line suitable for pullback detection.
Bullish Pullback
When the Cumulative Delta remains above the midline or near the upper level, and the Signal Line briefly dips below the midline or touches the lower level before sharply reversing upward, it signals a bullish pullback within an ongoing uptrend — a potential buy opportunity.
Bearish Pullback
When the Cumulative Delta stays below the midline or near the lower level, and the Signal Line briefly rises above the midline or touches the upper level before sharply turning downward, it indicates a bearish pullback within a downtrend — a potential sell opportunity.
⚪ Momentum Trading
Impulse Dots highlight sudden bursts of momentum in either direction.
When they appear around key breakout levels, they may signal the start of a strong move or breakout. However, if impulses appear after an extended trend, they often indicate potential exhaustion or reversal.
Always evaluate impulse signals within the broader market context to confirm their validity.
⚪ Up-Tick and Down-Tick Signals
The Up-Tick Signal confirms a possible shift or strengthening in bullish order flow. It frequently appears near local swing lows, suggesting increased buying pressure.
The Down-Tick Signal confirms potential bearish order flow. It often forms around local swing highs, signaling growing selling pressure.
⚪ Volume Signals
Volume Signals are derived from delta activity to help traders identify volume-based trend entries. They occur only in confirmed trends and serve as trend continuation triggers.
Bullish Volume Signal: When triggered, enter at candle close and use the built-in trailing stop to manage risk. Exit the trade when the Signal Line crosses below the midline again.
Bearish Volume Signal: When triggered, enter at candle close and use the trailing stop to follow the move downward. Exit the trade when the Signal Line crosses above the midline again.
█ How It Works
⚪ Delta Accumulation
Each candle’s internal buy/sell pressure is estimated using a price–volume ratio model. The resulting delta is accumulated over time to form the Cumulative Delta Curve, showing whether buyers or sellers are in sustained control. Users can select Estimated, Volume Data, or Enhanced modes to align the delta calculation with their preferred market source.
Calculation: Applies Cumulative Delta Integration — a continuous summation of signed volume over time with conditional price weighting. This produces a running measure of net buying or selling activity that evolves dynamically with market flow.
⚪ Signal & Confirmation Lines
The Signal Line reacts faster, acting as a short-term direction probe. The Confirmation Line lags slightly, validating the persistence of the delta trend. Crossovers between these lines frequently precede structural price rotations.
Calculation: Implements Multi-Phase Weighted Moving Functions, layering WMA/EMA structures to control smoothness and minimize phase lag between the fast and slow components.
⚪ Impulse & Momentum Bursts
The Impulse Engine detects statistically significant bursts in delta energy — high-magnitude expansions that often precede breakouts or reversals.
Each impulse is colored according to directional bias, helping visualize moments of strong conviction or exhaustion.
Calculation: Uses Impulse Response Functions, nonlinear filters that measure delta acceleration (Δ²δ/Δt²) to isolate momentum shifts and highlight transient bursts in order flow intensity.
⚪ Trend Layer & Filter
A built-in trend filtration algorithm ensures that bullish and bearish signals only appear when aligned with the dominant trend. The Trend Tolerance setting controls how much short-term noise the filter allows before declaring a trend change — effectively balancing agility vs. stability.
Calculation: Applies Trend Vector Regression, estimating directional slope and deviation using log-based least squares modeling to extract the dominant directional vector from noisy flow data.
⚪ VWAP–EMD Trend Core
The main trend estimation engine fuses Volume-Weighted Average Price (VWAP) logic with an Empirical Mode Decomposition (EMD) smoother, creating a non-linear, adaptive response curve. This enhances directional clarity while preserving microstructural sensitivity to shifts in flow balance.
Calculation: Constructs a VWAP–EMD Composite Curve, merging volumetric centroids with intrinsic mode decomposition for adaptive mean tracking and dynamic equilibrium modeling.
⚪ Trailing Stop & Risk Structure
Once a volume-based entry signal appears, a dynamic trailing stop is automatically drawn. It adapts to volatility and follows price movement, helping visualize optimal exit zones, stop hits, and locked profit regions.
█ Any Alert Function Call
The Any Alert Function Call system transforms the indicator into a programmable alert engine:
Combine multiple triggers (Crossover, Trend Flip, Impulse, Tick, TSL Hit, Volume Signal).
Detect slope, midline, or same-direction confirmations.
Customize messages with placeholders like {{ticker}}, {{close}}, {{volume}}, and {{time}}.
Build complex conditional alerts — such as Bull Volume Signal → TSL Hit — without editing the code.
-----------------
Disclaimer
The content provided in my scripts, indicators, ideas, algorithms, and systems is for educational and informational purposes only. It does not constitute financial advice, investment recommendations, or a solicitation to buy or sell any financial instruments. I will not accept liability for any loss or damage, including without limitation any loss of profit, which may arise directly or indirectly from the use of or reliance on such information.
All investments involve risk, and the past performance of a security, industry, sector, market, financial product, trading strategy, backtest, or individual's trading does not guarantee future results or returns. Investors are fully responsible for any investment decisions they make. Such decisions should be based solely on an evaluation of their financial circumstances, investment objectives, risk tolerance, and liquidity needs.
Script de pago

Cumulative Volume Delta (CVD)Cumulative Volume Delta or simply CVD is the accumulation of the Total Volume Delta .
It starts accumulating from the beginning of the available volume data.
It only shows meaningful information for symbols with volume data.
It does not change its shape when changing timeframes.
How to use it:
You can start using it by searching for divergences with the price.