🔮 Mayer Multiple w/ MA Selection by Cryptorhythms🔮 Mayer Multiple w/ MA Selection by Cryptorhythms
Description
Introduced by Trace Mayer as a way to gauge the current price of Bitcoin against its long range historical price movements (200 day SMA by default), the Mayer Multiple highlights when Bitcoin is overbought or oversold in the context of longer time frames.
It`s worth noting as the market becomes larger and less volatile, the peaks are becoming less exaggerated. This is because a 200 day moving average baseline is a static yardstick against an ever growing, more stable, Bitcoin market. We should eventually recalibrate what constitutes the overbought/oversold extremes on this chart accordingly.
Additional Features
I added a heatmap based coloring and background highlighting of configurable overbought and oversold zones.
In my testing I observed anecdotal evidence that a value of >1 signaled bull market sentiment and a value of <1 signaled bear sentiment. So I added the dashed line at that value.
I also added secondary zones for experimentation on other timeframes or just plain tinkering.
Lastly I added the ability to substitute the SMA for a few different types of moving averages.
Default Settings
The defaults zones are > 2.4 is overvalued and < 0.5 is undervalued. Default timeframe is daily
Default MA is SMA and default length is 200
Suggested MA length for weekly chart is 28
👍Enjoying this indicator or find it useful? Please give me a like and follow! I post crypto analysis, price action strategies and free indicators regularly.
💬Questions? Comments? Want to get access to an entire suite of proven trading indicators? Come visit us on telegram and chat, or just soak up some knowledge. We make timely posts about the market, news, and strategy everyday. Our community isnt open only to subscribers - everyone is welcome to join.
Cryptorhythms

🥢Crypto-Sticks: True Strength Index 1.0 by Cryptorthyhms🥢 Crypto-Sticks™ True Strength Index
A new series of indicators brought to you by Cryptorthyhms...giving you an alternate look at your trusted favorites!
🚀 Indicator Specific Info
Signal Line can be configured in options, but I personally prefer heiken candles to the signal line.
⛔Please remember that you may have to adjust the overbought and oversold levels to suit the volatility of the instrument you are working with. In the future I will implement a feature that does this automatically, but for now its manual.
The OB/OS zones are given in two levels, because often you can find a line of best fit that will hit "small movements" and one that will hit "big movements." In this case I chose 25 and -25 for the small zones. For the bigger zones I chose 50 and -50.
Heiken Ashi candles adds some more clear trend changing points which can be executed at the second candle going in either direction. Other coins/charts will require their own strategy - you could potentially have to tweak that parameter. In this example you would enter on 2nd green, exit on 2nd red. Here is the Heiken Ashi example:
Volume weighting the HA candles adds a different dimension to the indicator which I have to explore more fully. On this particular indicator it adds alot -1.51% more noise, and I dont particularly care for it, but YMMV. Example of what I mean:
💭Please leave me any ideas or feedback you have!
🚫If you use volume weighting you should be on heiken candles.
🚀 Crypto-Sticks General Info
🚧This series isnt polished 100%, and I have some more options I will add in the future. But for now, I want to just release them, as I am not sure when I will have the time to put more work into them (many other big projects I am working on).
📊Its basically reinterpretations of all your favorite indicators. I calculate the values a little bit differently than normal, but the end result is creating a candlestick chart (for the indicator!). Then I added the option to plot them as Heiken Ashi candles to smooth out noise and make signaling easier. I recommend using the indicator on this setting.
🔊Lastly I implemented a Volume Weighting system for them all which simply integrates volume into the formulas for these indicators. For the most part this feature is experimental and doesn't provide huge utility (yet - I have other ways I want to try it as well - just no time). Though on some of the indicators it already shows great promise.
👍Enjoying this indicator or find it useful? Please give me a like and follow! There are many more indicators to be released in this series, not to mention I post crypto analysis and other free indicators regularly.
💬Questions? Comments? Want to get access to an entire suite of proven trading indicators? Come visit us on telegram and chat, or just soak up some knowledge. We make timely posts about the market, news, and strategy everyday. Our community isnt open only to subscribers - everyone is welcome to join.

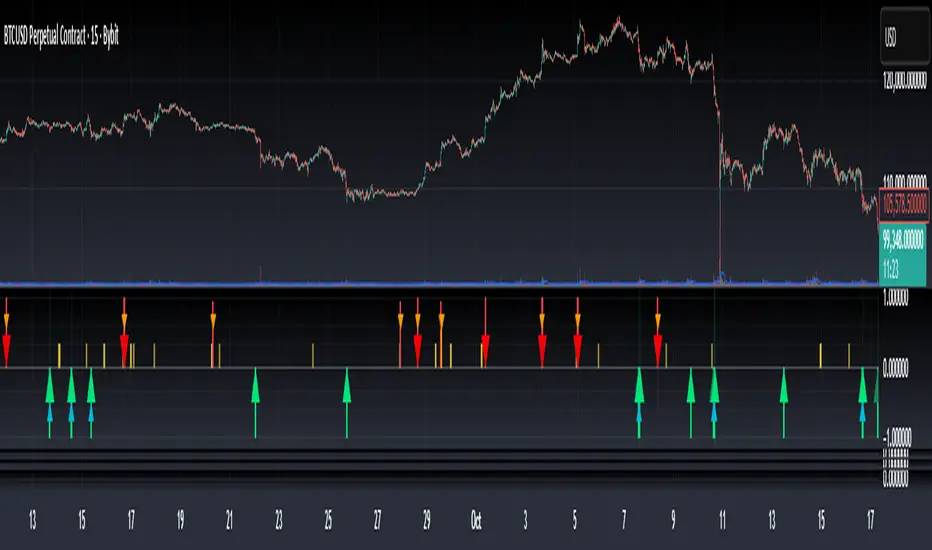
Bottom & Top Finder v3.0Bottom & Top Finder v3.0 is a proprietary multi-component oscillator designed to identify potential market reversals and extreme price conditions. The indicator analyzes momentum, volatility, and price behavior to generate bullish and bearish signals with strength classification.
█ OVERVIEW
Each signal is classified into three strength levels (Weak, Medium, Strong) allowing traders to prioritize high-conviction setups.
Signal Classification:
• Strong signals (±1.0): High conviction setups with multiple confirmations
• Medium signals (±0.6): Moderate conviction with key component alignment
• Weak signals (±0.33): Early warnings or preliminary indications
█ KEY FEATURES
Smart Signal Management
The indicator includes an intelligent system that allows signal sequences to complete naturally while preventing excessive noise. Unlike traditional cooldown systems that block all signals during a cooldown period, this implementation allows consecutive signals during a "run" and only applies cooldown after the signal run ends. This ensures complete multi-bar patterns are captured while preventing rapid flip-flopping.
Advanced Filtering System
Three optional filters allow adaptation to different market conditions:
• Volume Confirmation Filter: Validates signals against recent volume activity across a configurable lookback period. Checks if any bar in the lookback window exceeded average volume by the specified multiplier.
• Trend Alignment Filter: Four operational modes including With Trend, Counter Trend, Statistical Distance, or Off. The anomaly mode uses calculations to identify signals only at statistical extremes rather than simple directional bias.
• Signal Type Selection: Enable or disable weak, medium, and strong signals independently based on your trading style and risk tolerance.
Comprehensive Alert System
Ten distinct alert conditions cover every use case. Alerts include price level and timestamp, and are ready for webhook integration with automated trading systems.
█ HOW TO USE
Basic Setup
1 — Add "Bottom & Top Finder v3.0" to your chart in a separate indicator pane
2 — Optionally add "Bottom & Top Finder v3.0 - Chart Labels" for on-chart visual markers
3 — Configure lookback periods (defaults work well for most timeframes)
4 — Enable or disable signal strengths based on your trading style
5 — Apply filters as needed to reduce noise in your specific market
Signal Interpretation
Histogram magnitude indicates signal conviction. Multiple signal types can fire simultaneously and are aggregated into the composite score.
Alert Configuration
Set up alerts through TradingView's standard alert system using the built-in alert conditions. Choose from individual signal types (for specific setups) or aggregate alerts (for broader monitoring).
Recommended Approach
• Combine indicator signals with price action and support/resistance analysis
• Use strong signals for entries, weaker signals for early warnings or exits
• Enable filters when trading liquid markets with reliable volume data
• Adjust cooldown period based on timeframe: lower for active trading, higher for swing setups
• Start with default settings and adjust based on backtesting results
█ SETTINGS
Lookback Settings
• Main Lookback Period: Primary calculation period for most components (default: 21). Lower values increase sensitivity, higher values smooth signals.
• Range Lookback: Extended lookback for range high/low analysis (default: 50). Affects extreme condition detection.
Signal Settings
• Enable Weak Signals: Toggle weak signal detection (default: on)
• Enable Medium Signals: Toggle medium signal detection (default: on)
• Enable Strong Signals: Toggle strong signal detection (default: on)
Filter Settings
• Enable Volume Filter: Require volume confirmation (default: off)
• Volume Lookback: Period to check for volume spikes (default: 30)
• Volume Spike Multiplier: Threshold above average volume (default: 1.3x)
• Trend Filter Mode: Off, With Trend, Counter Trend, or Anomaly (default: off)
• Trend SMA Period: Moving average period for trend calculations (default: 50)
• Anomaly Threshold: Minimum statistical deviation for anomaly mode (default: 1.5)
Display Settings
• Show Composite Histogram: Toggle main histogram display (default: on)
• Show Signal Bars: Toggle triangle markers in indicator pane (default: on)
• Show RSI Reference: Overlay normalized RSI for context (default: off)
█ TIMEFRAME CONSIDERATIONS
The indicator works on any timeframe from 1-minute to monthly charts. However, optimal performance requires timeframe-appropriate configuration:
Shorter Timeframes (1m-15m)
Consider reducing main lookback period for increased responsiveness. Volume filter may be less reliable in some markets during low-liquidity sessions.
Medium Timeframes (1H-4H)
Default lookback periods are optimized for these timeframes. Volume and trend filters provide good noise reduction.
Longer Timeframes (1D+)
Consider increasing lookback periods for smoother signals. Filters are highly effective at these timeframes.
█ BEST PRACTICES
Risk Management
This indicator is a technical analysis tool designed to identify potential reversal zones and does not guarantee profitable trades. Users should:
• Understand that signals indicate potential setup zones, not guaranteed outcomes
• Employ proper position sizing and risk management on every trade
• Combine indicator signals with their own analysis and trading strategy
• Paper trade and backtest thoroughly before live implementation
• Never risk more than they can afford to lose
Signal Context
Indicator signals should be evaluated within broader market structure. Consider:
• Proximity to key support and resistance levels
• Overall trend direction and strength
• Market volatility and liquidity conditions
• Confluence with other technical indicators or patterns
• Fundamental factors that may override technical signals
█ NOTES
• All signals use confirmed bar data and do not repaint
• The cooldown system tracks top and bottom signals independently
• Multiple signal types can fire simultaneously; the composite score aggregates them
• Anomaly mode measures standard deviation magnitude, not just directional bias
• Volume filter checks any bar in the lookback period, not just the current bar
• Strong signals require more confirmations than medium or weak signals