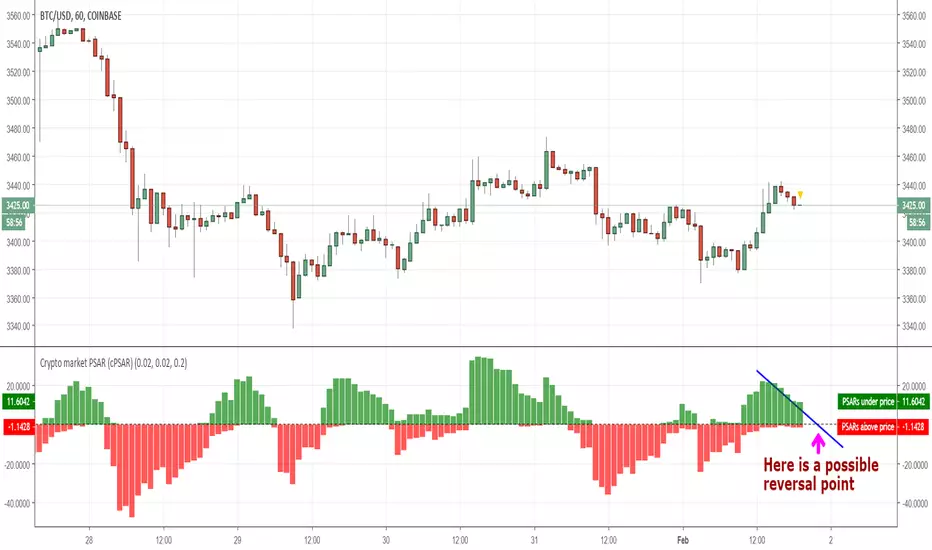
Crypto market PSAR (cPSAR)This indicator calculates the PSARs of the most liquid cryptocurrencies (as percent differences from the prices) and sums them together.
The PSARs under the closes, which act as support, are summed separately and shown in green. The PSARs over the closes (acting as resistance) are summed separately and shown in red.
The result is an indicator which can be interpreted somewhat like the RSI (but keep in mind that PSAR is a lagging indicator unlike the RSI which is a leading indicator). By interpreting this correctly you can - SOMETIMES - predict the short-term turns of the entire crypto market.
Many traders use the prices shown by PSAR (Parabolic Stop And Reverse) to set stop loss prices and/or to take profit and reverse their positions. This is why, on reversal of the PSARs (= when one of the red or green values becomes visibly larger than the other), a strong turning of the market can, sometimes, occur.
Criptomoneda

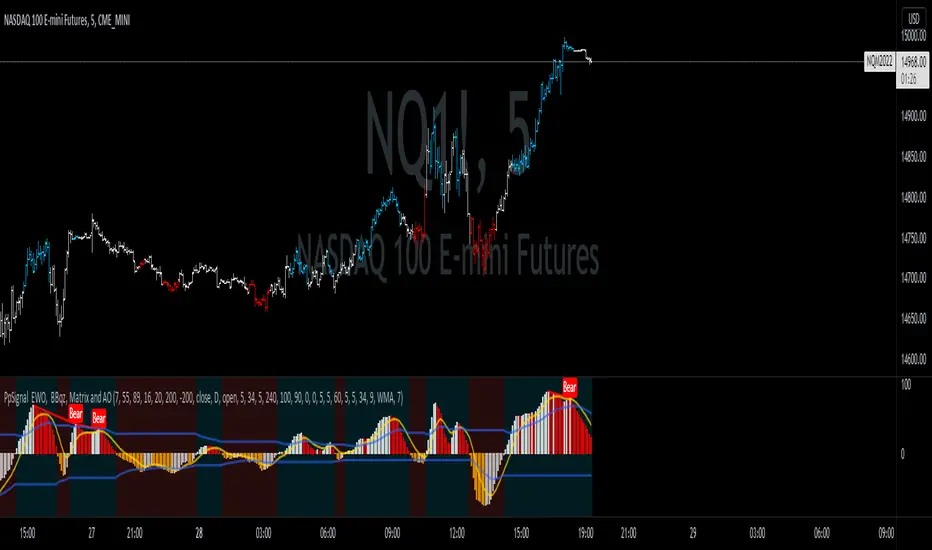
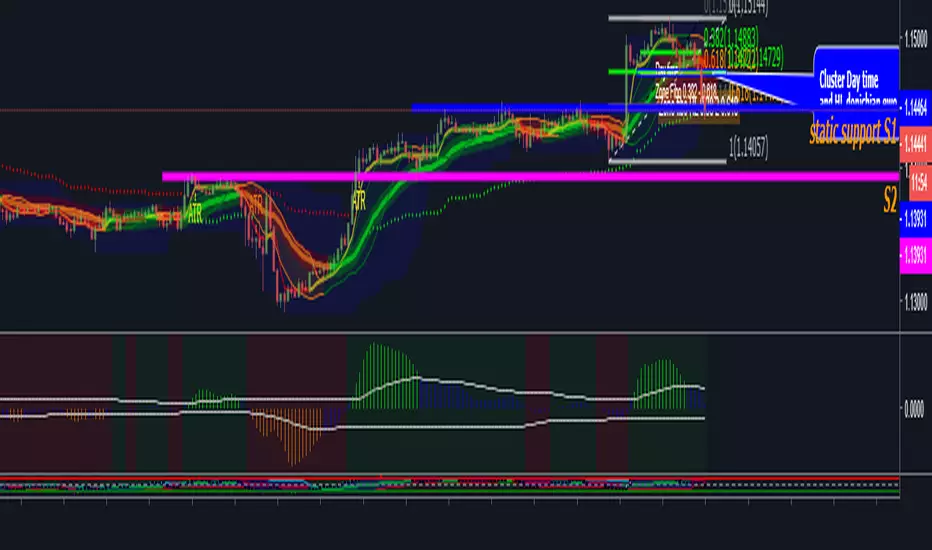
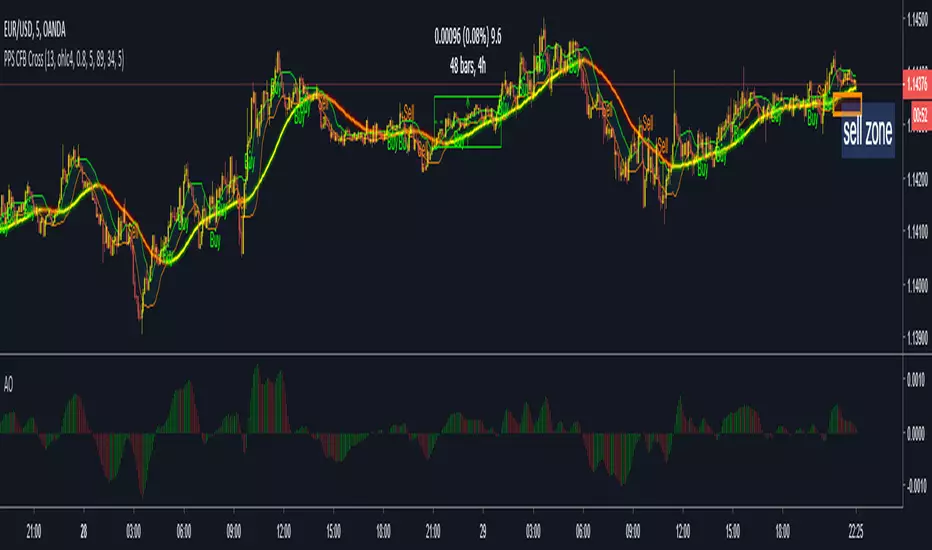
PpSignal Personal TemplateThis is my personal template strategy, I follow the tendency, with
-Donichian: I can se the high and low price.
-CFB: ha can see the trend short.
-Tigger MA: i can see the long trend.
-BB: I can see the short trend and the volatily.
-Ewo break band and Rsi Donicihan channel, the trend and oversold and overbought.
-PPSignal Scalper Double Cross Signal and EWO Smooth V4.0 for the background trend.
PpSignal Candle converter and psignal golden fibo zone.
PPSignal Scalper Double Cross Signal and EWO Smooth V4.0Recomendation
-for grafic 4h and D use
PPS W Signal
EWO W Signal
-For signal 30 min to 3H
PPS D and W signal
EWO D Signal
For signal < 30 Min
PPS 1H and $h
EWO 1H

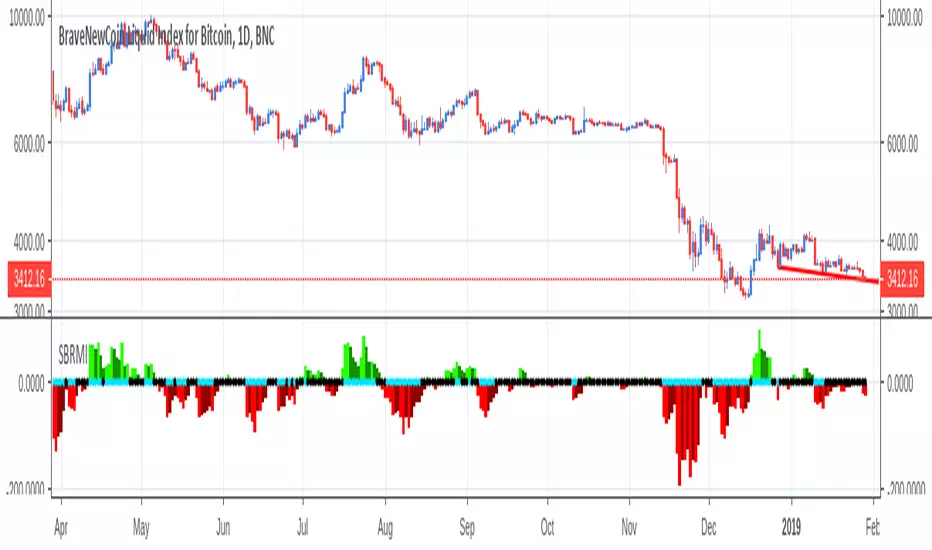
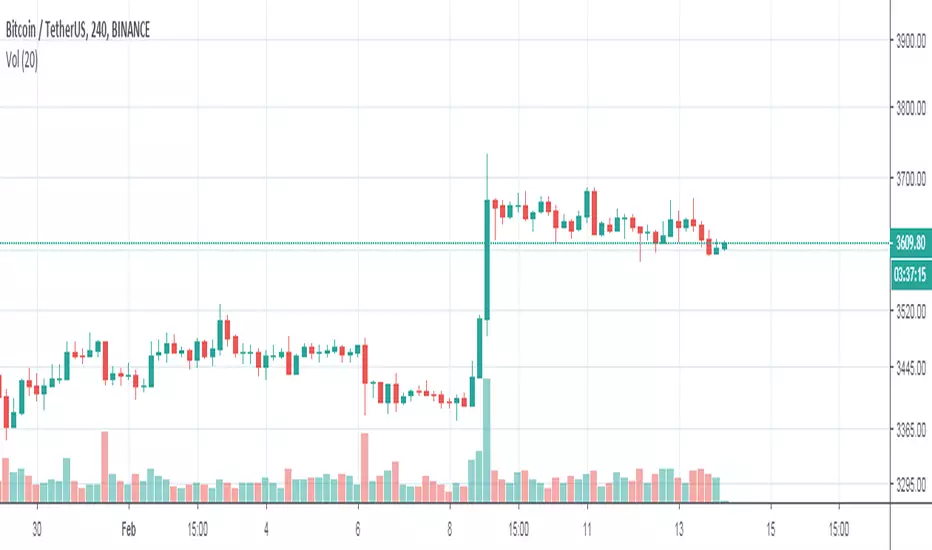
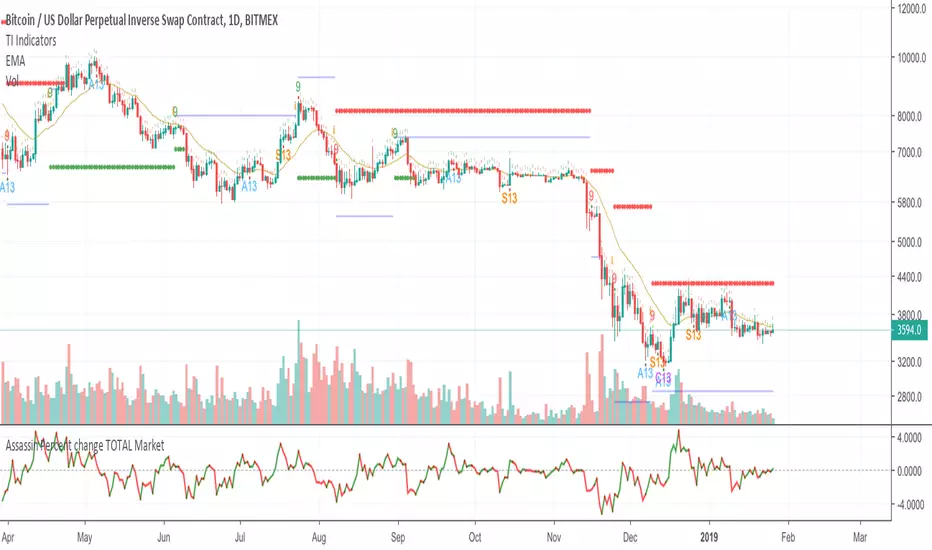
Saracino Bitcoin Relative Momentum IndexThis is a technical indicator developed by Andrea Saracino. It gives buy and sell signals and works best on the daily charts.
This indicator is better suited for Bitcoin. In fact, throughout the history, it gave very consistent buy and sell signals on this asset. Could also be used in other cryptocurrencies.
It consists of two components: the histogram and the dots.
HISTOGRAM
The histogram shows the actual momentum of a given price trend and can be used to check if the trend is strong or if it's getting weaker overtime. When the momentum is to the upside it is green, while it is red if the momentum is to the downside.
DOTS
This is the actual signal part. It consists of a series of dots that become blue if there is a clear signal in either way.
For example: if the momentum is going up and the dots become blue it is a buy signal, or a sell signal if momentum goes down.
DISCLAIMER
This is NOT the Saint Grail indicator. You must not open any trade using just this indicator. Create a strategy instead.

PpSignal Donchian Channels CFB and BB StrategyHere we are combine cfb with bollinger band and donichian midle line channel estrategy
This technique is for those who want the most simple method that is very effective. The best trade are during the busiest trading hours, 3am to 12am EST NY time. This method does not work in sideways markets, only in volatile trending markets.
Time Frames: 1, 5, 10, 15, 30 min.
Currency pairs: majors and btc
Essential chart indicator
-Ppsignal EWO BB, ( )
Other Chart indicators:
- Awesome Oscillator. ( )
- Optionally Add Squeeze Indicator ( )
- Bollinguer band period 13 desviation 1.
BUY SIGNAL
-Ewo above 0
-CFB crosses the middle donichian channel.
-CFB crosses ariiba from the upper band of bollinguer band.
SELL SIGNAL
- Ewo below 0
- CFB crosses below the middle channel
- CFB crosses below the signal bb.
Wath is CFB?
TJ Money FlowTJ Money Flow, one of the most frequently used indicators by me.
This indicator is a modification of the CMF and it has great use and multiple interpretation possibilities.
I like treating it like the addition of StochRSI to RSI, just that TJ-MoneyFlow works like a "behind the scenes tool" of the volume indicator.
The first most important thing about it are the spikes. I like seeing a movement either up or down, confirming it with a spike in the TJ-MF.
The next sparkle about it is the modification of movements down and movements up.
When it moves down, it is in blue color, when it moves up it is in green color.
This lets me compare the candle direction to the Money Flow direction.
Bigger clouds of the same color indicate strength in the direction.
One more step that I like using the TJ-MoneyFlow for is for divergences. Either divergences on a cloud itself, regardless from its color.
Or divergences over two separate clouds. The idea is, if there is a significant trend, then it should be confirmed by the MoneyFlow.
Like and Follow me and you will find this page interesting because I am a TA expert and professional day trader in crypto since 2012 that does daily updates and new posts about the hottest and most discussed coins.
Cheers, TJ

TJ-StochFinally I am setting this beast free.
This is one of my favorite indicators and it has everything what there is to Stochastic and Stochastic RSI.
The TJ-Stoch is a heavy mod and merge of Stochastic and Stochastic RSI.
There are some very important modifications on it.
- The green and red line at 40 and 90 points.
The stochastic lines like getting rejected at both lines.
A rejection at the 40 point line, from above or from below, mostly has an impulse move to it.
The same applies to the 90 point line.
The 90 point line nevertheless, has mostly an impulse move, when it is getting crossed down.
The stochastic lines staying above the 90 point line, are an indication for upcoming impulse moves.
- The lines itself
The stochastic lines have their original colors; blue for K , the faster moving line and orange for D the slower moving line.
Nevertheless, you can identify the original colors only, when those are ascending.
When the K and the D line are descending, those turn red, so you can immediately see what move is what and where it is actually descending or ascending.
- The crosses
One of the most important treats that Stochastic and Stochastic RSI have, are the crossovers. Sometimes these are hard to identify.
Therefore, a crossover is marked with a green cross at the top. A cross-down is marked with a red cross at the top.
Like and Follow me and you will find this page interesting because I am a TA expert and professional day trader in crypto since 2012 that does daily updates and new posts about the hottest and most discussed coins.
Cheers, TJ

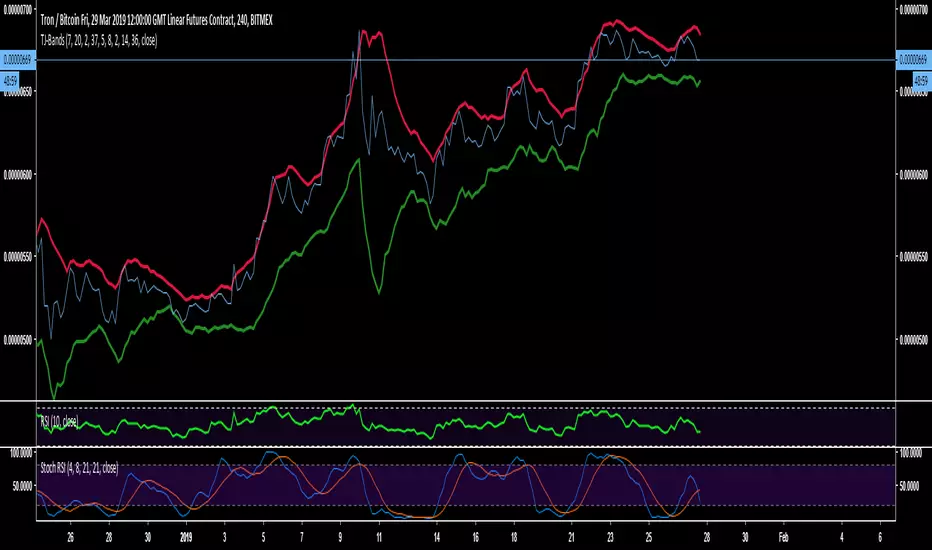
TJ-BandsDo you want to know
This indicator is a modified form of Bollinger Bands.
It works in a similar way like BB does. If you take a look at the "line" chart, you will clearly see, that a close outside these bands is very unlikely and works very well as a rejection line for the chart.
Since, the chart is likely to get rejected at the bands those have been indicated red at the top and green at the bottom.
The use is very simple, add it to your chart and there is nothing more to modify or change.
Like and Follow me and you will find this page interesting because I am a TA expert and professional day trader in crypto since 2012 that does daily updates and new posts about the hottest and most discussed coins.
Cheers, TJ
Lazy Trend System 2019latest, more powerful and applicable on FX, indices, stocks and cryptocurrencies!

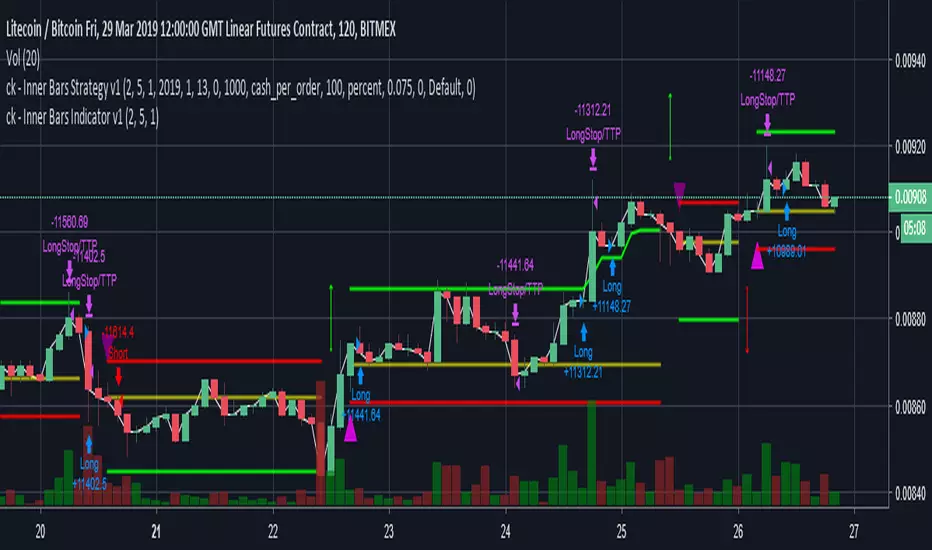
ck - Inner Bars Indicator with Alerts and Trailing Stop v1*** Please check out the matching Strategy to accompany this Indicator to allow you to fully backtest! ***
Inner Bar trading strategy is where the "inside" bar (or candle to the right) within a pair is smaller and within the high to low range of the prior bar, as this pattern tends to be somewhat predictable; especially in "chop" or sideways trading, it is useful to have in your tool box.
Features include:
Complimentary strategy you can add as well as the indicator to backtest and tune your settings before live trading
Trailing Stoploss to wring every cent from a trade
Clear Alert labels have been coded in for use with trading bots, 3commas is recommended.
Enable/Disable Shorts in addition to Longs
Visual chart shapes - Pink Triangle = Long, Purple Triangle = Short, Thin Green Arrow = Profit, Thin Red Arrow = Loss
Realtime Deal Status - Plotlines include Yellow = Entry Price, Green = Trailing Stop Profit, Red - Hard Stoploss
A further feature is that you can disable Shorts (therefore only Longing) for use with exchanges
that only allow you to Long, such as Binance & Coinbase.
Additionally, this Indicator will close a trade before opening the next, so a single exchange
account (BitMEX for example) is all that is required versus having separate accounts to long or
short on the same chart.
This strategy is intended to use $100 of capital, traded at 2.5% per order with 10x lev on Bitmex.
If you like my work, please use my referral links (you will receive discounts!)
3commas trading bots (now with Bitmex support and a lot more!) - 3commas.io
BitMEX - www.bitmex.com
If you have any comments or suggestions, please message me via TradingView.
Based on the core "Inner Bars" concept found at:
backtest-rookies.com
with original inspiration/idea from babypips.com

ck - Inner Bars Strategy v1*** Please check out the matching Indicator to accompany this Strategy to allow you to fully backtest! ***
Inner Bar trading strategy is where the "inside" bar (or candle to the right) within a pair is smaller and within the high to low range of the prior bar, as this pattern tends to be somewhat predictable; especially in "chop" or sideways trading, it is useful to have in your tool box.
Features include:
Complimentary Indicator you can add as well as this strategy to backtest and tune your settings before live trading
Trailing Stoploss to wring every cent from a trade
Indicator only: Clear Alert labels have been coded in for use with trading bots, 3commas is recommended.
Enable/Disable Shorts in addition to Longs
A further feature is that you can disable Shorts (therefore only Longing) for use with exchanges
that only allow you to Long, such as Binance & Coinbase.
Additionally, this Indicator will close a trade before opening the next, so a single exchange
account (BitMEX for example) is all that is required versus having separate accounts to long or
short on the same chart.
This strategy is intended to use $100 of capital, traded at 2.5% per order with 10x lev on Bitmex.
If you like my work, please use my referral links (you will receive discounts!)
3commas trading bots (now with Bitmex support and a lot more!) - 3commas.io
BitMEX - www.bitmex.com
If you have any comments or suggestions, please message me via TradingView.
Based on the core "Inner Bars" concept found at:
backtest-rookies.com
with original inspiration/idea from babypips.com
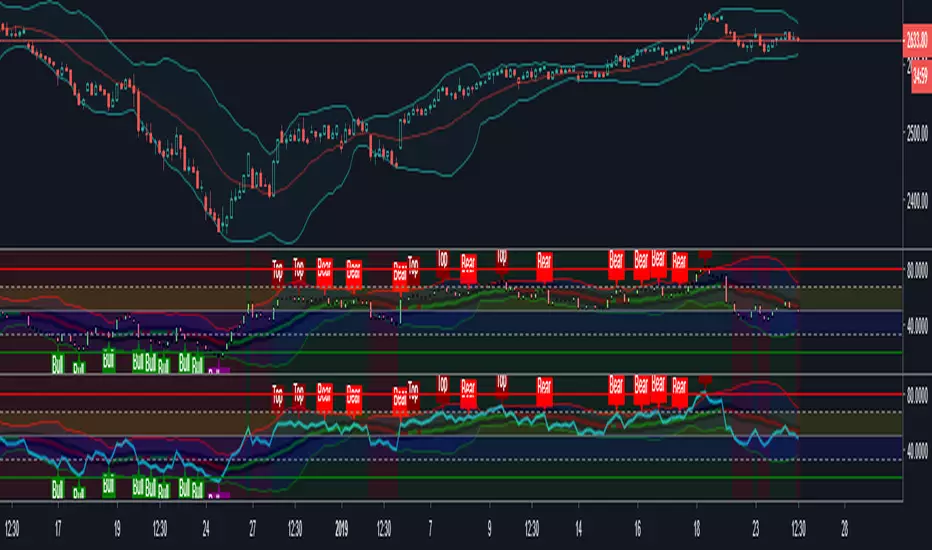
CryptoScalper: NightMODE by BiO-618Hey guys!
It's me with a new version of the script.
Since a lot of people wanted to use it for scalping, I adjusted it for that.
More buy signals, more sell signals, 90% accuracy (at least ;) )
Remember to use the pivots to set Take Profits and Stop Losses, no software is 100% accurate, otherwise the market would trash it.
SELL SIGNALS
Red "S": Sell signal
Yellow "Sell": Strong+ sell signal
Orange "SELL": Strong++ sell signal. Shortable signal.
Red triangledown "SELL!": Strongest+++ sell signal, bearish divergences from MACD . Shortable signal.
BUY SIGNALS
Yellow triangleup "Weakening": Bear trend is getting weak, as the asset is getting oversold.
Green "BUY!": Strong buy, bullish divergence from MACD . Strongest buy signal.
Remember, again, to ALWAYS set your TP and SL beforehand. The key to be profitable is to act before the market acts.
It's better 3% in hand than 1% below your initial balance.
From a manual backtesting, I got a 53% profit on 2 weeks, trust my advice to manage the risk and you will be profitable aswell ;)
Check my other scripts to get more options :)
I also made a 4Hours and 12Hours optimized scripts, you might found that which one works better for your strategy, asset, and timeframe.

CryptoField - TREND Mode indicatorThe CryptoField TREND Mode indicator identifies the trend direction (uptrend or downtrend) and the mode (trending or sideways) of the market.
Uptrend when green
Downtrend when red
Sideways when orange
Trending when green or red
Basically the indicator works like a double moving average, but the algorithm reacts faster on movements and it tolerates "noisy"/volatile markets better which makes it more effective on crypto markets.
It can be applied to strategies or other indicators as a trend direction or market mode filter.

Comparative ATR%Comparison of the ATR (Average Trading Range) of multiple coins. The ATRs are shown as percentage.


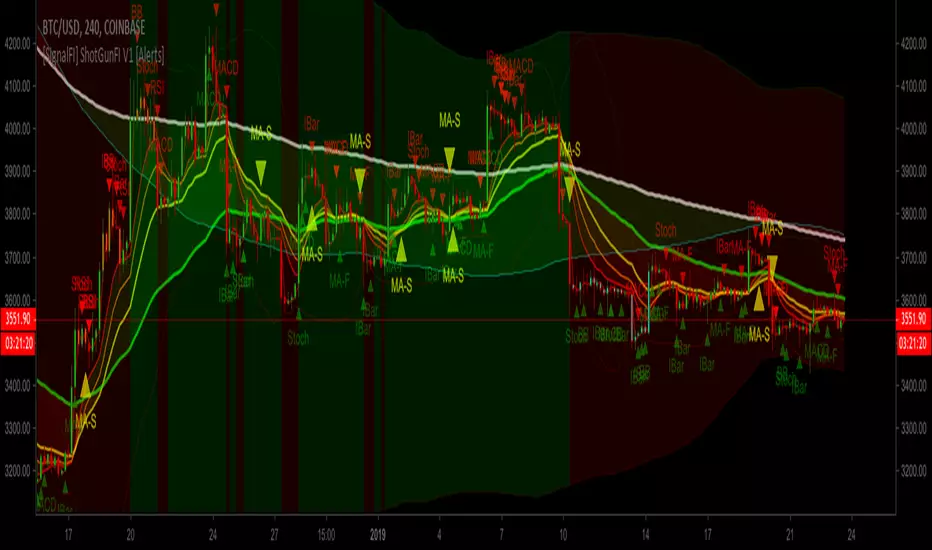
[SignalFI] ShotGunFI V1Welcome to ShotGunFI
In order to help give our members awareness of how major indicators move market price action, we created ShotGunFI. This script provides signals for the following indicators and gives a customizable framework for the user to track how certain indicators impact price and further how those impacts could relate to their overall strategy. We took the major indicators that are used in the market and smashed them into one chart with one indicator so that you can visualize a broad spectrum of strategies that are already driving price action.
This script is enabled with Data Leak and Repaint protection by default. Ensuring that signals are true.
The following indicators are included:
//+RSI Ob/Os Crossover Signals
- Candles are colored Orange and Aqua when RSI is overbought or oversold.
- Arrows and Alerts for crossover 30 and crossunder 70 RSI .
//+Slow Stochastic Signals
- Arrows and Alerts for crossover 20 and crossunder 80 Stoch RSI
//+MACD Bull/Bear Signals
- Arrows and Alerts for MACD Bull and Bear Signal line crossovers
//+MA Cross Bull/Bear Signals
- Arrows and Alerts for MA 1 Cross of MA 1 and MA 1 Cross of MA 4.
By default EMA is enabled, however, we included several other MA types to enhance and expand on this concept.
Included are the following MA types:
Kaufman Adaptive Moving Average ( KAMA )
Hull Moving Average
Smoothed Moving Average
Variable Index Dynamic Average
Fractal Adaptive Moving Average
Fractal Dimension Adaptive Moving Average
Double Exponential Moving Average
Least Squares Moving Average
Coefficient of Variation Weighted Moving Average
Simple Weighted Moving Average
Exponential Moving Average
Weighted Moving Average
Arnaud Legoux Moving Average
Option Types Labels:
"SWMA", "EMA", "WMA", "SMA", "HMA", "KAMA", "SMMA", "VIDYA", "VWMA", "ALMA", "FRAMA", "DEMA", "FDAMA", "LSMA", "COVWMA"
//+BollingBand Bull/Bear Signals
- Arrows and Alerts for lower BB crossover and higher BB crossover
//+Bollinger Band + RSI (BBRSI) Bull/Bear Signals
- Arrows and Alerts for custom higher timeframe Bollinger Band that integrates RSI . 4 Signals total.
//+InsideBar Bull/Bear Signals
- Arrows and Alerts for InsideBar bull/bear break combinations.
ALERTS DISABLED VERSION. Padaone Members Only.
SignalFI was created to help traders and investors to effectively analyze the market based on the Golden Mean Ratio (Fibonacci numbers), plan a trade and ultimately execute it. To help inform and educate market decisions we developed a set of Trading Indicators which are available on TradingView , the most advanced and yet easy to use charting platform available on the web.
SignalFI indicators are just that, indicators. Our indicators are generally configured to use completely historical data (negating repaint), and we advise all alerts created with SignalFI indicators to be fired upon "close" of the current candle. Our indicators can provide valuable context and visualization support when performing market analysis and executing buy and sell decisions. However. we are not financial experts, and all information presented on this site or our other media outlets are for educational purposes only.
For subscription information, visit www.signalfi.net and follow us on twitter.

[SignalFI] ShotGunFI V1 [Alerts]Welcome to ShotGunFI
In order to help give our members awareness of how major indicators move market price action, we created ShotGunFI. This script provides signals for the following indicators and gives a customizable framework for the user to track how certain indicators impact price and further how those impacts could relate to their overall strategy. We took the major indicators that are used in the market and smashed them into one chart with one indicator so that you can visualize a broad spectrum of strategies that are already driving price action.
This script is enabled with Data Leak and Repaint protection by default. Ensuring that signals are true.
The following indicators are included:
//+RSI Ob/Os Crossover Signals
- Candles are colored Orange and Aqua when RSI is overbought or oversold.
- Arrows and Alerts for crossover 30 and crossunder 70 RSI.
//+Slow Stochastic Signals
- Arrows and Alerts for crossover 20 and crossunder 80 Stoch RSI
//+MACD Bull/Bear Signals
- Arrows and Alerts for MACD Bull and Bear Signal line crossovers
//+MA Cross Bull/Bear Signals
- Arrows and Alerts for MA 1 Cross of MA 1 and MA 1 Cross of MA 4.
By default EMA is enabled, however, we included several other MA types to enhance and expand on this concept.
Included are the following MA types:
Kaufman Adaptive Moving Average ( KAMA )
Hull Moving Average
Smoothed Moving Average
Variable Index Dynamic Average
Fractal Adaptive Moving Average
Fractal Dimension Adaptive Moving Average
Double Exponential Moving Average
Least Squares Moving Average
Coefficient of Variation Weighted Moving Average
Simple Weighted Moving Average
Exponential Moving Average
Weighted Moving Average
Arnaud Legoux Moving Average
Option Types Labels:
"SWMA", "EMA", "WMA", "SMA", "HMA", "KAMA", "SMMA", "VIDYA", "VWMA", "ALMA", "FRAMA", "DEMA", "FDAMA", "LSMA", "COVWMA"
//+BollingBand Bull/Bear Signals
- Arrows and Alerts for lower BB crossover and higher BB crossover
//+Bollinger Band + RSI (BBRSI) Bull/Bear Signals
- Arrows and Alerts for custom higher timeframe Bollinger Band that integrates RSI. 4 Signals total.
//+InsideBar Bull/Bear Signals
- Arrows and Alerts for InsideBar bull/bear break combinations.
ALERTS VERSION Only for Jedi and Master Subscribers
SignalFI was created to help traders and investors to effectively analyze the market based on the Golden Mean Ratio (Fibonacci numbers), plan a trade and ultimately execute it. To help inform and educate market decisions we developed a set of Trading Indicators which are available on TradingView , the most advanced and yet easy to use charting platform available on the web.
SignalFI indicators are just that, indicators. Our indicators are generally configured to use completely historical data (negating repaint), and we advise all alerts created with SignalFI indicators to be fired upon "close" of the current candle. Our indicators can provide valuable context and visualization support when performing market analysis and executing buy and sell decisions. However. we are not financial experts, and all information presented on this site or our other media outlets are for educational purposes only.
For subscription information, visit www.signalfi.net and follow us on twitter.