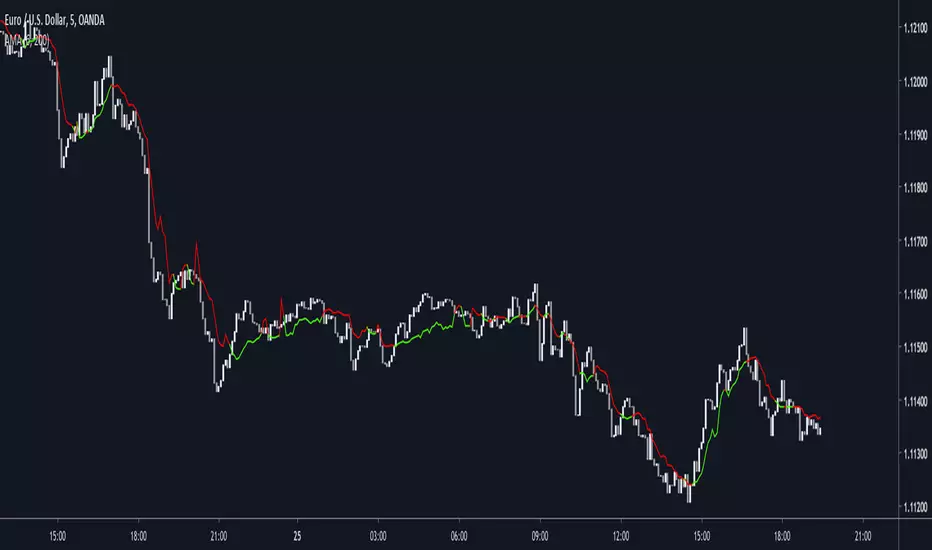
Fast-Slow MA Cross on custom timeframe (with alerts)A simple script for tracking your moving average crossing with an option for a fixed time frame and a 3 additional MAs for reference.
Cross
ADX Di+ Di- [Gu5]Fill indicates Strong Trend
Cross indicates End of Trend
--
El relleno indica una fuerte tendencia cuando el Di supera "Level Trend"
El cruce de Di+ con Di- indica el fin de la tendencia
Cuando el valor del ADX es menor a "Level Range", estamos en Rango

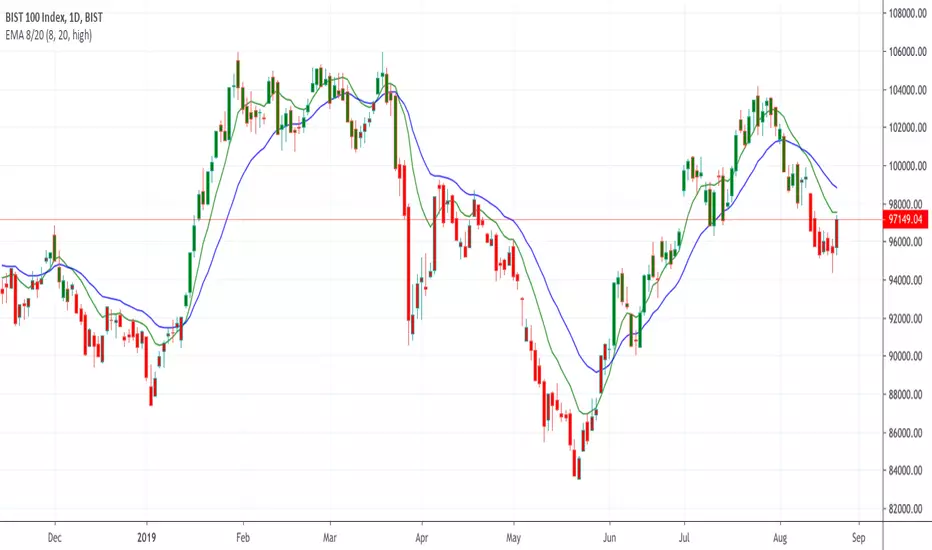
EMA 8/20This is a simple cross over moving avareges
Bu iki basit hareketli ortalamın kesişimini gösteren bir indikatördür
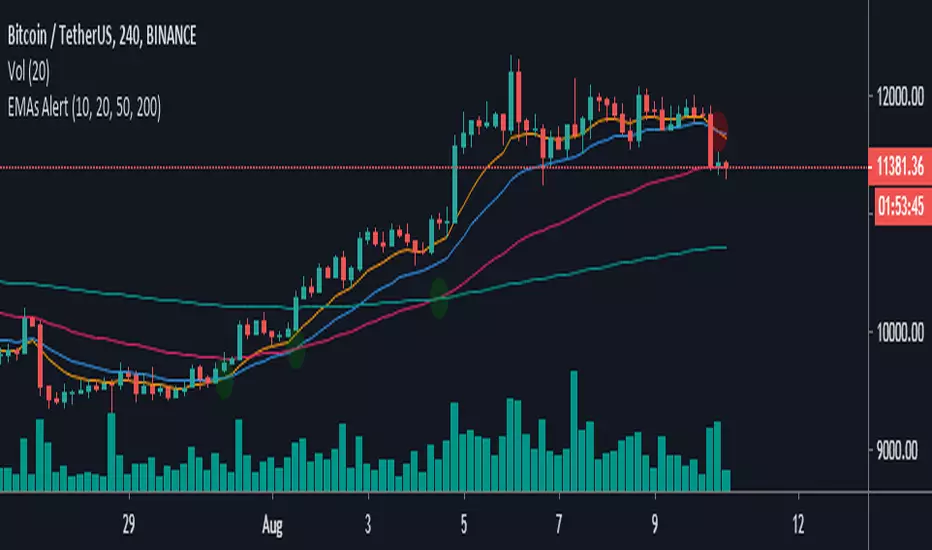
EMAs Alert-This script allows you to show the crossings of the most important emas such as 10, 20, 50 and 200
-You can modify the values of each ema you like
-Bring alerts of the crosses of each ema, which will allow you to activate this function to only the assets you want to track
Golden Cross by -Westy-Quick Guide
- Yellow cross and green MA on top = Potential uptrend
- Yellow cross and red MA on top = Potential downtrend
A simple golden cross indicator of the green 50 and red 200 SMA with a yellow cross for ease of visibility and backtesting.
Generally, longer time frames more powerful signals but are less frequent. I typically use it on the 4 hour, daily and weekly.

Ichimoku Cross Indicator [Mehdihz]This script shows tenken & kijen lines position to better detection of crosses.

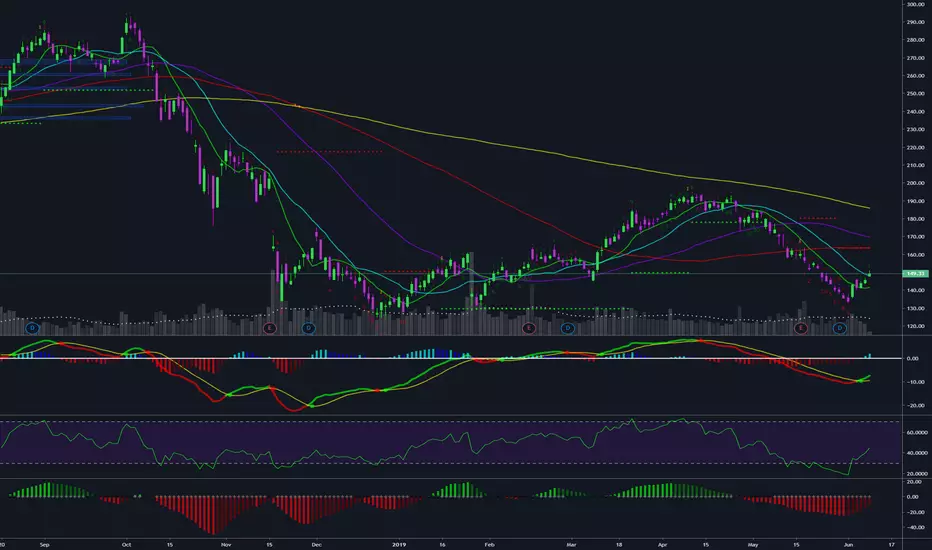
Triple Moving Average HeatmapHi everyone
I didn't publish on Friday because I was working on an Expert Advisor in MT4. The day I don't publish, some scripts spamming guys published many (not useful) scripts the same to kick me out of the TOP #1 ranking.
So what I'm going to do about it? crying or sharing more quality scripts than before? :)
I guess you know the answer :) I'm gonna share a few quality scripts that I have in my library. I noticed that you guys tend to like more the scripts useful for your trading actually making you money rather than a copy-paste (of another copy-paste)
Alright, enough for the trolling now let's introduce the Three MA heatmap which is an upgrade of that script : MA-heatmap-Double-cross-edition/
The challenge was to keep the heatmap not rolling and to make it match with the MA cross. I did it using this
```
since_ma_buy = barssince(macrossover)
since_ma_sell = barssince(macrossunder)
heatmap_color() =>
since_ma_buy < since_ma_sell ? color.new(color.green, 20) : since_ma_buy > since_ma_sell ? color.new(color.red, 20) : na
```
This is a technique that I found after drinking three glasses of red wine (#french) to keep the heatmap stable and not rolling.
To get what I'm saying I invite you to replace the piece of code above by what everyone would normally do
```
heatmap_color() =>
macrossunder() ? color.new(color.green, 20) : macrossover() ? color.new(color.red, 20) : na
```
Ah and I'm not done sharing for the day, a few scripts are coming also after that one and tonight !!!!! I want to live in a world where you guys can enjoy quality scripts (mostly) :)
PS
____________________________________________________________
Feel free to hit the thumbs up as it shows me that I'm not doing this for nothing and will motivate to deliver more quality content in the future.
- I'm an officially approved PineEditor/LUA/MT4 approved mentor on codementor. You can request a coaching with me if you want and I'll teach you how to build kick-ass indicators and strategies
Jump on a 1 to 1 coaching with me
- You can also hire for a custom dev of your indicator/strategy/bot/chrome extension/python

Bollinger bands/Lagging span crossHello my dear ambitious traders
I'm working hard this week to publish some great indicators this week and open sourced. Hope you'll enjoy, learn and use them.
This will be my greatest reward but comments showing appreciation are also very welcomed (actually likes too) :)
For today, I'll share a simple indicator but it's coming along with some insightful knowledge ^^
Anyway, I'm not here to ask you to this but to share a very cool indicator I made a few months ago and wanted to share for FREE with the community today
The indicator is related to this educational post : What-a-Bollinger-Bands-Lagging-span-cross-can-tell-us/
This trading technique was invented by Robbytrade, a famous french trader twitter.com
I wanted to have those visual signals on the chart so I coded it.
The advantage of being a developer is that you can litteraly code what you miss and get your life better in the process. The one that will find a way to code a new form of money will be rich... wait.... that guy is called Satoshi Nakamoto...
That's all for me today my friends
PS
Trying to update the Trade Manager shared yesterday with some cool features. More to come in the upcoming days
Enjoy
Dave

MA heatmap (Double cross edition)Hello my friends
Sorry yesterday I couldn't post an indicator because I was travelling. So here's the today indicator inspired from that one Moving-Average-Heatmap-Visualization/
This will gives an interesting representation of a Double Moving Average cross
That's all for me
Let's resume the free indicators publishing next Monday with the MA heatmap (Triple cross edition) and then the 4 cross ... until the 100 cross edition .... "wait are you joking sir ?"... Totally YES :)
But the Triple cross edition will be released as it's interesting from a Pine script perspective
Enjoy your weekend and stay safe
Dave
SVAMA - A Non Parametric Adaptive Moving Average Based On VolumeIntroduction
Technical indicators often have parameters settings that the user must enter, those are inconvenient when the user must design a strategy because such settings must be optimized, it must also been noted that the optimal settings at time t could change at time t+n , this is why non parametric indicators are more efficient. Today i propose a moving average adapting to the market volume without using parameters affecting the smoothing.
The Indicator
The volume is rescaled in a range of (1,0) by using max or min normalization. Exponential averaging is used to provide the moving average.
When using max normalization the moving average react faster when the volume is closer to its all time high, when using min normalization the moving average react faster when the volume is closer to its all time low. You can select the method (max or min) from the "Method" parameter.
Volume tend to be higher and more periodic with higher time-frames, this is why lower time-frames might return smoother results when using the Max method. It is recommended to use the Max method when we want a faster moving average while the Min method is more suited to get a slower moving average.
Both methods can provide an interesting MA-Cross system when used on higher time frames.
Conclusion
There should be more non parametric indicators, this would allow for faster and easier optimization processes when creating a strategy, in theory any indicator using a moving average or highest/lowest could be made non parametric by using a running mean or running max/min but the indicator might loose important information.
This is one of my main focus right now since such indicators could also allow for improvements when used with artificial intelligence. I hope you find an use to it, don't hesitate to send me your suggestions.
Thanks for reading !

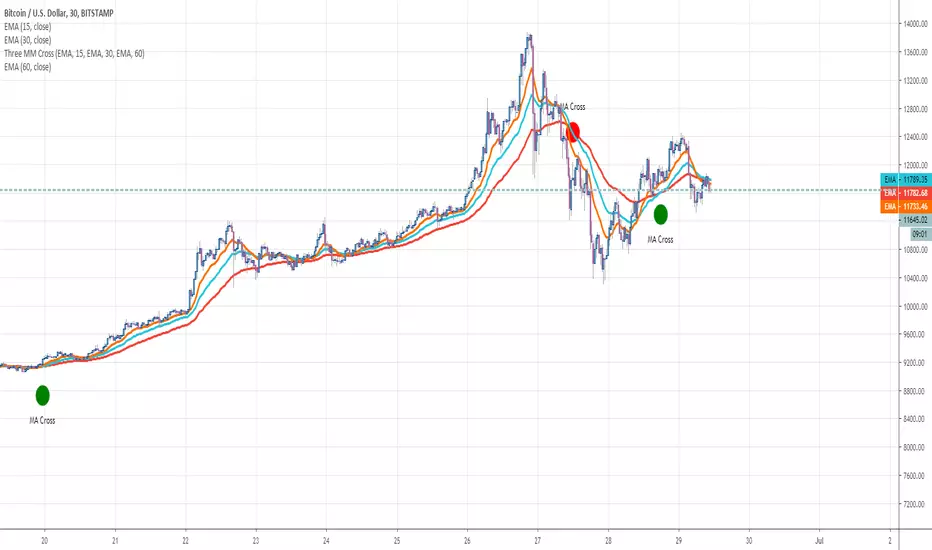
Three MM CrossHello traders
Some friends asked me to do it so... sharing it for everyone instead
This indicator detects when the first moving average is above the two others. It's a very powerful tool for trend traders that use multiple moving averages to detect a strong trend
Enjoy
Dave
Four MM crossHello traders
Some friends asked me to do it so... sharing it for everyone instead
This indicator detects when the first moving average is above the three others. It's a very powerful tool for trend traders that use multiple moving averages to detect a strong trend
Enjoy
Dave

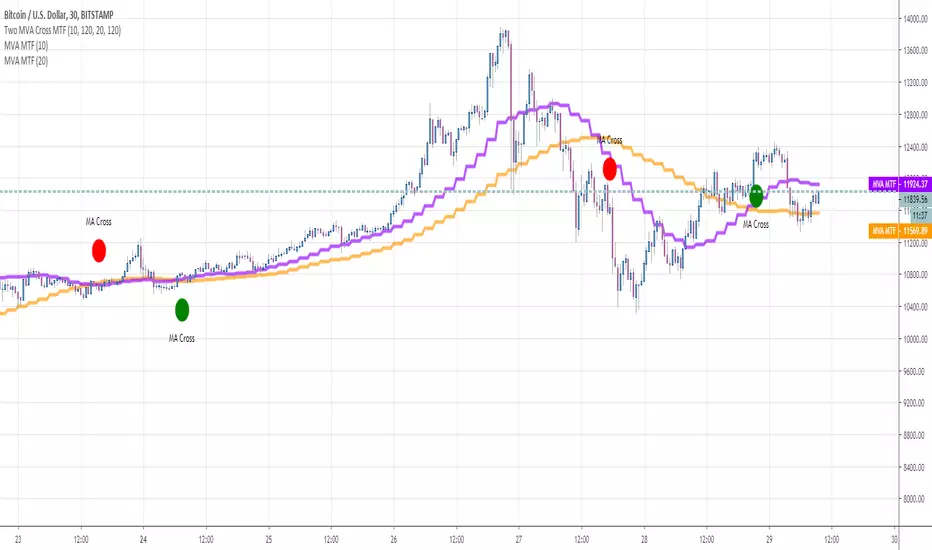
Two MVA Cross MTFHello traders
This is a script to apply the crossover/crossunder of moving average multi-timeframes on a different timeframe chart
In this example, we see two moving averages in the 2H timeframe being detected on a m30 chart
Enjoy
Dave
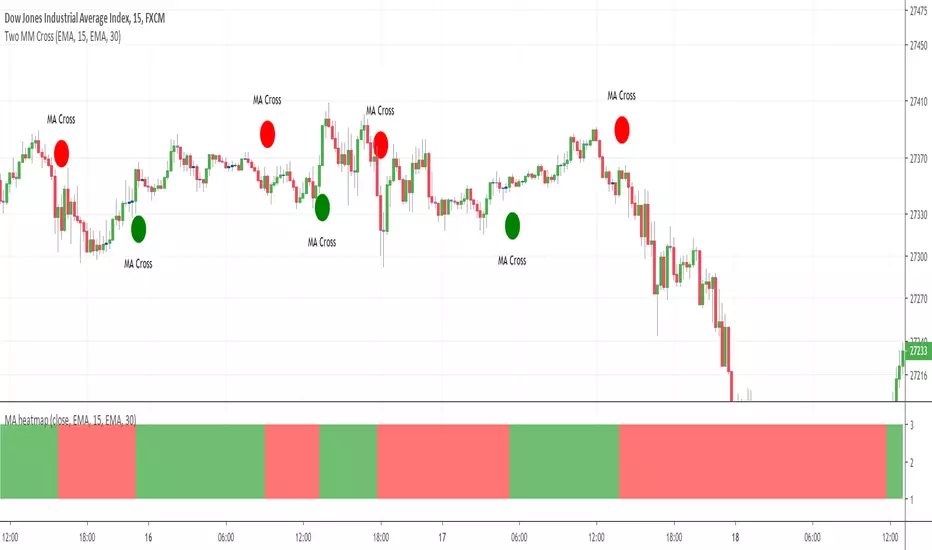
Two MM CrossHello Traders
This is a script to detect the crossover/crossunder of two moving averages
It's generic as all standard moving averages are accepted and can be crossed between each other
Enjoy
Dave

Multiple Moving AveragesThis script shows multiple moving averages and has an indicator when they are about to cross. Depending on the scale you probably will need to adjust the values to have a working cross indicator.
Turbo TriggerSome Words
This indicator is a collaboration between me and Himeyuri, i encourage you to check her profile and follow her www.tradingview.com
Introduction
A lot of indicators include a "trigger" line, it can be a smoothed version of another input, in this case the trigger will generate signals from his crosses with the input. The purpose of this indicator is to provide a fast trigger line to generate earlier signals as well as avoiding some whipsaw.
The Indicator
There are two lines, a bull line (blue) and the trigger (orange) , when the trigger cross over the bull line a buy signal is generated, when the trigger cross under the bull line a sell signal is generated. The trigger is made from the smoothed difference between the bull and bear line.
smooth control the smoothness of the output. The Bull/Bear Mode is an idea proposed by Himeyuri that involve plotting the bear line instead of the trigger.
Bull/Bear Mode, the lines are somewhat asymmetrical from each others.
Conclusion
We have showcased a new indicator who use a really fast trigger line to generate earlier signals, if some are way to earlier you can still increase smooth in order to correct reactivity. I hope you find a use to it.
Thanks for reading !
A big thanks to Himeyuri who is a great student and great pinescripter.


Dynamically Adjustable Moving AverageIntroduction
The Dynamically Adjustable Moving Average (AMA) is an adaptive moving average proposed by Jacinta Chan Phooi M’ng (1) originally provided to forecast Asian Tiger's futures markets. AMA adjust to market condition in order to avoid whipsaw trades as well as entering the trending market earlier. This moving average showed better results than classical methods (SMA20, EMA20, MAC, MACD, KAMA, OptSMA) using a classical crossover/under strategy in Asian Tiger's futures from 2014 to 2015.
Dynamically Adjustable Moving Average
AMA adjust to market condition using a non-exponential method, which in itself is not common, AMA is described as follow :
1/v * sum(close,v)
where v = σ/√σ
σ is the price standard deviation.
v is defined as the Efficacy Ratio (not be confounded with the Efficiency Ratio) . As you can see v determine the moving average period, you could resume the formula in pine with sma(close,v) but in pine its not possible to use the function sma with variables for length, however you can derive sma using cumulation.
sma ≈ d/length where d = c - c_length and c = cum(close)
So a moving average can be expressed as the difference of the cumulated price by the cumulated price length period back, this difference is then divided by length. The length period of the indicator should be short since rounded version of v tend to become less variables thus providing less adaptive results.
AMA in Forex Market
In 2014/2015 Major Forex currencies where more persistent than Asian Tiger's Futures (2) , also most traded currency pairs tend to have a strong long-term positive autocorrelation so AMA could have in theory provided good results if we only focus on the long term dependency. AMA has been tested with ASEAN-5 Currencies (3) and still showed good results, however forex is still a tricky market, also there is zero proof that switching to a long term moving average during ranging market avoid whipsaw trades (if you have a paper who prove it please pm me) .
Conclusion
An interesting indicator, however the idea behind it is far from being optimal, so far most adaptive methods tend to focus more in adapting themselves to market complexity than volatility. An interesting approach would have been to determine the validity of a signal by checking the efficacy ratio at time t . Backtesting could be a good way to see if the indicator is still performing well.
References
(1) J.C.P. M’ng, Dynamically adjustable moving average (AMA’) technical
analysis indicator to forecast Asian Tigers’ futures markets, Physica A (2018),
doi.org
(2) www.researchgate.net
(3) www.ncbi.nlm.nih.gov
(YEK) Combo(YEK) Combo is a combination of several indicators (listed below). You can use them together or one by one. Just click settings, and choose which of them to be shown.
Here are the indicators included in this script:
- Ichimoku Cloud
- Bollinger Bands
- Moving Average 1
- Moving Average 2 (In case of detecting golden crosses or death crosses)
- Exponential Moving Average
- T3 Tillson
- MavilimW
Enjoy!

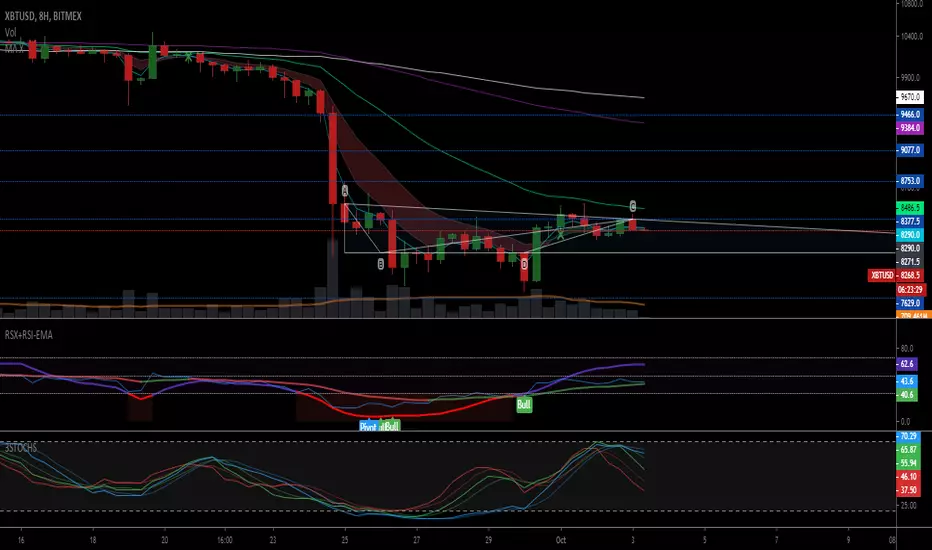
rsi_with_stochrsi_[j15] v3This is version 3 RSI and StochRSI are improved by visualizing the cross-trend wave on the indicator, as well as by highlighting the colors of the bands and take into account the joint intersection of RSI and StochRSI at different settings. Enjoy using it!

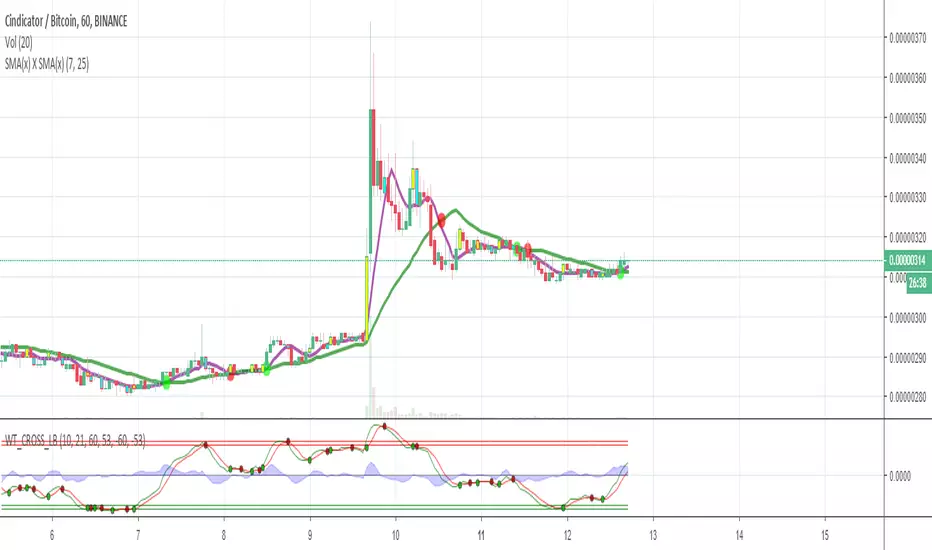
SMA Cross (Short X Long)Its a graph for detecting the SMA cross points.
When short SMA crosses the long SMA downside up it may be a buy signal and the opposite is may be a sell signal.
rsi_with_stochrsi_[j15] v2This is version 2 of the combined indicator RSI and Stochastic RSI. Added intersection of lines k and d, as well as suppression of the upper and lower lines
