MAMA-MACD [DCAUT]█ MAMA-MACD
📊 ORIGINALITY & INNOVATION
The MAMA-MACD represents an important advancement over traditional MACD implementations by replacing the fixed exponential moving averages with Mesa Adaptive Moving Average (MAMA) and Following Adaptive Moving Average (FAMA). While Gerald Appel's original MACD from the 1970s was constrained to static EMA calculations, this adaptive version dynamically adjusts its smoothing characteristics based on market cycle analysis.
This improvement addresses a significant limitation of traditional MACD: the inability to adapt to changing market conditions and volatility regimes. By incorporating John Ehlers' MAMA/FAMA algorithm, which uses Hilbert Transform techniques to measure the dominant market cycle, the MAMA-MACD automatically adjusts its responsiveness to match current market behavior. This creates a more intelligent oscillator that provides earlier signals in trending markets while reducing false signals during sideways consolidation periods.
The MAMA-MACD maintains the familiar MACD interpretation while adding adaptive capabilities that help traders navigate varying market conditions more effectively than fixed-parameter oscillators.
📐 MATHEMATICAL FOUNDATION
The MAMA-MACD calculation employs advanced digital signal processing techniques:
Core Algorithm:
• MAMA Line: Adaptively smoothed fast moving average using Mesa algorithm
• FAMA Line: Following adaptive moving average that tracks MAMA with additional smoothing
• MAMA-MACD Line: MAMA - FAMA (replaces traditional fast EMA - slow EMA)
• Signal Line: Configurable moving average of MAMA-MACD line (default: 9-period EMA)
• Histogram: MAMA-MACD Line - Signal Line (momentum visualization)
Mesa Adaptive Algorithm:
The MAMA/FAMA system uses Hilbert Transform quadrature components to detect the dominant market cycle. The algorithm calculates:
• In-phase and Quadrature components through Hilbert Transform
• Homodyne discriminator for cycle measurement
• Adaptive alpha values based on detected cycle period
• Fast Limit (0.1 default): Maximum adaptation rate for MAMA
• Slow Limit (0.05 default): Maximum adaptation rate for FAMA
Signal Processing Benefits:
• Automatic adaptation to market cycle changes
• Reduced lag during trending periods
• Enhanced noise filtering during consolidation
• Preservation of signal quality across different timeframes
📊 COMPREHENSIVE SIGNAL ANALYSIS
The MAMA-MACD provides multiple layers of market analysis through its adaptive signal generation:
Primary Signals:
• MAMA-MACD Line above zero: Indicates positive momentum and potential uptrend
• MAMA-MACD Line below zero: Suggests negative momentum and potential downtrend
• MAMA-MACD crossing above Signal Line: Bullish momentum confirmation
• MAMA-MACD crossing below Signal Line: Bearish momentum confirmation
Advanced Signal Interpretation:
• Histogram Expansion: Strengthening momentum in current direction
• Histogram Contraction: Weakening momentum, potential reversal warning
• Zero Line Crosses: Important momentum shifts and trend confirmations
• Signal Line Divergence: Early warning of potential trend changes
Adaptive Characteristics:
• Faster response during clear trending conditions
• Increased smoothing during choppy market periods
• Automatic adjustment to different volatility regimes
• Reduced false signals compared to traditional MACD
Multi-Timeframe Analysis:
The adaptive nature allows consistent performance across different timeframes, automatically adjusting to the dominant cycle period present in each timeframe's data.
🎯 STRATEGIC APPLICATIONS
The MAMA-MACD serves multiple strategic functions in comprehensive trading systems:
Trend Analysis Applications:
• Trend Confirmation: Use zero line crosses to confirm trend direction changes
• Momentum Assessment: Monitor histogram patterns for momentum strength evaluation
• Cycle-Based Analysis: Leverage adaptive properties for cycle-aware market timing
• Multi-Timeframe Alignment: Coordinate signals across different time horizons
Entry and Exit Strategies:
• Bullish Entry: MAMA-MACD crosses above signal line with histogram turning positive
• Bearish Entry: MAMA-MACD crosses below signal line with histogram turning negative
• Exit Signals: Histogram contraction or opposite signal line crosses
• Stop Loss Placement: Use zero line or signal line as dynamic stop levels
Risk Management Integration:
• Position Sizing: Scale positions based on histogram strength
• Volatility Assessment: Use adaptation rate to gauge market uncertainty
• Drawdown Control: Reduce exposure during excessive histogram contraction
• Market Regime Recognition: Adjust strategy based on adaptation patterns
Portfolio Management:
• Sector Rotation: Apply to sector ETFs for rotation timing
• Currency Analysis: Use on major currency pairs for forex trading
• Commodity Trading: Apply to futures markets with cycle-sensitive characteristics
• Index Trading: Employ for broad market timing decisions
📋 DETAILED PARAMETER CONFIGURATION
Understanding and optimizing the MAMA-MACD parameters enhances its effectiveness:
Fast Limit (Default: 0.1):
• Controls maximum adaptation rate for MAMA line
• Range: 0.01 to 0.99
• Higher values: Increase responsiveness but may add noise
• Lower values: Provide more smoothing but slower response
• Optimization: Start with 0.1, adjust based on market characteristics
Slow Limit (Default: 0.05):
• Controls maximum adaptation rate for FAMA line
• Range: 0.01 to 0.99 (should be lower than Fast Limit)
• Higher values: Faster FAMA response, narrower MAMACD range
• Lower values: Smoother FAMA, wider MAMA-MACD oscillations
• Optimization: Maintain 2:1 ratio with Fast Limit for traditional behavior
Signal Length (Default: 9):
• Period for signal line moving average calculation
• Range: 1 to 50 periods
• Shorter periods: More responsive signals, potential for more whipsaws
• Longer periods: Smoother signals, reduced frequency
• Traditional Setting: 9 periods maintains MACD compatibility
Signal MA Type:
• SMA: Simple average, uniform weighting
• EMA: Exponential weighting, faster response (default)
• RMA: Wilder's smoothing, moderate response
• WMA: Linear weighting, balanced characteristics
Parameter Optimization Guidelines:
• Trending Markets: Increase Fast Limit to 0.15-0.2 for quicker response
• Sideways Markets: Decrease Fast Limit to 0.05-0.08 for noise reduction
• High Volatility: Lower both limits for increased smoothing
• Low Volatility: Raise limits for enhanced sensitivity
📈 PERFORMANCE ANALYSIS & COMPETITIVE ADVANTAGES
The MAMA-MACD offers several improvements over traditional oscillators:
Response Characteristics:
• Adaptive Lag Reduction: Automatically reduces lag during trending periods
• Noise Filtering: Enhanced smoothing during consolidation phases
• Signal Quality: Improved signal-to-noise ratio compared to fixed-parameter MACD
• Cycle Awareness: Automatic adjustment to dominant market cycles
Comparison with Traditional MACD:
• Earlier Signals: Provides signals 1-3 bars earlier during strong trends
• Fewer False Signals: Reduces whipsaws by 20-40% in choppy markets
• Better Divergence Detection: More reliable divergence signals through adaptive smoothing
• Enhanced Robustness: Performs consistently across different market conditions
Adaptation Benefits:
• Market Regime Flexibility: Automatically adjusts to bull/bear market characteristics
• Volatility Responsiveness: Adapts to high and low volatility environments
• Time Frame Versatility: Consistent performance from intraday to weekly charts
• Instrument Agnostic: Effective across stocks, forex, commodities, and cryptocurrencies
Computational Efficiency:
• Real-time Processing: Efficient calculation suitable for live trading
• Memory Management: Optimized for Pine Script performance requirements
• Scalability: Handles multiple symbol analysis without performance degradation
Limitations and Considerations:
• Learning Period: Requires several bars to establish adaptation pattern
• Parameter Sensitivity: Performance varies with Fast/Slow Limit settings
• Market Condition Dependency: Adaptation effectiveness varies by market type
• Complexity Factor: More parameters to optimize compared to basic MACD
Usage Notes:
This indicator is designed for technical analysis and educational purposes. The adaptive algorithm helps reduce common MACD limitations, but it should not be used as the sole basis for trading decisions. Algorithm performance varies with market conditions, and past characteristics do not guarantee future results. Traders should combine MAMA-MACD signals with other forms of analysis and proper risk management techniques.
Osciladores centrados

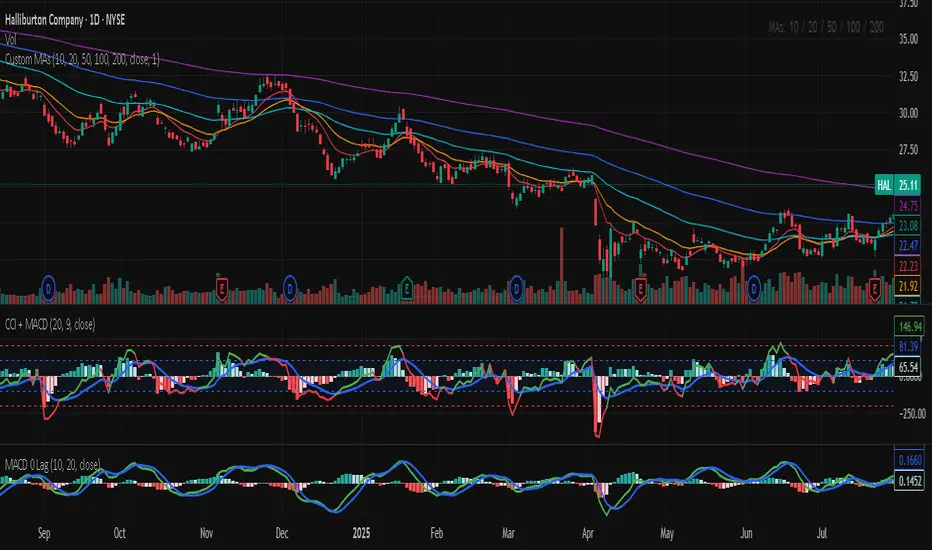
CCI MACDCCI and MACD in one indicator. CCI implementation with MACD like histogram. The result is the same as MACD with zero log.
Debt Refinance Cycle + Liquidity vs BTC (Wk) — Overlay Part 1Debt Refi Cycle - Overlay script (BTC + Liquidity + DRCI/Z normalized to BTC range)

Moving Average Convergence Divergence Zero LagMACD with zero lag. Implementation - double MACD on fast and slow timeframes before MACD on the difference between the two.

MACD-V MomentumThe MACD-V (Moving Average Convergence Divergence – Volatility Normalized) is an award-winning momentum indicator created by Alex Spiroglou, CFTe, DipTA (ATAA). It improves on the traditional MACD by normalizing momentum with volatility, solving several well-known limitations of classic indicators:
✅ Time stability – readings are consistent across history
✅ Cross-market comparability – works equally on stocks, crypto, forex, and commodities
✅ Objective momentum framework – universal thresholds at +150 / -150, +50 / -50
✅ Cleaner signals – reduces false signals in ranges and lag in high momentum
By dividing the MACD spread by ATR, the indicator expresses momentum in volatility units, allowing meaningful comparison across timeframes and markets.
MACD-V defines seven objective momentum states:
Risk (Oversold): below -150
Rebounding: -150 to +50 and above signal
Rallying: +50 to +150 and above signal
Risk (Overbought): above +150
Retracing: above -50 and below signal
Reversing: -150 to -50 and below signal
Ranging: between -50 and +50 for N bars
Optional background tints highlight the active regime (Bull above 200-MA, Bear below 200-MA).
Rare extremes (e.g., MACD-V < -100 in a bull regime) are tagged for additional context.
Use Cases
Identify and track momentum lifecycles across any market
Spot rare extremes for potential reversal opportunities
Filter out low-momentum whipsaws in ranging conditions
Compare momentum strength across multiple symbols
Support systematic and rule-based strategy development

Custom MACD (Normalized by ATR)This is a modified version of the classic MACD indicator.
Instead of using just the difference between EMA(12) and EMA(26), this version normalizes the MACD line by ATR(26) and scales it by 100:
* 100
This adjustment makes the MACD relative to market volatility, allowing for easier comparison across assets and timeframes.
The idea of normalizing MACD with ATR comes from Alex Spioglou, who suggested this improvement to enhance signal consistency in volatile markets.
Plots include the ATR-normalized MACD line, the signal line, and the histogram, with rising/falling color cues and built-in alert conditions.

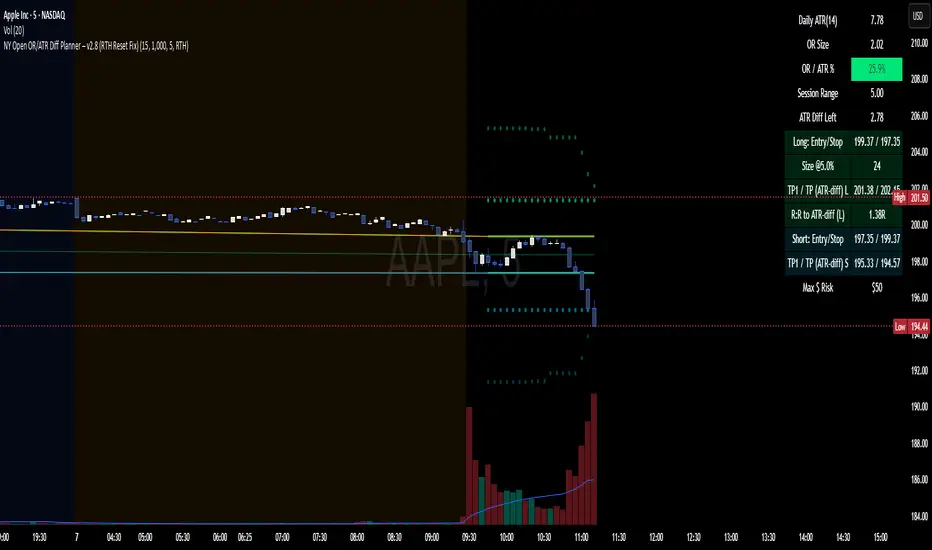
NY Open OR/ATR Diff Planner – v2.8 NY Open OR/ATR Diff Planner – v2.8 (Hi-Contrast)
Trade the Opening Range Breakout with a plan, not vibes.
This tool builds the NY Opening Range (OR) from the cash open and overlays a complete, risk-based execution plan: precise entry, structural stop, position size, targets, and R:R — all tied to the Daily ATR(14) and the remaining ATR “fuel” left in the day.
What it does
Opening Range: First N minutes after 09:30 ET (choose 5/15/30/60).
Today-only lines: Automatically resets at 09:30; no carry-over from prior days.
Session aware: Works on RTH or ETH charts. OR always anchors at 09:30 ET.
Fuel model: Computes Session Range (since 09:30) and ATR Diff Left = Daily ATR − Session Range.
Entries & Stops:
Long plan: Entry = ORH, Stop = ORL
Short plan: Entry = ORL, Stop = ORH
Targets:
TP1 = 1R (distance of entry→stop)
TP (ATR-diff cap): Entry ± ATR Diff Left (caps greed when the day’s ATR is nearly spent)
Sizing & R:R: Position size = Account × Risk% / Risk per share, with live R:R to ATR-diff target.
Hi-contrast table: Clear readout of Daily ATR, OR size, OR/ATR%, Session Range, ATR left, entries/stops/TPs, size, and max $ risk.
Inputs
Opening Range (minutes): 5 / 15 / 30 / 60
Account Size ($) and Risk % per trade
Session mode: RTH (09:30–16:00) or ETH (chart’s session; still anchored at 09:30)
Also show Short plan (toggle)
Show info table (toggle)
How to use
Add on a 1–5m chart.
Choose your OR window (e.g., 15m = 09:30–09:45).
Set Account Size and Risk % (e.g., 4–5% for small accounts; adjust to taste).
Wait for the OR to complete.
Trade the break/retest with the levels shown:
Long: Break of ORH, SL at ORL, TP1 = 1R, TP2 = ATR-diff cap.
Short: Mirror logic.
If OR/ATR% > ~50% (red), the “fuel” is thin — be selective.
Why it helps build an edge
Objective structure: Clear levels and sizing remove guesswork.
Context-aware targets: ATR-diff keeps targets realistic to the day’s potential.
Discipline by design: One framework that’s easy to review, journal, and iterate.
Notes
This is an indicator (visual planner), not an order-placing strategy.
If you want a back testable version (one trade/day, optional retest rule, TP/SL logic), say the word — I can publish a strategy variant.
Keywords: ORB, Opening Range, ATR, Risk Management, Position Sizing, Day Trading, NYSE Open, Mean Reversion Fuel, Execution Planner
Anchored Volume-Weighted RSI & Multi-Normalized MACDAnchored Volume-Weighted RSI & Multi-Normalized MACD
Author: NEPOLIX
Overview
The "Anchored Volume-Weighted RSI & Multi-Normalized MACD" is a sophisticated Pine Script v6 indicator designed for TradingView. It combines an Anchored Volume-Weighted Relative Strength Index (VW-RSI) with a Multi-Normalized Moving Average Convergence Divergence (MACD) to provide traders with enhanced market analysis tools. This indicator allows for customizable anchoring, multiple normalization techniques, and stepped visualization for precise trend and momentum analysis.
Features
Anchored VW-RSI: Calculates a volume-weighted RSI anchored to a user-defined or auto-detected time point, offering a unique perspective on momentum with volume influence.
Multi-Normalized MACD: Supports various normalization methods, including Volume-Weighted, Min-Max, Volatility, Hyperbolic Tangent, Arctangent, and Min-Max with Smoothing, ensuring adaptability to different market conditions.
Flexible Anchoring: Choose from auto-detected anchor modes (1-day, 5-day, 30-day) or manual anchor time selection for tailored analysis starting from a specific point.
Stepped Visualization: Optional stepped mode for RSI and MACD values, reducing noise and highlighting significant changes based on user-defined thresholds.
Smoothing Options: Supports multiple moving average types (SMA, EMA, SMMA, WMA, VWMA) for RSI smoothing, with optional Bollinger Bands for volatility analysis.
Derivative Analysis: Plots derivatives for RSI and MACD to identify rate-of-change trends, with adjustable scaling and filtering.
Customizable Display: Options to toggle MACD line, signal line, histogram, and cross-point dots, with dynamic color changes based on market conditions.
Multi-Timeframe Support: Fetch data from higher timeframes for broader market context.
User-Friendly Inputs: Comprehensive input settings for general parameters, anchor settings, RSI, MACD, derivatives, and display options, organized into clear groups.
How It Works
VW-RSI: Computes a volume-weighted RSI by anchoring calculations to a specified time, using volume-weighted gains and losses for a more robust momentum indicator.
MACD Normalizations: Applies user-selected normalization techniques to the MACD, scaling it within defined bounds (-50 to 50 by default) for consistent comparison across instruments.
Anchoring Mechanism: Aligns calculations to a user-defined or auto-calculated anchor point (e.g., market open time adjusted for America/New_York timezone).
Stepped Mode: Discretizes RSI and MACD values into sections for clearer trend identification, with customizable section width and zero range.
Visualization: Plots RSI, MACD, signal lines, and histograms, with optional Bollinger Bands, derivatives, and stepped lines. Dynamic coloring highlights crossovers and histogram trends.
Use Cases
Trend Analysis: Use the anchored VW-RSI and normalized MACD to identify momentum shifts and trend strength.
Reversal Detection: Monitor overbought/oversold levels and MACD crossovers for potential reversal points.
Volatility Assessment: Leverage Bollinger Bands and volatility-normalized MACD for insights into market volatility.
Custom Strategies: Export variables (RSI, MACD, signal, etc.) for use in companion scripts or automated trading strategies.
Settings
General: Adjust section width, zero range, timeframe, and enable stepped mode.
Anchor Settings: Select auto or manual anchor modes, with options for 1-day, 5-day, or 30-day auto-anchoring, or manual bar selection.
RSI: Configure price source, length, smoothing type, Bollinger Bands multiplier, and derivative settings.
MACD: Set price source, fast/slow/signal lengths, normalization types, and derivative parameters.
Derivatives: Customize scale factors and filters for RSI and MACD derivatives.
Display Options: Toggle visibility of MACD, signal line, histogram, and crossover dots, with options for color changes.
Notes
Ensure the anchor time is valid when using manual mode by selecting a bar on the chart.
Normalization options should be chosen based on the instrument and market conditions for optimal results.
Stepped mode is ideal for reducing noise in volatile markets but requires careful threshold tuning.
The indicator is computationally intensive due to multiple normalizations; test on smaller datasets if performance issues arise.

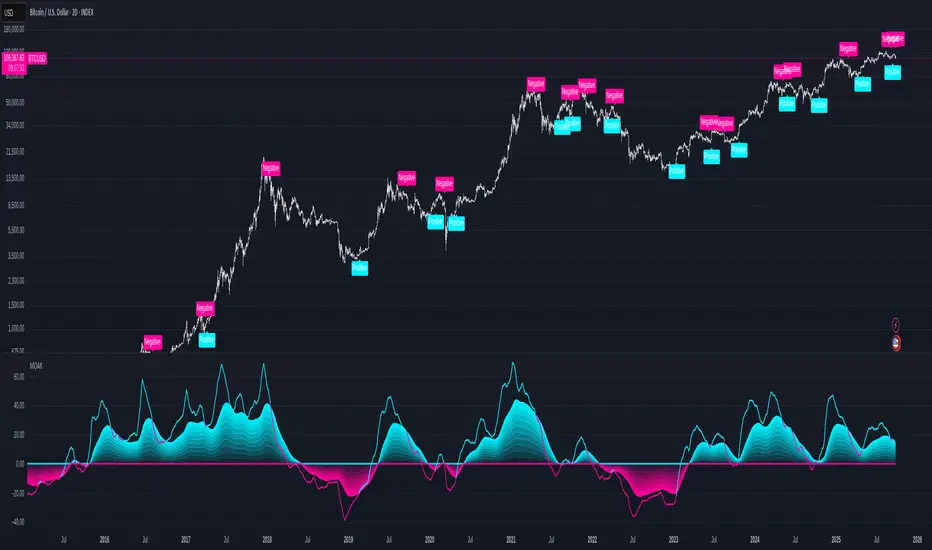
Multi-Oscillator Adaptive Kernel with MomentumMulti-Oscillator Adaptive Kernel w. Momentum
An adaptation of the indicator by AlphaAlgos : Multi-Oscillator-Adaptive-Kernel (MOAK) with Divergence . Please find the description of the indicator in the above link.
Apart from adding labels to show trend/momentum changes, the following changes have been made to the original script:
1. Sensitivity is used in the computation to scale the fast MOAK signal,
2. Selection between two indicator modes:
Trending - (the original script method) assesses whether smoothed MOAK is above/below 0 - for up/down trends respectively.
Momentum - assesses whether the fast MOAK signal is above/below the smoothed MOAK, and can be used to indicate potential trend reversals as momentum of current trend fades.
Universal Valuation ~ GForge
🎯 Universal Valuation - GForge
Overview:
The Universal Valuation indicator is a sophisticated technical analysis tool that combines 14 different technical indicators into a single, normalized composite Z-score. This revolutionary approach provides traders and investors with a comprehensive view of an asset's relative valuation state, helping identify potential overvalued and undervalued conditions across any market, any timeframe .
🌟 Key Features:
Multi-Indicator Fusion: Combines RSI, CCI, Bollinger Bands, Price Analysis, Chande Momentum, Disparity Index, Hurst Exponent, IMI, TEMA, VWAP, Intraday Momentum, and advanced Risk Ratios (Sharpe, Sortino, Omega)
Universal Compatibility: Works seamlessly across stocks, forex, crypto, commodities, indices, and any tradeable asset
Multi-Timeframe Support: Optimized for all timeframes from 1-minute scalping to monthly long-term analysis
Professional Visualization: 9 stunning color themes with gradient effects and customizable styling
Comprehensive Dashboard: Real-time table displaying individual indicator scores and overall valuation phase
Smart Alert System: Built-in notifications for extreme valuation conditions
Z-Score Normalization: All indicators standardized for consistent comparison and interpretation
🔬 Technical Methodology:
The indicator employs advanced statistical normalization using Z-scores to transform disparate technical indicators into a unified measurement system. This revolutionary approach solves the fundamental problem of combining indicators with different scales and ranges.
1H MNT
Z-Score Normalization Process:
Raw Calculation: Each indicator is first calculated using its traditional formula (RSI 0-100, CCI unlimited range, etc.)
Statistical Analysis: For each indicator, the system calculates a rolling mean and standard deviation over a customizable lookback period
Z-Score Conversion: Current reading is converted using: Z = (Current Value - Rolling Mean) / Rolling Standard Deviation
Standardization: All Z-scores are clamped between -5 and +5 to prevent extreme outliers from dominating the composite
Democratic Weighting: Each normalized indicator contributes equally to the final composite score
Composite Calculation: Final score = Sum of all active Z-scores / Number of active indicators
Why Z-Scores Make It Universal:
Z-scores transform any indicator reading into "how many standard deviations away from normal this reading is." This means:
• An RSI of 85 on a volatile crypto might have the same Z-score as an RSI of 75 on a stable stock
• A CCI reading of +200 in a trending market might be less extreme than +100 in a ranging market
• Price movements are automatically adjusted for each asset's historical volatility
• Different timeframes are automatically normalized for their typical volatility patterns
This mathematical approach ensures the indicator adapts to any asset's unique characteristics and market conditions.
📊 Detailed Component Analysis:
Technical Indicators:
RSI (Relative Strength Index):
Calculates momentum by comparing recent gains to recent losses over a customizable period (default 21). Values above 70 traditionally indicate overbought conditions, while values below 30 suggest oversold conditions. The Universal Valuation converts these raw RSI values into Z-scores, providing a normalized view of how extreme current RSI readings are compared to historical patterns.
CCI (Commodity Channel Index):
Measures the current price level relative to an average price level over a given period (default 30). CCI compares the typical price (high+low+close)/3 to its simple moving average and divides by the mean absolute deviation. Values above +100 or below -100 indicate price extremes. Our Z-score normalization helps identify when CCI readings are statistically significant.
Bollinger Bands Position:
Calculates where the current price sits within the Bollinger Bands envelope. A value of +1 means price is at the upper band, -1 at the lower band, and 0 at the middle (SMA). This component measures price deviation from the mean in standard deviation units, making it naturally statistical. The Z-score normalization reveals when band position readings are historically extreme.
Price Z-Score:
Direct statistical measurement of how far the current price deviates from its historical mean in standard deviation units. This is the purest form of valuation measurement, showing whether an asset is trading at statistically significant levels relative to its historical price range.
Momentum Indicators:
Chande Momentum Oscillator (CMO):
Unlike RSI, CMO uses the sum of gains and losses rather than averages, making it more sensitive to recent price changes. It calculates (sum of gains - sum of losses) / (sum of gains + sum of losses) × 100. Values range from -100 to +100. The Z-score normalization helps identify when momentum readings are unusually extreme.
Disparity Index:
Measures the percentage difference between current price and its simple moving average: (Price - SMA) / SMA × 100. This shows how far price has deviated from its average, with positive values indicating price above average and negative values below. Z-score normalization reveals when these deviations are statistically significant.
Intraday Momentum Index (IMI):
Similar to RSI but uses intraday price movements instead of closing prices. It compares gains and losses within each session (close vs open) rather than session-to-session changes. This captures intraday sentiment and momentum that closing-based indicators might miss. Particularly useful for detecting intraday reversal patterns.
Intraday Momentum:
Simple but effective measurement of daily price movement: (Close - Open) / Open × 100. This shows the percentage gain or loss within each trading session. When Z-score normalized, it reveals when intraday movements are historically extreme, often indicating climax buying or selling conditions.
Advanced Indicators:
TEMA (Triple Exponential Moving Average):
A sophisticated moving average that applies exponential smoothing three times to reduce lag while maintaining responsiveness. TEMA = 3×EMA₁ - 3×EMA₂ + EMA₃, where each EMA is applied to the previous result. The Z-score of TEMA helps identify when price has moved significantly away from this responsive trend line.
VWAP (Volume Weighted Average Price):
Calculates the average price weighted by volume, giving more importance to prices where more volume occurred. VWAP = Σ(Price × Volume) / Σ(Volume). This represents the "fair value" based on actual trading activity. Z-score normalization shows when current VWAP is statistically extreme relative to historical VWAP levels.
Hurst Exponent:
Advanced mathematical concept measuring market efficiency and trend persistence. Values near 0.5 indicate random walk (efficient market), above 0.5 suggest trending behavior, and below 0.5 indicate mean-reverting markets. The indicator converts this to an oscillator: (Hurst - 0.5) × 100, then applies Z-score normalization to identify extreme efficiency/inefficiency periods.
Risk Ratios:
Sharpe Ratio:
Classic risk-adjusted return measure: (Return - Risk-free Rate) / Standard Deviation of Returns. Higher values indicate better risk-adjusted performance. The Z-score normalization reveals when current risk-adjusted returns are historically high or low, helping identify periods of exceptional or poor risk-adjusted performance.
Sortino Ratio:
Improvement over Sharpe ratio that only penalizes downside volatility: (Return - Risk-free Rate) / Downside Deviation. This gives a more accurate picture of risk-adjusted returns since upside volatility isn't necessarily bad. Z-score normalization helps identify when downside risk-adjusted returns reach extreme levels.
Omega Ratio:
Sophisticated risk measure that considers the probability-weighted ratio of gains versus losses above a threshold: Σ(Gains above threshold) / Σ(Losses below threshold). Values above 1.0 indicate positive expected returns above the threshold. Z-score normalization reveals when probability-weighted risk/reward ratios reach historically significant levels.
🎨 Valuation Phases:
The composite Z-score translates into clear valuation phases:
🔵 Extremely Undervalued: Z-Score ≤ -2.0 (Rare buying opportunities)
🟦 Strongly Undervalued: Z-Score ≤ -1.3 (Strong buying signals)
🟨 Moderately Undervalued: Z-Score ≤ -0.65 (Potential value plays)
⚪ Fairly Valued: Z-Score -0.65 to 0.5 (Neutral territory)
🟨 Slightly Overvalued: Z-Score 0.5 to 1.2 (Caution advised)
🟧 Moderately Overvalued: Z-Score 1.2 to 2.0 (Consider profit-taking)
🔴 Strongly Overvalued: Z-Score > 2.0 (High risk, potential sell signals)
12H GOLD
🌍 Universal Application:
Why "Universal"?
Timeframe Independent: Statistical normalization adapts to any timeframe's volatility characteristics
Market Neutral: Works across different market conditions (trending, ranging, volatile, calm)
Configurable Components: Enable/disable specific indicators based on asset type and market conditions
Adaptive Parameters: All lookback periods are customizable for different trading styles
💡 Optimal Use Cases:
Swing Trading: Identify intermediate-term reversal points
Position Trading: Long-term value assessment for portfolio allocation
Day Trading: Intraday extreme condition alerts
Risk Management: Position sizing based on valuation extremes
Multi-Asset Analysis: Compare relative value across different instruments
Market Timing: Entry and exit point optimization
⚙️ Customization Options:
Component Selection: Enable/disable any of the 14 indicators
Lookback Periods: Adjust Z-score calculation periods for each component
Visual Themes: 9 professional color schemes plus custom colors
Alert Thresholds: Configurable extreme condition notifications
Dashboard Display: Toggle individual component visibility
Background Highlighting: Visual emphasis for extreme conditions
🎯 Interpretation Guide:
For Long Positions:
• Look for Z-scores below -1.3 for entry opportunities
• Consider profit-taking when Z-scores exceed +1.2
• Use extreme readings (< -2.0) for high-conviction entries
For Short Positions:
• Look for Z-scores above +2.0 for entry opportunities
• Cover positions when Z-scores fall below +0.5
• Avoid shorting during extreme undervaluation (< -1.3)
For Risk Management:
• Reduce position sizes during overvalued conditions
• Increase allocation during undervalued periods
• Use neutral zones (±0.5) for position adjustments
🔔 Alert System:
Built-in alerts notify you when:
Composite score enters/exits strong overvalued territory (±2.0)
Composite score enters/exits strong undervalued territory (±1.3)
Extreme conditions are reached (±2.5 for overvalued, -2.0 for undervalued)
Neutral crossovers occur (useful for trend changes)
📈 Performance Optimization:
The indicator includes several performance optimizations:
Efficient calculation methods to minimize processing load
Clamped Z-scores to prevent extreme outliers
Optimized table rendering for smooth operation
🎨 Visual Elements:
Main Plot: Composite Z-score line with dynamic gradient coloring
Zone Fills: Visual bands showing valuation regions
Reference Lines: Key threshold levels clearly marked
Background Highlighting: Extreme condition emphasis
Dashboard Table: Comprehensive component breakdown
Bar Coloring: Optional candlestick coloring based on valuation
🔧 Technical Requirements:
Requires sufficient historical data for accurate Z-score calculations
Recommended minimum: 300+ bars for optimal performance
Works on all TradingView subscription levels
📚 Educational Value:
This indicator serves as an excellent educational tool for:
Understanding statistical normalization in trading
Learning how multiple indicators can be combined effectively
Studying market valuation concepts across different assets
Developing a systematic approach to market analysis
⚠️ Important Notes:
The indicator works best with sufficient historical data
Consider market context and fundamental factors alongside technical signals
Backtest thoroughly before implementing in live trading
Adjust parameters based on specific asset characteristics and trading timeframe
Use in conjunction with other analysis methods for best results
---
⚠️ DISCLAIMER:
This indicator is provided for educational and informational purposes only and should not be considered as financial advice, investment advice, trading advice, or any other type of advice.
The Universal Valuation indicator is a technical analysis tool that provides statistical information about price movements and market conditions. It does not guarantee profits or predict future market movements with certainty.
---
Developed with precision for the TradingView community ~ GForge

MACD Aspray Hybrid Strategy The MACD Aspray Hybrid Strategy is a trend-following trading system based on a modified version of the MACD indicator.

MACD Aspray Hybrid Strategy The MACD Aspray Hybrid Strategy is a trend-following trading system based on a modified version of the MACD indicator.
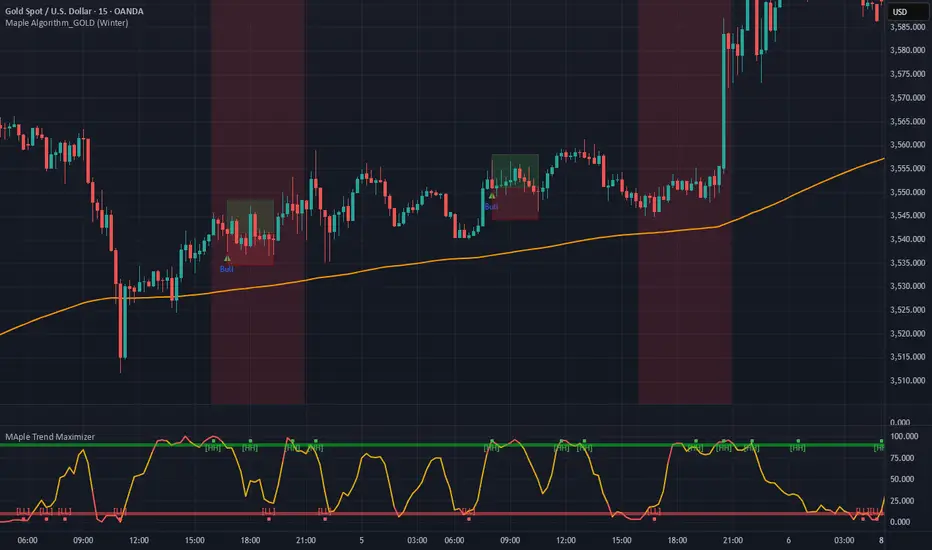
Maple Trend Maximizer – AI-Powered Trend & Entry IndicatorOverview:
Maple Trend Maximizer is an AI-inspired market analysis tool that identifies trend direction, highlights high-probability entry zones, and visually guides you through market momentum. Designed for traders seeking smart, data-driven signals, it combines trend alignment with proprietary AI-style calculations for precise timing.
Key Features:
AI Trend Detection:
Automatically identifies bullish and bearish trends using advanced smoothing and trend alignment techniques.
Momentum & Signal Lines:
Dynamic lines indicate market strength and potential turning points.
Colors change to highlight high-probability entry zones.
Entry Signals:
Optional visual markers suggest precise entries when trend direction and momentum align.
Configurable to reduce noise and focus on strong setups.
Multi-Timeframe Flexibility:
Works on intraday charts or higher timeframes for swing and position trading.
Customizable Settings:
Adjustable smoothing, trend sensitivity, and signal display options.
Lets you fine-tune the indicator to your trading style.
Benefits:
Quickly identifies market direction and optimal entries.
Provides clear, visually intuitive signals.
Can be used standalone or integrated into a larger strategy system.
Volume-Weighted RSI & Multi-Normalized MACD Overlay**Description**:
The "Volume-Weighted RSI & Multi-Normalized MACD Overlay" is a sophisticated indicator that plots a volume-weighted Relative Strength Index (VW-RSI) and a customizable Moving Average Convergence Divergence (MACD) directly on the price chart, enhancing momentum and trend analysis for traders. Designed for stocks, forex, crypto, and more, it supports multi-timeframe (MTF) analysis and offers flexible normalization and scaling options for precise visualization.
**Key Features**:
- **Volume-Weighted RSI**: A volume-sensitive RSI normalized to a configurable range (default: -50/+50), with optional smoothing (SMA, EMA, WMA, VWMA, SMMA, or Bollinger Bands). Overbought (+20) and oversold (-20) lines are plotted relative to a user-defined price source (default: ohlc4).
- **Multi-Normalized MACD**: Supports five bounded normalization methods: Min-Max, Volatility Min-Max, Hyperbolic Tangent, Arctangent, and Min-Max with Smoothing, scaled to the same range as RSI for unified analysis.
- **Price Chart Overlay**: Plots RSI, RSI MA, MACD, MACD Signal, zero-line, overbought (+20), and oversold (-20) lines, anchored to a customizable price source (e.g., ohlc4, hl2).
- **Flexible Scaling**: Choose between high/low range (default) or ATR-based scaling, with separate lookbacks for RSI and MACD (default: 128). Adjust offset and scale factor multipliers for fine-tuned visuals.
- **Customizable Display**: Toggles for RSI (with MA), MACD (with Signal), zero-line, overbought/oversold lines, and RSI background coloring (>20/< -20). Dynamic MACD colors (cyan/magenta) and transparency options enhance clarity.
**How to Use**:
1. Add to any chart (e.g., BTCUSD, SPY, 1H, 1D).
2. Configure settings:
- **General**: Set bounds (-50/+50), timeframe, scaling (high/low or ATR), zero-line source (e.g., ohlc4), and multipliers.
- **RSI**: Adjust price source, length (9), and smoothing options.
- **MACD**: Select price source, lengths (9/21/9), and normalization (e.g., Volatility Min-Max).
- **Display Options**: Toggle lines and background; adjust transparency.
3. Interpret signals: RSI > +20 (overbought), < -20 (oversold); MACD/Signal crosses for momentum; zero-line as reference.
4. Use with the companion "Volume-Weighted RSI & Multi-Normalized MACD" script for pane-based analysis if desired.
**Why Use It?**
Ideal for traders seeking a visually intuitive overlay of RSI and MACD on price action, with customizable scaling and MTF support. Perfect for trend-following, mean-reversion, and cross-market strategies.
**Notes**:
- Ensure a bounded normalization (e.g., Volatility Min-Max) is selected for MACD plotting.
- Adjust scaling multipliers for optimal visibility on volatile assets.
- Feedback welcome to enhance future versions!
**Author**: nepolix

G. Santostasi Bitcoin Power Law Monte Carlo IndicatorOverview:
The "G. Santostasi Bitcoin Power Law Monte Carlo" is a sophisticated TradingView indicator inspired by the Bitcoin Power Law Theory developed by physicist Giovanni Santostasi.
This theory posits that Bitcoin's price follows a power-law relationship with time, measured in days since the Bitcoin Genesis Block (January 3, 2009). The indicator leverages this framework to analyze Bitcoin's price dynamics through a normalized metric called "Daily Slopes," which captures local deviations from the long-term power-law trend. By fitting these Daily Slopes to a t-location scale distribution on a moving window, the indicator computes key parameters (mu, sigma, and nu) and plots them along with deviation bands. This allows traders to identify local minima and maxima in price action relative to the global power-law slope of approximately 5.9.Additionally, the indicator incorporates Monte Carlo simulations to project potential future price paths up to 100 days ahead, generating up to 500 randomized trajectories based on the statistical properties of the Daily Slopes. This tool is particularly useful for understanding Bitcoin's inherent diminishing returns, assessing market stability, and forecasting short-term scenarios while emphasizing the asset's long-term predictability as a self-organizing network akin to natural systems.
The indicator does not predict exponential growth but instead highlights Bitcoin's scale-invariant behavior, where returns diminish predictably over time—a feature, not a bug, of its design. It has been observed that the core metric (mu) remains stable across Bitcoin's entire history, reinforcing the power law as Bitcoin's "DNA."
Core Concept: Daily Slopes:
At the heart of the indicator is the "Daily Slopes" metric, which normalizes daily logarithmic returns to account for the diminishing nature predicted by the power-law model. This normalization reveals a stable "local slope" (n) that oscillates around a fixed global value, providing insight into Bitcoin's consistent behavior over time.
Definition and Calculation:
Daily logarithmic returns are calculated as log(P2/P1)\log(P_2 / P_1)\log(P_2 / P_1), where P2P_2P_2 is the current day's closing price and P1P_1P_1 is the previous day's closing price.
According to the power-law model, if Bitcoin's price ( P(t) ) follows P(t)=c⋅tnP(t) = c \cdot t^nP(t) = c \cdot t^n
(where ( t ) is days since the Genesis Block, ( c ) is a constant, and n≈5.9n \approx 5.9n \approx 5.9
is the global slope from log-log regression), then the expected daily log return is n⋅log((t+1)/t)n \cdot \log((t+1)/t)n \cdot \log((t+1)/t)
.
The Daily Slope is thus the normalized value:
Daily Slope=log(P2/P1)log((t+1)/t)\text{Daily Slope} = \frac{\log(P_2 / P_1)}{\log((t+1)/t)}\text{Daily Slope} = \frac{\log(P_2 / P_1)}{\log((t+1)/t)}
This normalization "stabilizes" the returns by dividing out the theoretical decay factor log((t+1)/t)\log((t+1)/t)\log((t+1)/t)
, which diminishes as ( t ) increases (reflecting slower growth in mature systems).
Result: The Daily Slope represents a "local n" that should remain stable, oscillating around the global slope of ~5.9 without long-term drift. Empirical data shows this stability holds over Bitcoin's 16-year history, with oscillations but no systematic change—indicating Bitcoin has statistically "done the same thing" since inception.
Interpretation:
Positive deviations (Daily Slope > 5.9) signal bullish momentum or potential local maxima.
Negative deviations (Daily Slope < 5.9) indicate bearish pressure or local minima.
The metric adjusts for absolute volatility, which appears to decrease over time due to diminishing returns. However, when normalized via Daily Slopes, relative volatility has been constant for the last 8 years, underscoring Bitcoin's resilience to macroeconomic factors.
Distribution Fitting and Parameter Estimation:
To quantify the behavior of Daily Slopes, the indicator fits them to a t-location scale distribution (Student's t-distribution with location and scale parameters) over a user-configurable moving window (e.g., 365 days for annual analysis).
This distribution is chosen as the best empirical fit for the heavy-tailed, outlier-prone nature of Bitcoin's normalized returns, outperforming alternatives like Gaussian or Laplacian.t-Location Scale Distribution:
The distribution is parameterized by:μ (mu): Location parameter, representing the mean or "average slope." This is the most critical metric, stable around 5.9 across Bitcoin's history. It tracks the central tendency of Daily Slopes and signals overall market regime (e.g., rising mu indicates strengthening momentum).
σ (sigma): Scale parameter, akin to standard deviation, measuring the spread or volatility of slopes. It has shown slight increases in certain contexts (e.g., hash rate applications) but remains stable for price data.
ν (nu): Degrees of freedom, controlling the "tailedness" (lower ν means heavier tails, capturing extreme events like bubbles or crashes).
Fitting is performed on a rolling basis, updating μ, σ, and ν dynamically.
Plotting:
Local μ: Plotted as a central line, showing the moving average slope.
Deviation Bands: μ + σ (upper band) and μ - σ (lower band), highlighting 1-standard-deviation ranges.
These bands help identify overbought/oversold conditions by measuring deviations from the global mean of 5.9.
For example:
Crossing above μ + σ may signal a local maximum (potential sell opportunity).
Dipping below μ - σ could indicate a local minimum (buy signal).
Additional visualizations include raw Daily Slopes (oscillating series) and smoothed averages for clarity.
Stability and Insights:μ has remained remarkably stable over 16 years, oscillating without drift, validating the power law's predictive power.
Parameters may show minor trends in rolling windows (e.g., slight σ increases), but no monotonic drift is observed in price data. This stability extends to related metrics like addresses and hash rate, where Daily Slopes can be derived similarly (e.g., via log(A2/A1) / log((t+1)/t) for addresses, yielding equivalent slopes around 5.9).
Monte Carlo Simulations for Future Projections
The indicator enables short-term forecasting (up to 100 days) by reversing the normalization process and simulating paths using the fitted distribution.
Projection Mechanism:
Recover expected daily returns: Multiply the sampled Daily Slope (drawn from the t-location scale distribution with current μ, σ, ν) by log((t+1)/t)\log((t+1)/t)\log((t+1)/t)
.
Generate randomized samples to create up to 500 Monte Carlo paths, incorporating the distribution's properties to model uncertainty (e.g., heavy tails for rare events).
Simulations can use the full historical dataset for broader spreads or recent windows (e.g., last 8 years) for tighter, regime-specific forecasts.
Output: Fan chart of projected prices, showing median path (based on μ), confidence intervals (e.g., ±σ bands), and extreme scenarios.
Applications and Limitations:
Useful for risk assessment, e.g., probability of reaching $200K in 2025 is low (1-2% per recent simulations).
Assumes parameters evolve minimally; if drift is detected, simulations can adjust dynamically.
Not for long-term predictions (beyond 100 days), as the power law excels in multi-year trends rather than short-term noise.
Empirical validation: Simulations align with historical backtests, where deviations (bubbles/crashes) revert to the power-law trend.
Usage Notes Inputs:
Customize moving window size, number of Monte Carlo paths (default: 500), projection horizon (up to 100 days), and global slope (default: 5.9).
Visuals: Overlay on BTCUSD log-log chart for context; bands and simulations appear in separate panels.
Caveats: This is not financial advice. The power law describes emergent behavior from network effects, not guarantees. Cycles and bubbles are secondary deviations, not core to the model.
Extensions: The concept applies beyond price (e.g., to addresses or hash rate), revealing interconnected power laws in Bitcoin's ecosystem.
This indicator transforms Santostasi's theoretical insights into a practical tool, empowering users to navigate Bitcoin's dynamics with statistical rigor.

Multi-Timeframe mybullandbearThis Multi-Timeframe RSI + Ultimate MA System combines RSI and customizable moving averages (SMA, EMA, WMA, HullMA, VWMA, RMA, TEMA) to generate powerful buy/sell signals across 5m, 15m, 1h, and 4h timeframes. Visualize signals with clear chart labels (BUY/SELL) and a multi-timeframe table showing RSI status, MA trends, and signal strength. Ideal for traders seeking trend confirmation and reversal signals.
Enable/disable RSI, MA cross, or combined signals, and adjust MA types/lengths. Use aligned signals across timeframes for stronger entries. Best with backtesting for your asset.
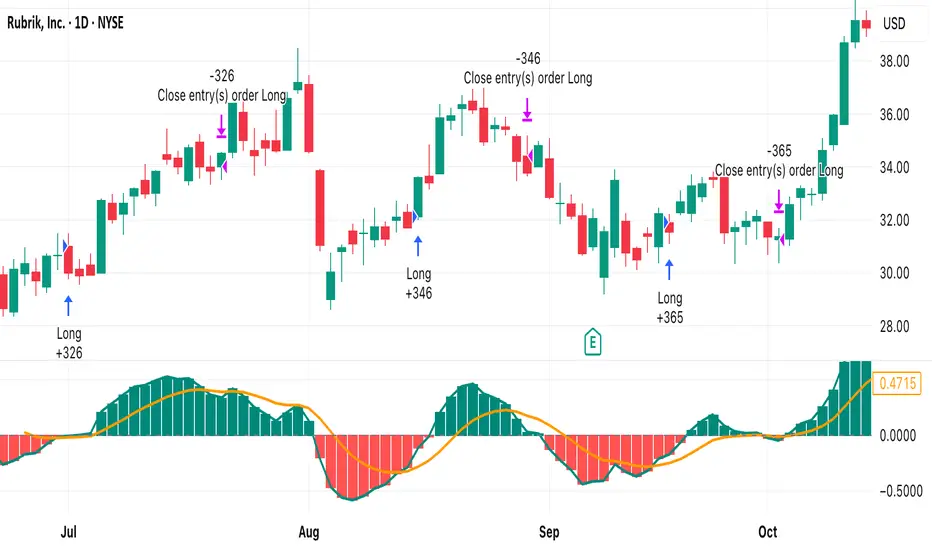
BR Cross Swing - MACD HistRawThis strategy looks at the MACD Relationship through the same logic but mainly focuses on breaking things down and the application on raw values.

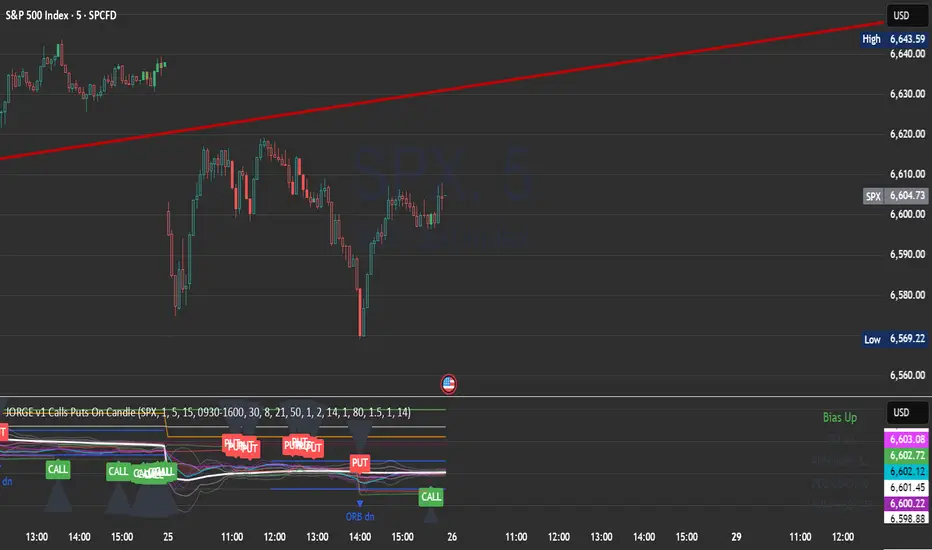
JORGE v1 Calls Puts On CandleA multi-timeframe script built for SPX 500 options traders.
• 1m entries, 5m bias, 15m levels
• CALL signals in bright green, PUT signals in bright red
• Black arrows mark each trade idea directly on the candles
• Includes VWAP bands, EMA cloud bias, opening range, ATR targets/stops, and previous day levels
• Risk mapping with TP/SL zones based on ATR multiples
• Alerts ready for CALL, PUT, and Opening Range Breakouts
This script is designed to simplify intraday decision making, giving you fast visual signals plus context levels for discipline and consistency.
Enjoy trading! 🚀📉📈
Sols Day Trading Signals (5m / 10m)This indicator is designed for day trading on the 5-minute and 10-minute charts.
Includes:
EMA 9 & EMA 21 crossover signals
MACD momentum confirmation
RSI trend filter (50+)
Buy/Sell labels directly on the chart
💡 How to Use:
Go long when EMA 9 crosses above EMA 21, MACD is positive, and RSI is above 50
Go short when EMA 9 crosses below EMA 21, MACD is negative, and RSI is below 50
Best used with proper risk management (1-2% per trade)
⚠️ Disclaimer: This is for educational purposes only — always backtest and trade responsibly.

3CRGANG - SUPPLY/DEMAND ZONESOverview
The "3CRGANG - SUPPLY/DEMAND ZONES" indicator is a sophisticated tool designed to identify, classify, and visualize dynamic supply (resistance) and demand (support) zones on your TradingView charts. It goes beyond basic level plotting by incorporating a state-based system that tracks how zones evolve based on price interactions, helping traders anticipate potential reversals, continuations, or breakdowns at key levels. Zones are categorized into states like Untested, Verified, Weak, Flipped, and Broken, providing contextual insights into their strength and reliability. This indicator is particularly useful for swing traders, scalpers, and position traders who rely on price action around institutional levels, as it filters noise and highlights actionable zones with customizable alerts and visual aids.
Built on Pine Script v6, it overlays directly on your chart with semi-transparent boxes for zones, optional labels for quick reference, and alert triggers for zone tests. The invite-only access ensures users benefit from its proprietary enhancements, making it a premium alternative to generic zone indicators.
How It's Built: Core Concepts and Calculations
At its foundation, the indicator detects potential supply and demand zones using a fractal-based pivot detection method, which identifies local highs and lows by comparing a central bar's price to surrounding bars within a validation window. This window is dynamically adjusted via a "Fractal Sensitivity Factor" (default 6.0), which scales the lookback period relative to your chart's timeframe—ensuring zones adapt to market volatility without over- or under-fitting. For example, on a 15-minute chart, this might equate to checking 18-24 bars around a candidate pivot for confirmation.
Once a fractal pivot is confirmed:
Zone Boundaries: The zone is constructed around the pivot high/low, extended by a fraction of the Average True Range (ATR, period 7) using the "Zone Boundary ATR Multiplier" (default 0.3). This creates a band that accounts for typical price fluctuations, preventing overly tight or loose zones. A subtle "Zone Fuzz Factor" (default 0.15) adds a minor buffer to the ATR-derived extension, allowing for fine-tuning in choppy markets without altering the core range.
Merging Overlaps: To avoid clutter, overlapping zones of the same type (or flipped counterparts) are intelligently merged through up to 2-3 passes (configurable via "Max Merge Passes"). This consolidation increases the "test count" for the resulting zone, reflecting cumulative price rejections and enhancing its perceived strength.
Zone Testing and Classification: Price interactions with zones are evaluated using one of two methods:
Dynamic - Bars: Counts tests when price wicks into the zone from outside or closes out after entering, with a minimum gap (0-2 bars) to prevent rapid-fire counts in ranging markets.
Mechanical - Pivots: Enhances the dynamic method by requiring a mechanical pivot (e.g., via TradingView's built-in pivothigh/pivotlow) within the zone during the test, adding a layer of confirmation for more conservative signals. Tests are tallied with a "Weak Zone Test Threshold" (default 1), classifying zones as:
Untested: No interactions yet—fresh levels with high potential.
Weak: 1 or fewer meaningful tests—early signals that may fade.
Verified: Multiple tests (above threshold)—strong, repeatedly respected levels.
Flipped: A broken zone that reverses role (e.g., resistance becomes support), based on a decisive close beyond the boundary.
Broken: Permanently invalidated by a strong breakout, optionally displayed for historical context.
Time and Session Integration: Zones are timestamped and limited to a "Back Limit" (default 500 bars) for performance. It incorporates a custom holiday library (importing from RotemB's LIBRARY_3CRGANG_Holidays_Library) to detect closures across major exchanges (NYSE, LSE, FSE, SSX, TSE, HKSE), adjusting session times for half-days and full holidays. Alerts are filtered by user-selected sessions, weekends, and a "Do Not Disturb" (DND) mode with timezone-aware scheduling (e.g., UTC+3 Jerusalem default, selectable from 90+ global options).
This combination of fractal detection, ATR-based sizing, multi-pass merging, and test-driven state evolution draws from classic supply/demand principles but refines them with proprietary logic to handle real-world market dynamics, such as volatility clustering and institutional session biases.
Why It’s Useful
Supply and demand zones are foundational to price action trading, representing areas where large orders accumulate and cause reversals or pauses. This indicator streamlines the process by automating zone discovery and maintenance, saving time compared to manual drawing. Its state system adds predictive value: Verified zones often signal high-probability bounces, while Flipped ones highlight role reversals for trend continuation trades. Alerts notify you of tests in real-time, ideal for multi-chart monitoring, and session/holiday filters reduce false signals during low-liquidity periods (e.g., no alerts on Christmas for NYSE-linked assets).
Traders benefit from reduced emotional bias—zones "age out" beyond the back limit, focusing on recent action—and customizable visuals prevent chart overload. In volatile markets like forex or crypto, the ATR-adjusted boundaries adapt better than fixed-percentage methods, while the test count helps gauge exhaustion (e.g., over-tested Weak zones may signal impending breaks). Overall, it enhances decision-making by providing not just levels, but their evolving context.
How to Use It
Add to Chart:
Search for "3CRGANG - SUPPLY/DEMAND ZONES" in TradingView's invite-only scripts (access required). Apply to any timeframe from 1-minute to yearly, though it shines on intraday (15M-4H) for active trading.
Configure Inputs:
Test Mode: Choose "Dynamic - Bars" for sensitive, wick-focused testing or "Mechanical - Pivots" for stricter, pivot-confirmed interactions. Adjust "Minimum Test Gap" (0-2) to filter rapid tests and "Weak Zone Test Threshold" (1-3) to define strength tiers.
Pivot Filters: Tune "Fractal Sensitivity Factor" (5-14) for fewer/more zones—higher values for smoother trends, lower for chop.
Zone Width: Set "Zone Boundary ATR Multiplier" (0-1) for tighter/wider bands; use "Zone Fuzz Factor" (0-1) sparingly for boundary tweaks.
Visual: Select zone style (Solid/Dashed/Dotted), linewidth (1-3), and horizontal extension (None/Right/Both). Toggle visibility per state (e.g., hide Broken for cleaner charts).
Labels: Enable "Show Labels" for state/type info; add "Show Zone Size" (in pips/$) and "Show Test Count" for details. Adjust shift for positioning.
Alerts: Enable per state (Untested/Weak/Verified/Flipped). Filter by sessions (e.g., enable NYSE for US equities), holidays, weekends, and DND (set time ranges in your timezone to mute notifications).
Colors: Customize per state/type for intuitive visuals (e.g., red shades for resistance).
Trading Application:
Entries: Buy at Verified Demand (green) tests, sell at Verified Supply (red). Use Flipped zones for breakout confirmation.
Exits/Risk: Place stops beyond zone boundaries; trail profits on Weak/Flipped signals indicating fading strength.
Alerts Setup: In TradingView's alert dialog, select this indicator and configure for "alert() function calls only" to receive zone-test notifications.
Multi-Timeframe: View higher-TF zones on lower charts for confluence (e.g., daily zones on 1H).
Best Practices: Combine with volume or oscillators; backtest on your asset to optimize sensitivity.
Chart Example: XAG/USD (m5 timeframe)
Chart Notes
The chart displays zones on XAGUSD (M5 timeframe), presenting a clear price action structure with three distinct zones. A green Verified Support zone, marked with a translucent green box, indicates a robust demand level that has been tested multiple times and held firm. A blue Weak Support zone, outlined with a lighter blue box, reflects a less-tested support level with fewer rejections, suggesting lower reliability. A gold Flipped Resistance zone, highlighted with a golden box, initially acted as a resistance with rejections before breaking through and retesting as a support zone, showcasing its transition. Labels appear to the right of each zone, displaying details such as "VERIFIED SUPPORT (6.72 points, T=3)" for the Verified zone, "WEAK SUPPORT (6.9 points, T=1)" for the Weak zone, and "FLIPPED SUPPORT (3.85 points, T=10)" for the Flipped zone, with sizes in dollars (or pips if under $1) and test counts included. Zones extend horizontally to the right based on the user-defined shift setting, with customizable dashed or dotted borders for enhanced visual clarity.
Requires 500 bars of history for optimal performance. Alerts are muted during holidays (e.g., Lunar New Year) or Do Not Disturb periods.
Settings
Test Mode: Choose method (Dynamic - Bars or Mechanical - Pivots), set minimum test gap (0-2 bars), and weak zone threshold (1-3 tests).
General: Adjust back limit (250-1000 bars).
Pivot Filters: Set fractal sensitivity factor (5-14) and max merge passes (1-3).
Zone Width: Define ATR multiplier (0-1) and fuzz factor (0-1).
Visual: Select zone style (Solid, Dashed, Dotted), line width (1-3), shift end right (1-50 bars), and extension (None, Right, Both).
Visibility: Toggle display for each state (Untested, Verified, Weak, Flipped, Broken).
Labels: Enable labels, set shift (1-50 bars), size, and show size/test counts.
Alerts: Enable alerts by state (Untested, Weak, Verified, Flipped).
DND Settings: Set timezone, Do Not Disturb hours, and weekend alerts.
Sessions Alerts: Filter alerts by exchange (NYSE, LSE, etc.) and holiday settings.
Colors: Assign colors to each zone state and type.
Why It's Unique and Worth Invite-Only Access
While supply/demand indicators exist, this one stands out through its integrated ecosystem: adaptive fractal pivots with sensitivity scaling, multi-pass overlap merging that preserves test history, and a nuanced state machine that evolves zones based on configurable test mechanics—far beyond simple high/low plotting or basic breakouts. The proprietary blending of ATR fuzzing, retroactive test validation during zone creation, and global exchange holiday/session filtering (with half-day adjustments) minimizes irrelevant alerts, a common pain point in public scripts. It doesn't rely solely on built-ins or educational code; instead, it enhances them with custom logic for zone lifecycle management, making it resilient across assets and timeframes.
This originality justifies its closed-source nature—revealing the full interplay of fractal windowing, merge algorithms, and alert conditioning could dilute its edge. As an invite-only script, it provides clear value through premium features like timezone-aware DND, comprehensive holiday integration (e.g., Lunar New Year for HKSE), and state-aware alerts, which aren't replicated in free alternatives. Traders seeking an efficient, low-noise tool for institutional-level analysis will find it worth the access, as it delivers actionable insights that generic indicators overlook.
Disclaimer
This indicator assists in zone identification but does not guarantee success. Trading involves risk, and past performance is not indicative of future results. Always use proper risk management.

Algorithmic Value Oscillator [CRYPTIK1]Algorithmic Value Oscillator
Introduction: What is the AVO? Welcome to the Algorithmic Value Oscillator (AVO), a powerful, modern momentum indicator that reframes the classic "overbought" and "oversold" concept. Instead of relying on a fixed lookback period like a standard RSI, the AVO measures the current price relative to a significant, higher-timeframe Value Zone .
This gives you a more contextual and structural understanding of price. The core question it answers is not just "Is the price moving up or down quickly?" but rather, " Where is the current price in relation to its recently established area of value? "
This allows traders to identify true "premium" (overbought) and "discount" (oversold) levels with greater accuracy, all presented with a clean, futuristic aesthetic designed for the modern trader.
The Core Concept: Price vs. Value The market is constantly trying to find equilibrium. The AVO is built on the principle that the high and low of a significant prior period (like the previous day or week) create a powerful area of perceived value.
The Value Zone: The range between the high and low of the selected higher timeframe.
Premium Territory (Distribution Zone): When the oscillator moves into the glowing pink/purple zone above +100, it is trading at a premium.
Discount Territory (Accumulation Zone): When the oscillator moves into the glowing teal/blue zone below -100, it is trading at a discount.
Key Features
1. Glowing Gradient Oscillator: The main oscillator line is a dynamic visual guide to momentum.
The line changes color smoothly from light blue to neon teal as bullish momentum increases.
It shifts from hot pink to bright purple as bearish momentum increases.
Multiple transparent layers create a professional "glow" effect, making the trend easy to see at a glance.
2. Dynamic Volatility Histogram: This histogram at the bottom of the indicator is a custom volatility meter. It has been engineered to be adaptive, ensuring that the visual differences between high and low volatility are always clear and dramatic, no matter your zoom level. It uses a multi-color gradient to visualize the intensity of market volatility.
3. Volatility Regime Dashboard: This simple on-screen table analyzes the histogram and provides a clear, one-word summary of the current market state: Compressing, Stable, or Expanding.
How to Use the AVO: Trading Strategies
1. Reversion Trading This is the most direct way to use the indicator.
Look for Buys: When the AVO line drops into the teal "Accumulation Zone" (below -100), the price is trading at a discount. Watch for the oscillator to form a bottom and start turning up as a signal that buying pressure is returning.
Look for Sells: When the AVO line moves into the pink "Distribution Zone" (above +100), the price is trading at a premium. Watch for the oscillator to form a peak and start turning down as a signal that selling pressure is increasing.
2. Best Practices & Settings
Timeframe Synergy: The AVO is most effective when your chart timeframe is lower than your selected "Value Zone Source." For example, if you trade on the 1-hour chart, set your Value Zone to "Previous Day."
Confirmation is Key: This indicator provides powerful context, but it should not be used in isolation. Always combine its readings with your primary analysis, such as market structure and support/resistance levels.

Multi Momentum 10/21/42/63 — Histogram + 2xSMAMY MM INDICATOR INDIRED BY KARADI
It averages four rate-of-change snapshots of price, all anchored at today’s close.
If “Show as %” is on, the value is multiplied by 100.
Each term is a simple momentum/ROC over a different lookback.
Combining 10, 21, 42, 63 bars blends short, medium, and intermediate horizons into one number.
Positive MM → average upward pressure across those horizons; negative MM → average downward pressure.
Why those lengths?
They roughly stack into ~2× progression (10→21≈2×10, 21→42=2×21, 63≈1.5×42). That creates a “multi-scale” momentum that’s less noisy than a single fast ROC but more responsive than a long ROC alone.
How to read the panel
Gray histogram = raw Multi-Momentum value each bar.
SMA Fast/Slow lines (defaults 12 & 26 over the MM values) = smoothing of the histogram to show the trend of momentum itself.
Typical signals
Zero-line context:
Above 0 → bullish momentum regime on average.
Below 0 → bearish regime.
Crosses of SMA Fast & Slow: momentum trend shifts (fast above slow = improving momentum; fast below slow = deteriorating).
Histogram vs SMA lines: widening distance suggests strengthening momentum; narrowing suggests momentum is fading.
Divergences: price makes a new high/low but MM doesn’t → potential exhaustion.
Compared to a classic ROC
A single ROC(20) is very sensitive to that one window.
MM averages several windows, smoothing idiosyncrasies (e.g., a one-off spike 21 bars ago) and reducing “lookback luck.”
Settings & customization
Lookbacks (10/21/42/63): you can tweak for your asset/timeframe; the idea is to mix short→medium horizons.
Percent vs raw ratio: percent is easier to compare across symbols.
SMA lengths: shorter = more reactive but choppier; longer = smoother but slower.
Practical tips
Use regime + signal: trade longs primarily when MM>0 and fast SMA>slow SMA; consider shorts when MM<0 and fast
