EMA Crossover + Angle + Candle Pattern + Breakout (Clean)mrdfgdfew;qwiohj'fjpqwpodkqsk [pal
a'laoduasipdjascm[osfw0e9fj[ekf[pk[
pfi[0wejf[oewfkj[sofk
Candlestick analysis

EMA Crossover + Angle + Candle Pattern + Breakout (Clean)+mrit uses 9 15 ema startegy with angle and candle also candle used are pin bar , hammer, full body

mayank raj indicatorit uses 9 and 15 ema strategy with angle so that u dont enter in sideways market also the candle entries are hmmer,pinbar,fullbody

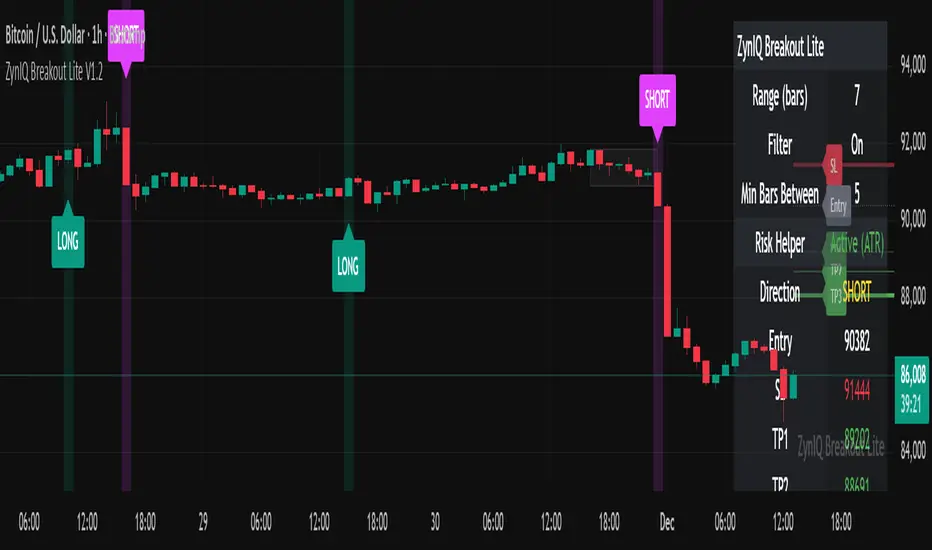
ZynIQ Breakout Lite v1.2 - (Lite Pack)Overview
ZynIQ Breakout Lite v1.2 provides a streamlined breakout framework designed to highlight expansion moves from short-term consolidation. It focuses on clarity and simplicity, making it suitable for intraday and swing trading.
Key Features
• Breakout range detection based on a configurable lookback period
• Optional minimum candle-range filter
• Simple signal spacing to reduce clustered signals
• Direction-aware breakout triggers (non-repainting)
• Optional ZynIQ Risk Helper for structured SL/TP planning
• Optional HUD panel showing current settings and breakout context
Use Cases
• Identifying range breakouts
• Highlighting directional shifts
• Quickly assessing breakout structure with lightweight visuals
Notes
This tool assists with breakout structure and risk planning. It is not a trading system by itself. Use with your preferred confirmation tools and risk management.
Hurst Flow • @Capital.comDescription
Hurst Flow is a regime-adaptive analytical tool that measures the continuous intention force behind market behavior.
It blends momentum and persistence analysis to quantify how strongly price movement aligns with trend continuation versus mean reversion.
The output is a normalized continuous force line:
Positive values indicate increasing long-side capital exposure — markets showing trend-persistence and momentum alignment.
Negative values reflect strengthening short-side capital exposure — environments favoring mean reversion or fading moves.
Internally, the indicator processes open-price rate-of-change dynamics through adaptive smoothing, persistence estimation, and standardized scaling, producing a stable and comparable signal across time frames and assets.
Use Hurst Flow as a market regime compass — to gauge bias, filter trades, or allocate exposure intensity dynamically.
Input descriptions
TF — Timeframe used to compute the signal. Higher TF = smoother, less whipsaw, but more lag.
ROC length (Open) — Lookback for Open-to-Open rate of change (base momentum horizon).
EMA length — Smoothing for ROC; increases stability at the cost of responsiveness.
Hurst window — Window for Hurst-style persistence estimate; governs regime sensitivity.
Standartizatoin window — Period for standardization; makes values comparable across assets/timeframes.
Scale factor (0..1) — Final gain applied to the standardized signal; use <1 to temper amplitude.
Presets/Backtest
Below is a list of presets that can be used to test indicators. The presets cover various asset classes and time frames, demonstrating versatility and high customizability. To do this, you can use a special strategy Target % Rebalancer Based Strategy on Intention Indicator . The entry signal for the strategy is the output signal of the indicator from the chart, which can be selected from a special drop-down list. A detailed description of the strategy can be found on a special page. The presets presented were created on instruments not included in the sample.
Below are the basic presets for the strategy. Other configuration functions can be used to fine-tune the strategy.
The strategy settings are the same for all of the presets listed. The time interval must be set for both the indicator and the chart.
Strategy fine tuning
Enable Hysteresis + Cooldown : Off
Risk & costs
Enable Max Daily Loss Halt : Off
Commission : 0.1%
============== Pre-Sets for Hurst Flow Indicator =============================
Preset Gold
Chart bar size: 3D
Indicator settings
TF : 3D
ROC : 10
EMA : 22
Hurst : 16
Standardization window length : 8
Scale : 1
====================================================
Preset Crude Oil:USOIL
Chart bar size: 1D
Indicator settings
TF : 1D
ROC : 70
EMA : 6
Hurst : 26
Standardization window length : 16
Scale : 1
Final Weight Cap : 1
====================================================
Preset S&P500 index
Chart bar size: 2D
Indicator settings
TF : 2D
ROC : 26
EMA : 8
Hurst : 33
Standardization window length : 16
Scale : 1
====================================================
Preset MSFT
Chart bar size: 2D
Indicator settings
TF : 2D
ROC : 16
EMA : 50
Hurst : 44
Standardization window length : 32
Scale : 1

Order Blocks, Breakers & Trend LinesSyntropy OB — Professional Order Blocks, Breakers & Trend Lines Toolkit
A clean, institutional-grade Price Action tool trusted by thousands of smart traders.
What makes Syntropy OB different:
• Dual-layer Order Block detection (two independent ZigZag sensitivities)
• Smart Breaker Blocks (OBs violated but never retested)
• Second independent Breaker Block engine for higher-timeframe confirmation
• Violated & retested OBs with strength + proximity filters (no chart clutter)
• Two fully automatic dynamic Trend Line sets with configurable channel width (ATR-based)
• Real-time extension of lines and blocks to the current bar
• Minimalist, beautiful and highly customizable colors
• Zero repainting — 100% reliable structure
Perfect for:
→ ICT / Smart Money Concepts
→ Supply & Demand
→ Classic Price Action
→ Swing & intraday trading on any market (Crypto, Forex, Stocks, Futures)
No lag. No nonsense. Just pure, clean structure.
Add to favorites — this is the last Order Block + Trend Line tool you’ll ever need.
Enjoy the edge,
Syntropy Labs

SMC Buy/Sell with SL TPthis indicator helps to make decision for trading, learn first using backtest when you want to choose follow the signal.
for more information, contact us.

Syntropy - System v4Syntropy System v4 – La Estrategia de Acumulación Profesional que Todos Están UsandoEDICIÓN LIMITADA – SOLO 10 PLAZAS DISPONIBLES EN TODO EL MUNDOPor primera (y única) vez, libero mi estrategia privada más potente:
La misma que uso personalmente y que ha cambiado por completo la forma en que acumulo en Bitcoin, Ethereum y altcoins de alto potencial.¿Qué incluye Syntropy v4?8 motores de entrada independientes (PG Solo, PG+FA, RZ1/RZ2, SFP, Liquidity Sweep, STE Bottom + reentradas inteligentes)
Piramidación hasta 20 niveles con control total de riesgo
Medias móviles dinámicas + proyecciones extendidas
Tabla en tiempo real con P&L total, capital invertido y operaciones abiertas/cerradas
Señales 100% visuales y sin repintado
Optimizada para cripto, pero funciona perfecto en forex y acciones
OFERTA EXCLUSIVA Y POR TIEMPO MUY LIMITADOPrecio normal: 499 USD (pago único de por vida + todas las futuras actualizaciones) PRECIO LANZAMIENTO SOLO PARA LOS PRIMEROS 10 COMPRADORES:
50 USD DE POR VIDA
(Sí, leíste bien: cincuenta dólares una sola vez y el indicador es tuyo para siempre)Una vez que se vendan las 10 primeras licencias, este precio desaparece para siempre y vuelve al valor real de 499 USD.Ya van 7/10 vendidas en las últimas horas…¿Quieres ser uno de los últimos 3 que se lleven Syntropy v4 a precio de lanzamiento?Envíame YA un mensaje privado con la palabra “SYNTROPY 50” y te mando el enlace de pago + acceso inmediato al script protegido.No hay prueba gratis esta vez porque a este precio es literalmente un regalo… pero sí te doy mi palabra: si en 30 días no estás 100% convencido de que es la mejor estrategia que has usado jamás, te devuelvo hasta el último centavo.Quedan muy pocas horas antes de que suba el precio para siempre.Los primeros 10 que escriban ahora se llevan el indicador de por vida por solo 50 USD.
El resto pagará 10 veces más.Tú decides si estás dentro del grupo élite o te quedas mirando desde afuera.Te espero del otro lado.Aviso importante (reglas de TradingView):
Este es un script privado de pago. No constituye asesoramiento financiero. Operar implica riesgo de pérdida de capital. Los resultados pasados no garantizan resultados futuros. Uso bajo tu propia responsabilidad.
Syntropy System v4 – The Most Powerful Accumulation Strategy Ever ReleasedWORLDWIDE LIMITED EDITION – ONLY 10 LIFETIME SEATSFor the first and last time ever, I’m opening my personal, private strategy that I use every single day to stack Bitcoin, Ethereum, Ethereum and high-conviction altcoins.What you get with Syntropy v48 independent & complementary entry engines (PG Solo, PG+FA, RZ1/RZ2, SFP, Liquidity Sweep, STE Bottom + smart reentries)
Up to 20 pyramiding levels with perfect risk scaling
Dynamic moving averages + extended visual projections
Real-time dashboard (total P&L, invested capital, open/closed trades)
100% visual, non-repainting signals
Built for crypto, but works flawlessly on forex and stocks too
INSANE LAUNCH PRICE – ONLY FOR THE FIRST 10 PEOPLENormal lifetime price: $499 (one-time payment + all future updates forever)LAUNCH PRICE – FIRST 10 BUYERS ONLY:
$50 USD LIFETIME
(Yes, you read that right: fifty dollars one time and the indicator is yours forever)Once these 10 licenses are gone, the price jumps permanently to $499 and will never come back down.7 out of 10 already sold in the last few hours…That leaves only 3 seats at this ridiculous price.Want to be one of the last 3 people on Earth to grab Syntropy v4 for $50 lifetime?Send me a private message RIGHT NOW with the words
“SYNTROPY 50”
and I’ll instantly send you the payment link + immediate access to the protected script.There is no free trial at this price (it would be insane), but I give you my personal word:
If within 30 days you’re not 100% blown away and convinced this is the best strategy you’ve ever used, I’ll refund every single penny — no questions asked.The clock is ticking. In a few hours this $50 offer disappears forever.The first 10 who message me now get lifetime access for only $50.
Everyone else will pay 10× more.Your move: be part of the elite 10 or watch from the sidelines.I’ll see you inside.TradingView Required Disclaimer
This is a paid private script. Not financial advice. Trading involves substantial risk of loss. Past performance is no guarantee of future results. Use only capital you can afford to lose. You are solely responsible for your trading decisions.


Gravestone Doji ScannerSpeaks for itself. Set it on the chart. Use Arrow Keys to move through the watchlist.

SMC BuySell with SL TPthis indicator helps to make decision for trading, learn first using backtest when you want to use follow the signal.


RT-Bitcoin Funding CandlesIntroduction
The RT-Bitcoin Funding Candles indicator and the RT-Bitcoin Spot vs Perp Funding indicator are designed to visualize Bitcoin funding conditions using estimated spot versus perpetual futures pricing. Together, they help traders see how funding has been behaving and where leveraged traders may be leaning over time. These two indicators are meant to be used together, and this write-up will cover how to utilize both tools.
The RT-Bitcoin Funding Candles indicator converts estimated funding information into custom candle colors on the chart. The RT-Bitcoin Spot vs Perp Funding indicator shows the same concept in a separate panel, similar to how many traders use RSI or other oscillators.
Both tools are intended as context layers around funding behavior, not standalone signal generators. RT-Bitcoin Funding Candles Indicator
The RT-Bitcoin Funding Candles indicator uses estimated differences between Bitcoin spot prices and perpetual futures prices to color each candle based on whether conditions are more aligned with bullish leveraged positioning or bearish spot-driven pressure.
In general terms: When perpetual futures trade at a premium to spot for extended periods, conditions are often associated with more aggressive leveraged long positioning.
When perpetual futures trade at a discount to spot, conditions can indicate stress on leveraged longs or periods where spot demand is stronger relative to perp. The indicator converts this estimated spot versus perp relationship into a color scale on the candles:
Bullish / Leveraged Funding Scale
Dark Blue → Blue → Light Blue → White
Bearish / Spot Funding Scale
Dark Red → Red → Orange → Yellow This allows traders to look at a BTC chart and quickly see whether estimated funding has been skewed toward leveraged longs or more spot-driven pressure during each candle.
Displaying Funding Candles On Top Of Price
By default, some chart layouts may draw the RT-Bitcoin Funding Candles indicator behind the main price candles. To make the funding candles fully visible: Right click on the RT-Bitcoin Funding Candles indicator on your chart.
Select Visual Order .
Choose Bring to Front . Once this is done, the funding candles will sit on top of or replace the normal bar colors, making the funding bias easier to see at a glance.
RT-Bitcoin Funding Candles Settings
The RT-Bitcoin Funding Candles indicator includes a small set of tuning options so traders can control which exchange data is used and how sensitive the color transitions are.
Key settings include:
Exchange Selection
Allows the trader to select which funding source is used for the calculation. Common options include: Binance, Deribit and Bybit. This lets traders align the indicator with the exchange they track most closely.
Smoothness Adjuster
Controls how sensitive the candle colors are to short-term changes in the spot versus perp relationship. Lower smoothing values will make colors react more quickly, but can be noisier. Higher smoothing values will make colors change less often, focusing on more persistent funding conditions. Customizing Funding Candle Colors
Traders who prefer different color palettes can customize the funding candle colors in the Style tab of the indicator settings. Open the RT-Bitcoin Funding Candles indicator settings.
Go to the Style tab.
Adjust the colors and opacities for each bullish and bearish funding color step.
This allows traders to keep the same logic while matching the visuals to their own chart themes.
RT-Bitcoin Spot vs Perp Funding Indicator
The RT-Bitcoin Spot vs Perp Funding indicator presents the same core concept in a separate, oscillator-style panel, similar to how traders might use RSI or other momentum tools.
Instead of recoloring the main candles, it plots lines that reflect how strong the estimated spot versus perp funding relationship has been over time. This can make it easier to compare current conditions to previous periods and to see when funding has moved into more extreme zones. RT-Bitcoin Spot vs Perp Funding Settings
The RT-Bitcoin Spot vs Perp Funding indicator provides a set of inputs so traders can tune how the estimated funding lines behave visually:
Premium Sensitivity
Controls how sensitive the plotted lines are to changes in the underlying estimated spot versus perp relationship. Higher sensitivity will cause the lines to move more aggressively. Lower sensitivity will smooth smaller fluctuations and focus on larger swings.
Premium Smoother
Applies additional smoothing to the raw estimated funding data. Because the underlying data can be noisy in its raw form, this setting helps reduce erratic spikes so that major shifts in funding are easier to read.
Exchange Toggles
Allows the trader to choose which exchanges are displayed in the panel. For example: Show or hide Binance funding lines.
Show or hide Deribit funding lines.
Show or hide Bybit funding lines. If multiple exchanges are enabled, multiple lines can be displayed for comparison.
Line Colors
Line colors and thickness can be adjusted in the Style tab. This makes it possible to:
Assign different colors to each exchange.
Emphasize key lines while de-emphasizing others. How Traders Commonly Use These Tools
The RT-Bitcoin Funding Candles and the RT-Bitcoin Spot vs Perp Funding indicators are typically used as part of a broader BTC workflow rather than on their own. Common usage patterns include: Context Around Extremes
Comparing current estimated funding conditions to past extremes to see when funding has become unusually one-sided relative to history.
Trend And Funding Alignment
Studying whether strong trends are being supported by consistent estimated leveraged funding, or whether price is moving against the prevailing estimated funding bias.
Multi Tool Confluence
Combining estimated funding candles or the spot versus perp panel with other tools such as RT-Main Indicator, Machine Learning Reversion Bands, or pivots to build a more complete picture of market conditions.
Exchange Comparison
Using the Spot vs Perp Funding panel to compare how different exchanges are pricing estimated funding at the same time and to see when one venue becomes an outlier. In all cases, these indicators are intended to provide an additional layer of information about how spot and perp markets have been behaving. They are not designed to be automatic entry or exit systems.
Important Note
The RT-Bitcoin Funding Candles and the RT-Bitcoin Spot vs Perp Funding indicators use chart-based calculations and publicly available pricing to approximate funding behavior. They do not access private exchange order books or actual liquidation feeds, do not reveal real trader positions, and cannot guarantee that any specific funding condition will lead to a particular price move.
These tools are intended to provide additional context around funding, positioning, and potential areas of interest. They are not standalone signal generators and should always be used together with your own analysis, testing, and risk management. Historical funding patterns or past interactions with these indicators do not guarantee future results.
🐋 Tight lines and happy trading!

RT-Bitcoin Spot vs Perp FundingIntroduction
The RT-Bitcoin Funding Candles indicator and the RT-Bitcoin Spot vs Perp Funding indicator are designed to visualize Bitcoin funding conditions using estimated spot versus perpetual futures pricing. Together, they help traders see how funding has been behaving and where leveraged traders may be leaning over time. These two indicators are meant to be used together, and this write-up will cover how to utilize both tools.
The RT-Bitcoin Funding Candles indicator converts estimated funding information into custom candle colors on the chart. The RT-Bitcoin Spot vs Perp Funding indicator shows the same concept in a separate panel, similar to how many traders use RSI or other oscillators.
Both tools are intended as context layers around funding behavior, not standalone signal generators. RT-Bitcoin Funding Candles Indicator
The RT-Bitcoin Funding Candles indicator uses estimated differences between Bitcoin spot prices and perpetual futures prices to color each candle based on whether conditions are more aligned with bullish leveraged positioning or bearish spot-driven pressure.
In general terms: When perpetual futures trade at a premium to spot for extended periods, conditions are often associated with more aggressive leveraged long positioning.
When perpetual futures trade at a discount to spot, conditions can indicate stress on leveraged longs or periods where spot demand is stronger relative to perp. The indicator converts this estimated spot versus perp relationship into a color scale on the candles:
Bullish / Leveraged Funding Scale
Dark Blue → Blue → Light Blue → White
Bearish / Spot Funding Scale
Dark Red → Red → Orange → Yellow This allows traders to look at a BTC chart and quickly see whether estimated funding has been skewed toward leveraged longs or more spot-driven pressure during each candle.
Displaying Funding Candles On Top Of Price
By default, some chart layouts may draw the RT-Bitcoin Funding Candles indicator behind the main price candles. To make the funding candles fully visible: Right click on the RT-Bitcoin Funding Candles indicator on your chart.
Select Visual Order .
Choose Bring to Front . Once this is done, the funding candles will sit on top of or replace the normal bar colors, making the funding bias easier to see at a glance.
RT-Bitcoin Funding Candles Settings
The RT-Bitcoin Funding Candles indicator includes a small set of tuning options so traders can control which exchange data is used and how sensitive the color transitions are.
Key settings include:
Exchange Selection
Allows the trader to select which funding source is used for the calculation. Common options include: Binance, Deribit and Bybit. This lets traders align the indicator with the exchange they track most closely.
Smoothness Adjuster
Controls how sensitive the candle colors are to short-term changes in the spot versus perp relationship. Lower smoothing values will make colors react more quickly, but can be noisier. Higher smoothing values will make colors change less often, focusing on more persistent funding conditions. Customizing Funding Candle Colors
Traders who prefer different color palettes can customize the funding candle colors in the Style tab of the indicator settings. Open the RT-Bitcoin Funding Candles indicator settings.
Go to the Style tab.
Adjust the colors and opacities for each bullish and bearish funding color step.
This allows traders to keep the same logic while matching the visuals to their own chart themes.
RT-Bitcoin Spot vs Perp Funding Indicator
The RT-Bitcoin Spot vs Perp Funding indicator presents the same core concept in a separate, oscillator-style panel, similar to how traders might use RSI or other momentum tools.
Instead of recoloring the main candles, it plots lines that reflect how strong the estimated spot versus perp funding relationship has been over time. This can make it easier to compare current conditions to previous periods and to see when funding has moved into more extreme zones. RT-Bitcoin Spot vs Perp Funding Settings
The RT-Bitcoin Spot vs Perp Funding indicator provides a set of inputs so traders can tune how the estimated funding lines behave visually:
Premium Sensitivity
Controls how sensitive the plotted lines are to changes in the underlying estimated spot versus perp relationship. Higher sensitivity will cause the lines to move more aggressively. Lower sensitivity will smooth smaller fluctuations and focus on larger swings.
Premium Smoother
Applies additional smoothing to the raw estimated funding data. Because the underlying data can be noisy in its raw form, this setting helps reduce erratic spikes so that major shifts in funding are easier to read.
Exchange Toggles
Allows the trader to choose which exchanges are displayed in the panel. For example: Show or hide Binance funding lines.
Show or hide Deribit funding lines.
Show or hide Bybit funding lines. If multiple exchanges are enabled, multiple lines can be displayed for comparison.
Line Colors
Line colors and thickness can be adjusted in the Style tab. This makes it possible to:
Assign different colors to each exchange.
Emphasize key lines while de-emphasizing others. How Traders Commonly Use These Tools
The RT-Bitcoin Funding Candles and the RT-Bitcoin Spot vs Perp Funding indicators are typically used as part of a broader BTC workflow rather than on their own. Common usage patterns include: Context Around Extremes
Comparing current estimated funding conditions to past extremes to see when funding has become unusually one-sided relative to history.
Trend And Funding Alignment
Studying whether strong trends are being supported by consistent estimated leveraged funding, or whether price is moving against the prevailing estimated funding bias.
Multi Tool Confluence
Combining estimated funding candles or the spot versus perp panel with other tools such as RT-Main Indicator, Machine Learning Reversion Bands, or pivots to build a more complete picture of market conditions.
Exchange Comparison
Using the Spot vs Perp Funding panel to compare how different exchanges are pricing estimated funding at the same time and to see when one venue becomes an outlier. In all cases, these indicators are intended to provide an additional layer of information about how spot and perp markets have been behaving. They are not designed to be automatic entry or exit systems.
Important Note
The RT-Bitcoin Funding Candles and the RT-Bitcoin Spot vs Perp Funding indicators use chart-based calculations and publicly available pricing to approximate funding behavior. They do not access private exchange order books or actual liquidation feeds, do not reveal real trader positions, and cannot guarantee that any specific funding condition will lead to a particular price move.
These tools are intended to provide additional context around funding, positioning, and potential areas of interest. They are not standalone signal generators and should always be used together with your own analysis, testing, and risk management. Historical funding patterns or past interactions with these indicators do not guarantee future results.
🐋 Tight lines and happy trading!

6 Custom HTF Candle Overlays (manny_mailbox2)This indicator displays up to 6 custom Higher Time Frame (HTF) candles overlaid on your chart, each representing a different time session that you define.
Core Functionality
Session-Based HTF Candles
Instead of using fixed timeframes (like 15min, 1H, 4H), this lets you create custom "candles" based on specific time ranges. For example:
HTF 1: 00:00-15:00 (default - basically a day session)
HTF 2: 07:00-11:00 (morning session)
HTF 3: 11:00-15:00 (afternoon session)
And so on...
What Each HTF Candle Shows
Each session candle displays the complete OHLC data for that time period:
Body box: Shows open and close (colored based on bull/bear)
Upper wick: High to close/open (whichever is higher)
Lower wick/tail: Low to close/open (whichever is lower)
Optional opening price line: Horizontal line at the session open
Additional Features
Body Midpoint: Shows the 50% level of the candle body
Wick Midpoints: Shows the 50% level of upper/lower wicks (only displays if the wick is "significant" - at least 1/6 of total candle range)
Extend option: Can extend the wick midpoint lines forward by X bars
Fully customizable colors: Separate colors for bull/bear bodies, borders, wicks, and midpoints for each HTF
Why Use This?
This is perfect for traders who want to:
Track specific market sessions (London, NY, Asia, etc.)
See consolidation periods or accumulation zones as single candles
Identify session highs/lows and key levels
Combine with your CISD indicator to see how price interacts with session structure
The 250-day lookback keeps your chart clean while giving you substantial history to analyze.

Auto Channel DetectorChannel Detector — Indicator Description:
The Channel Detector is a powerful TradingView indicator designed to automatically identify market channels and display them directly on the chart. Using structural swing points and trend-based logic, the tool recognizes parallel price movement and draws the upper and lower boundaries of each channel with precision. A midpoint line is plotted through the center of the channel to help visualize equilibrium and potential reaction zones.
This indicator highlights trending and consolidating behavior by mapping the most relevant channels as price develops. Whether the market is rising, falling, or ranging, the Channel Detector provides a clear visual structure that traders can use to interpret price action, anticipate breakouts, and refine trade entries.
Fully customizable, it allows users to adjust line styles, colors, and visibility options to match any trading style or chart layout. The result is a clean and intuitive tool that brings structure, context, and clarity to market movement.

Market Regime Flip (Dunk)This indicator is a trend regime flip tool built on top of MACD. Instead of reacting to every little wiggle, it waits for several bars in a row where the MACD stays either above or below zero (by default, 3 consecutive bars). When the MACD has been above zero for 3 bars, it declares a bull regime and marks that bar on the price chart with a green “BULL” triangle above the candle. When the MACD has been below zero for 3 bars, it declares a bear regime and marks that bar with a red “BEAR” triangle below the candle. It also lightly colors the chart background green in bull regimes and red in bear regimes, so you can see at a glance which side of the market you’re in.
In other words, it turns the MACD’s usual “above/below zero” behavior into a clean, slower-changing on/off regime switch. Instead of giving you constant signals, it focuses on the moments where momentum truly shifts and sticks around for a few bars, helping you avoid getting faked out by single-bar noise. The alerts are wired to those flip moments, so you can get notified when the market transitions from bearish to bullish (or vice versa) according to this MACD-based regime logic.


Equal Highs/Lows Multi-Pivot [Julio]Equal Highs/Lows Multi-Pivot
Description
A sophisticated multi-timeframe pivot analysis tool that detects and highlights equal highs and equal lows across four different pivot lengths simultaneously. This indicator identifies price levels where the market creates identical extremes, a powerful signal of institutional support/resistance and potential reversal or breakout zones.
How It Works
Four Independent Pivot Streams
Pivot 1 (Intraday - 2 bars): Ultra-fast level detection for scalpers
Pivot 2 (Session - 4 bars): Short-term swing levels
Pivot 3 (Daily - 6 bars): Medium-term structural levels
Pivot 4 (Weekly - 9 bars): Long-term institutional levels
Equal High (EQH) Detection
Compares consecutive swing highs and draws a line when two highs are nearly identical within a defined threshold. The indicator uses ATR-based confluence to determine "equality," filtering out noise while catching true market structure.
Equal Low (EQL) Detection
Same logic applied to swing lows, identifying support zones where price repeatedly fails to break below previous lows.
Key Features
Four Simultaneous Timeframes: Analyze intraday, session, daily, and weekly structures all on one chart
ATR-Based Confluence Threshold: Automatically adjusts sensitivity based on current volatility (no fake signals)
Color-Coded Levels: Each pivot length has distinct colors for instant visual identification
Highs: Red, Orange, Yellow, Fuchsia
Lows: Green, Blue, Aqua, Purple
Confirmation Mode: Optional setting to wait for full pivot confirmation before marking levels
Customizable Alert Zones: Toggle individual pivot lengths on/off to reduce clutter
Smart Label Positioning: Labels auto-center between the two equal pivots for clarity
Ideal For
Swing traders tracking support/resistance across multiple timeframes
Scalpers identifying micro-structure for quick entries and exits
Market structure analysts studying institutional price action patterns
Multi-timeframe traders needing confluence from intraday to weekly levels
Anyone trading 1-minute to 4-hour charts
Trading Applications
Identify strong support/resistance zones: Equal levels = confirmed institutional levels
Confirm trend reversals: Multiple equal lows = strong accumulation zone; multiple equal highs = distribution
Plan entries with precision: Enter near equal levels for higher probability setups
Detect liquidity concentration: Where price repeatedly tests the same level
Multi-timeframe confluence: Look for equal levels across multiple pivot lengths for ultra-strong zones
How to Use
Identify the equal levels: Color-coded lines instantly show where price creates matching extremes
Check for confluence: Strong setups occur where multiple pivot lengths align
Wait for price action: Watch for breakouts through equal levels or reversals at these zones
Enter with structure: Use equal levels as entry/exit triggers combined with your trading methodology
Manage with confidence: These levels mark institutional decision points
Customization Options
Adjust pivot lengths to match your preferred timeframe structure
Set ATR threshold sensitivity (lower = stricter equality, higher = more signals)
Toggle confirmation mode for additional filter
Enable/disable individual pivot streams to reduce visual clutter
Customize colors to match your chart theme
Default Settings Optimized For
NASDAQ futures and liquid forex pairs
Intraday and swing trading (1-minute to 4-hour charts)
Smart Money / ICT trading methodologies
Volatility-adjusted confluence detection

Asia & London Session Boxes (NY Time) + 4H SwingsAsia & London Session Boxes + 4H Swings
Description
A multi-timeframe session analysis tool designed for forex and futures traders operating on NY time. This indicator visualizes major trading sessions with automatic high/low range boxes while simultaneously tracking 4-hour swing levels, giving you a complete picture of institutional trading activity and key price levels.
How It Works
Session Boxes (NY Time Zone)
Asia Session (20:00 – 00:00 NY): Blue-shaded box marking the complete range from open to close
London Session (02:00 – 06:00 NY): Yellow-shaded box capturing the high-volatility London open
Each session box automatically records the highest high and lowest low during that timeframe, providing instant reference for session extremes and potential supply/demand zones.
4-Hour Swing Levels
Detects swing highs and lows on a 30-minute timeframe for ultra-responsive level identification
Red lines: Swing highs (resistance levels)
Green lines: Swing lows (support levels)
Lines extend to the right for continuous monitoring
Auto-removes touched levels: When price breaches a swing, it automatically deletes that level to keep your chart clean and focused on active levels
Key Features
Session-Based Trading Analysis: Identify which session created important price levels and ranges
Multi-Timeframe Architecture: Analyzes 30-minute swings while tracking 4-hour patterns on your current chart
Smart Level Cleanup: Touched swings automatically remove themselves, eliminating clutter
NY Time Conversion: All times automatically adjust to your NY timezone for consistency
Institutional Perspective: View exactly where institutions are trading during major session hours
Zero Lag Detection: Real-time identification of swing extremes
Ideal For
Forex traders (especially EUR/USD, GBP/USD) targeting session breakouts
Scalpers and swing traders needing precise support/resistance levels
Market structure traders analyzing institutional price action
Session traders looking to trade Asia/London opens
1-minute to 4-hour timeframe charts
Trading Applications
Trade Asia session breakouts into London
Identify liquidity zones from previous sessions
Detect swing extremes for entry/exit planning
Confirm trend direction using multi-session structure
Find support/resistance on intraday pullbacks
Default Settings Optimized For
NASDAQ futures and forex pairs
Scalping and short-term swing trading
NY timezone trading (automatically converts UTC-4)
30-minute swing detection for precise level identification

AB=CD Fibonacci Strategy (One Trade at a Time)
AB=CD Fibonacci Strategy - Harmonic Pattern Trading Bot
Description
An automated trading strategy that identifies and trades the classic AB=CD harmonic pattern, one of the most reliable geometric price formations in technical analysis. This strategy detects perfectly proportioned Fibonacci retracement setups and executes trades with precise risk-reward management.
How It Works
The indicator scans for the AB=CD pattern structure:
Leg AB: Initial swing from pivot point A to pivot point B
Leg BC: Retracement to point C (customizable Fibonacci levels)
Leg CD: Mirror projection equal to the AB leg length
When price touches point D, the strategy automatically enters a position with predefined take-profit and stop-loss levels based on your risk-reward ratio.
Key Features
One Trade at a Time: Ensures disciplined position management by allowing only one active trade per pattern
Customizable Fibonacci Retracement: Set your preferred retracement range for point C (default 50% - 78.6%)
Risk-Reward Control: Adjust stop-loss and take-profit multiples to match your trading plan
Visual Pattern Display: Clear labeling of A, B, C, D points with pattern lines for easy identification
Both Directions: Identifies bullish and bearish AB=CD patterns automatically
Ideal For
Swing traders on higher timeframes (4H, Daily, Weekly)
Harmonic pattern traders seeking automation
Traders wanting precise entry and exit rules based on Fibonacci geometry
Those looking to reduce emotional trading and increase consistency
Default Settings Optimized For
NASDAQ futures and currency pairs
Medium timeframe analysis
Conservative risk management (10% position size per trade)
