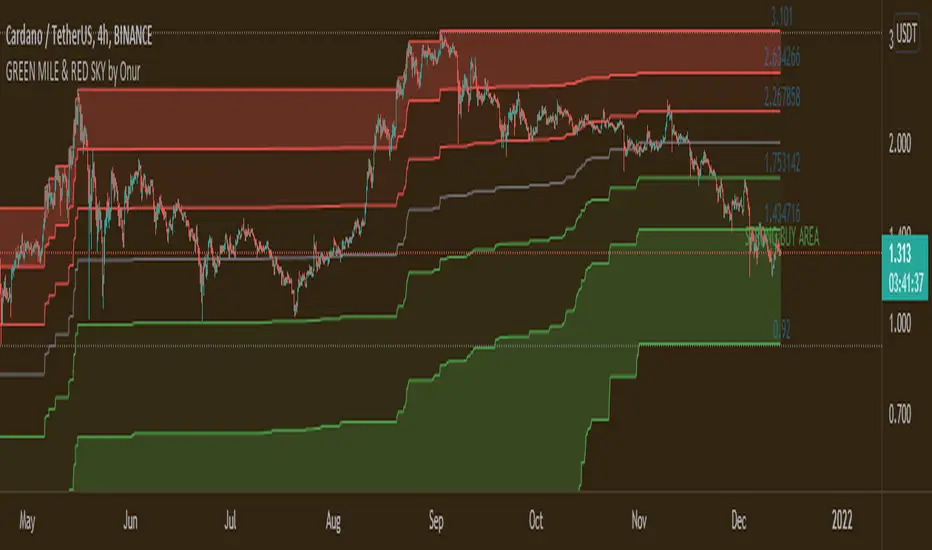
GREEN MILE & RED SKY by OnurThis indicator is the upgrated version of "GREEN MILE by Onur". Indicator shows fibonacci buying + selling levels due to the past 3500 (adjustable and 1500 by default) candles. Prices in the dark green area is a strong buying signal. Prices in the dark red areas is strong selling signal
Decreasing period value makes indicator effective from long term to short term.
Works harmoniously with MACD & RSI indicators.
Buysellsignal
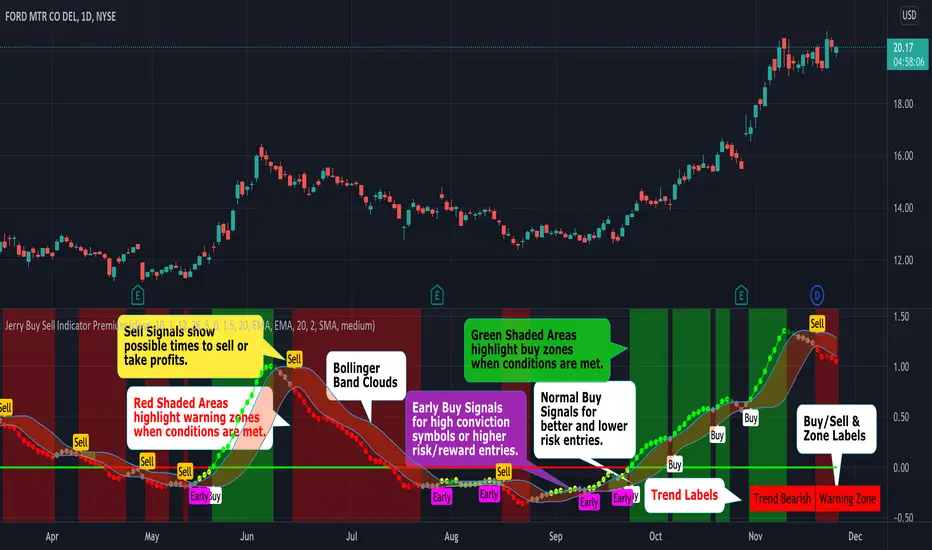
Jerry Buy Sell IndicatorThis indicator has unique conditions in the script that create the following:
1. Buy and Sell zones
2. Early Buy, Buy and Sell signals that are determined by conditions including relative position to the zero line.
3. Defines 6 different short term trends
4. Trend Labels to show the current short term trend (located in the lower right corner).
5. Buy, Sell, Buy Zone & Warning Zone Labels
6. 14 user controlled inputs allow the user to customize the settings.
7. Unique functionality that allows you to create trade alerts based on conditions being met with criteria scans built into the indicator.
# 7 is a cool unique feature of our indicator. For example you can easily create a TRADE ALERT for a symbol based on a Buy Signal being met in any time frame. This is possible because we have built into the script the ability to select multiple conditions including BUY ALERT, EARLY BUY ALERT AND SELL ALERT. You can also use the alerts to scan your stocks individually for buy zones and warning zones or for crossing above or below the clouds. TradingView alerts can notify you via pop-up, email, sound notification, email to SMS & sound notifications.
Buy Sell Indicator Features
----- Trends
- Red Dots (Red Cloud) = Warning zone. Generally do not buy or consider selling.
- Dark Red Dots = Warning BUT Improving. Things are getting better.
- Grey Dots = Neutral. No clear short term trend.
- Yellow Dots = Early. Great for high conviction stocks but early for the main buy signal.
- Dark Green Dots = In the buy zone but losing strength.
- Green Dots (Green Cloud) = Trend is bullish & stock is in the buy zone.
- Trend Line = Shows the prevailing direction of price and if the momentum is beamish, bullish or neutral.
----- Buy & Sell Signals
- Early Buy Bubble= The first day the Early Buy signal is triggered. Early Buy Signals occur below the zero line and are higher risk/reward. This is a unique feature of this indicator.
- Buy Bubble = Indicator Buy Signal Triggered. Buy Signals occur above the zero line.
- Sell Bubble = Indicator Sell Signal Triggered.
----- Ways To Use The Indicator
1. Buy/Sell during with the main buy and sell Alerts in the Buy (green shaded) and Warning (red shaded) zones.
2. In The Red You’re Dead. Most buy signals happen outside of the red warning zone. There are exceptions like reversals and momentum squeezes.
3. Buy Sell Indicator can be used by itself or with other indicators (Momentum Dream works well)
4. Use Red and Green Clouds/Shading to assist with position direction. In the buy zone look to go long. In the red zone generally do not add to your position or consider selling.
5. Use Red Clouds to tighten stops or close positions.
6. Customize the indicators to vary the results by selecting Wilders, SMA, EMA, WMA, and HullMA moving averages.
7. The early buy signal/bubble appears on the chart the first day the early buy signal is triggered and can be used for entry into high conviction stocks or if you want to take a higher risk/reward trade.
8. The standard buy signal is shown when conditions have been met to indicate a better buy entry point with less risk.
Disclaimer: The information contained in our scripts/indicators/ideas does not constitute financial advice or a solicitation to buy or sell any securities of any type. We will not accept liability for any loss or damage, including without limitation any loss of profit, which may arise directly or indirectly from the use of or reliance on such information. All investments involve risk, and the past performance of a security, industry, sector, market, financial product, trading strategy, or individual’s trading does not guarantee future results or returns. Investors are fully responsible for any investment decisions they make. Such decisions should be based solely on an evaluation of their financial circumstances, investment objectives, risk tolerance, and liquidity needs.
Please Use the link below for more information.
Williams Fractals StrategyThis indicator made with using Williams Fractals, 20 50 100 Moving Averages and Relative Strength Index. You can easily find entry points by using Long (L), Short (S) signals.
Note : Settings are optimized for BTC:USDT Perpetual 15min TF. For use different pairs or TFs you may need to change settings.

OnePunch Algo KITEIntroducing One of OnePunch ALGO Flagship plugin. In this plugin it comes with a in-built risk management system plus it allows users stop loss input per trade. This can be used with Cryptocurrency and Stocks equally.
#################################
########## User Guide ###########
################################
OnePunch ALGO KITE should be used with 30min or upper time limits, this is built for long term trading strategies. Make sure once you pick a crypto or stock to trade, check its backtest data: which can be found at Strategy Tester. A good strategy should always out perform the Buy & Hold for a given timeframe.
Best Bar Time: 45m
Other Options
___________________________________________________________
Short Term/Day Trading Setup
For Short Term or Day Trade: 5min, 15min & 30min candlesticks
Mid Term Trading Setup
For Mid-term traders: 45m, 1hr, 2hr, and 3hr setup works really well.
For Long Term Trading Setup
For long term traders: 4hr, 1D, 1Week and 1Month Setup works well.
* Best timeframe should beat buy and hold for a given timeline.
#################################
####### How Strategy Work ########
################################
Strategy use multiple signals and technical data. Including and not limited to Simple Moving Averages, Volume , & Trends. In this chart, we picked Polkadot (DOTUSD) crypto coin as an example with an initial capital of $1k. We have also added a slippage of 1 just to be on the safe side and a commission rate of 0.01% (Commission rates depends of your broker).
#################################
######## Built with Inputs #########
################################
Date Pick: User can backtest the plugin with exact date you want from to till. For an example, you can check date from 01 / 01 /2020 (Default setting date) till day, and compare apple to apple results with other stocks. This is mostly used to check if another stock/crypto do better than the other compared to a given timeframe.
Risk Management per Trade: This also allows users to put their own risk management loss percentage. In default it is set to 100%. This allows user to see in the long run, if this provide better results with or without a stop loss.
Commission Rates: User can update commission rates according to their broker's fees
Slippage: To be more conservative about the entry and exit of a trade, user can input any slippage amount
#################################
#### How to Detect BUY Signals #####
################################
When a teal color BUY signal is given, it is a BUY. This signal basically happen when a stock land in a high volatility zone. We use in-build systems such as MA , Support and Resistance and Trends to come up with the Buy Signal. Algorithm make a market order when the criteria's are met and algorithm exit if this turns out to be a bluff bullish signal.
#################################
#### How to Detect SELL Signals #####
################################
When a maroon color SELL signal is given, it is a SELL happen when a momentum changed in a bearish downtrend. Sell happen when a momentum changed in a bearish downtrend. We use moving averages and trend analysis to identify downtrends. Algorithm make a market order when the criteria's are met. There is a in-built risk management that make an exit order when a bullish alert turns out to be a bluff.
#################################
#### Bullish and Bearish Signals #####
################################
When a silver color Bearish signal is given, it is a BEARISH trend alert. It's up to the user to decide what to do when this alert is given. (Note: Backtest data only shows Buy and Sell Signal market orders results, it does not account bearish alerts), a Bearish signal given when the stock/crypto is overbought in multiple technical indicators.
When a sea blue Bullish trend signaled. (Mind this sea blue color signal will not be calculated in the backtest, it is up to the users to decide what to do with this bullish signal) - This signal happen when a stock is oversold in multiple technical indicators.
DISCLAIMER: Stocks and options trading involves substantial RISK of LOSS and is NOT suitable for every investor. The valuation of stocks and options may fluctuate, and, as a result, clients may lose more than their original investment. If the market moves against you, you may sustain a total loss greater than the amount you deposited into your account. You are responsible for all the risks and financial resources you use and for the chosen trading system. You should not engage in trading unless you fully understand the nature of the transactions you are entering into and the extent of your exposure to loss. If you do not fully understand these risks, you must seek independent advice from your financial advisor.
All trading strategies are used at your own risk. And OnePunch ALGO Developer does NOT take any responsibility for your losses using any of the advice or suggestions or strategies are shown/said in any of OnePunch ALGO publications.

M.Right_ OBV / Volume Smoothed RSI & 3 RSI EMAsFirst, I'd like to thank all those coders who've inspired me to learn and code my own indicator. This is the result of tireless hours of work learning to code and tweaking until everything fits exactly what I was looking for. After using it for a while and seeing the benefits personally, I figured now might be a good time to share with everyone while we are in such great market volatility , maybe I can save you some losses.
Basically, my indicator is meant to use RSI, Volume, and Volatility to show where oversold and overbought levels are, but also good times to buy and alerts.
I've tried to make my indicators as customizable as possible with all the bells and whistles you'd expect, but to have Proprietary calculations under the hood that you probably won't find anywhere else.
This indicator is a great pair with my Top and Bottom Finder.
Features:
Works on all timeframes.
Alerts.
Background highlights.
Buy/Sell signals and arrows (with the option to remove them).
Let me know if you have any questions, and enjoy.
Cheers,
Mike
GoldenCO Aie3Use of GCOv3 strategy for market analysis
This gco3 strategy uses exponential moving average analysis which is 5emas to show the movement of stock prices in the market. It is also to track the impending changes to the market price. the use of EMA is more sensitive to trend changes and it is one way to see the trend of price movements and as a guide to the trader.
The parameters used are EMA5/EMA20/EMA50/EMA100/EMA200.
The above parameters indicate a price condition that includes 4 phases of the price trend, namely the accumulation, uptrend, distribution, and ddowntrend phases.
we hope that, by recognizing and knowing the trend of this price movement it can help traders in trading activities well and can reduce risk. May it benefit the trader.
DISCLAIMER ; This is not Buy/Sell call, Just analysis idea for education. Trade At Your Own Risk
Trend Fusion By CryptoScriptsWelcome to Trend Fusion! This isn't your typical moving average indicator. It's a multi-timeframe indicator that consists of 3 different moving averages AND let's you choose between EMA, SMA, WMA, VWMA, HMA, and RMA. For example, you can have the 5min 200 EMA, 15min 200 EMA, and 1 hour 200 EMA all on the SAME chart without having to switch timeframes! This helps to create an edge over the competition so you don't have to have multiple charts open and you can see everything on one screen. You can also modify each moving average to the timeframe and value of your choice.
Signals
The Trend Fusion fires a buy signal (green triangle) whenever Moving Average 1 crosses above Moving Average 2 and 3. This is great for catching a bullish trend early, especially when combined with other indicators.
The Trend Fusion fires a sell signal (red triangle) whenever Moving Average 1 crosses below Moving Average 2 and 3. This is great for catching a bearish trend early, especially when combined with other indicators.
You can also make Moving Average 2 and 3 the same value if you just want to create an alert for one moving average crossing over another. (i.e MA 1 is the 50EMA and MA 2 and 3 both have a value of 200 so you're just looking for the 50EMA to cross over the 200EMA).
This indicator is great for catching big trends and catching them early (as seen by the picture), and fires multiple buy signals or sell signals in case you didn't catch the first one so you still have time to get in the trade.
Alerts
You can also set alerts for the buy and sell signals! Just click the clock icon in the top middle of the chart and click Trend Fusion in the drop-down menu. Make sure to select "Once per bar close" so you know the signal is confirmed.
Each timeframe acts differently so make sure you experiment/backtest with each one and tailor your moving average values accordingly.
Disclaimer: Past results are not indicative of future returns.
PM me to obtain access and please let me know if you have any questions! :)

B4Signals Ichimoku PremiumB4Signals Ichimoku is an advanced version of the standard ichimoku indicator. It removed the complexity of understanding all parts of the ichimoku indicator and provides a consensus based status of the overall ichimoku system.
B4Signals Ichimoku indicator is a very powerful price forecasting tool. Trade entry points identified with B4Signals Ichimoku are highly accurate on their own but they become very powerful when integrated into the rest of the B4 suite of indicators. Each entry is confirmed and validated with the the B4Signals Trading System before opening a position.
B4Signals Brackets features:
Automatic interpretation of the current price trend
Automatic interpretation of the lagging line
Automatic interpretation of the crosses
Automatic interpretation of the cloud forecast
Resulting trend direction
Trade entry and exit points
Automatic calculation of risk for entries
Setup alerts and get notified:
Trade entries and exits are triggered
Disclaimer
Copyright by B4Signals.
The information contained in our scripts/indicators/ideas does not constitute financial advice or a solicitation to buy or sell any securities of any type. We will not accept liability for any loss or damage, including without limitation any loss of profit, which may arise directly or indirectly from the use of or reliance on such information.
All investments involve risk, and the past performance of a security, industry, sector, market, financial product, trading strategy, or individual’s trading does not guarantee future results or returns. Investors are fully responsible for any investment decisions they make. Such decisions should be based solely on an evaluation of their financial circumstances, investment objectives, risk tolerance, and liquidity needs.

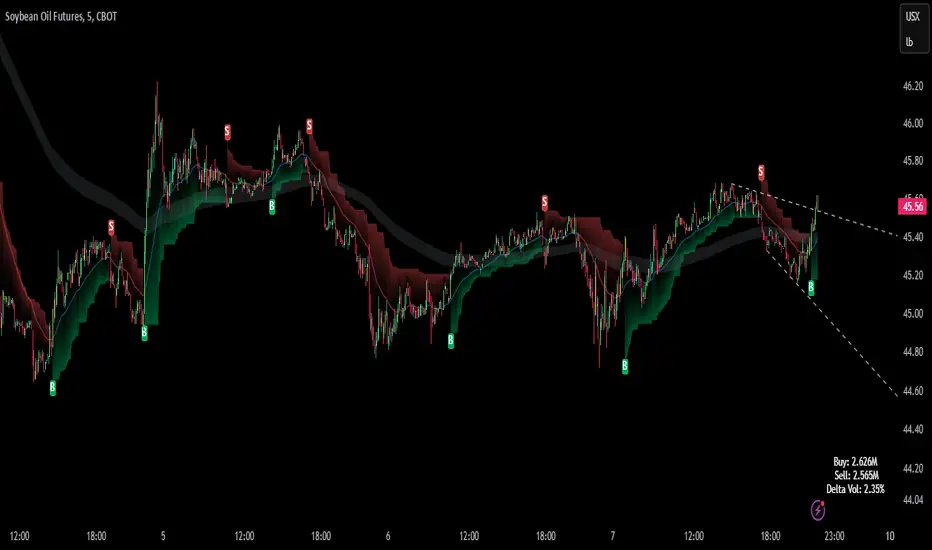
B4Signals Brackets PremiumB4Signals Brackets is a geometrical indicator that quantifies the price action in a pivot zone. It uses historical pricing to identify time and price alignments in order to forecast price levels. Price levels identified by B4Signals Brackets are significant support/resistance points. A decisive price break of these points results in very profitable trade opportunities.
B4Signals Brackets indicator is a very powerful price forecasting tool. Trade entry points identified with B4Signals Brackets are highly accurate on their own but they become very powerful when integrated into the rest of the B4 suite of indicators. Each entry is confirmed and validated with the the B4Signals Trading System before opening a position.
B4Signals Brackets features:
Dynamically calculated price bands during the significant times in the market
Price breakouts and forecast of price targets
Significant support and resistance price points
Traders can enable and customize the following:
Select the dynamic update time blocks and update times (changing these settings are not recommended)
Customize the visibility of the background shading of brackets
Setup alerts and get notified:
Trade entries are triggered
Disclaimer
Copyright by B4Signals.
The information contained in our scripts/indicators/ideas does not constitute financial advice or a solicitation to buy or sell any securities of any type. We will not accept liability for any loss or damage, including without limitation any loss of profit, which may arise directly or indirectly from the use of or reliance on such information.
All investments involve risk, and the past performance of a security, industry, sector, market, financial product, trading strategy, or individual’s trading does not guarantee future results or returns. Investors are fully responsible for any investment decisions they make. Such decisions should be based solely on an evaluation of their financial circumstances, investment objectives, risk tolerance, and liquidity needs.

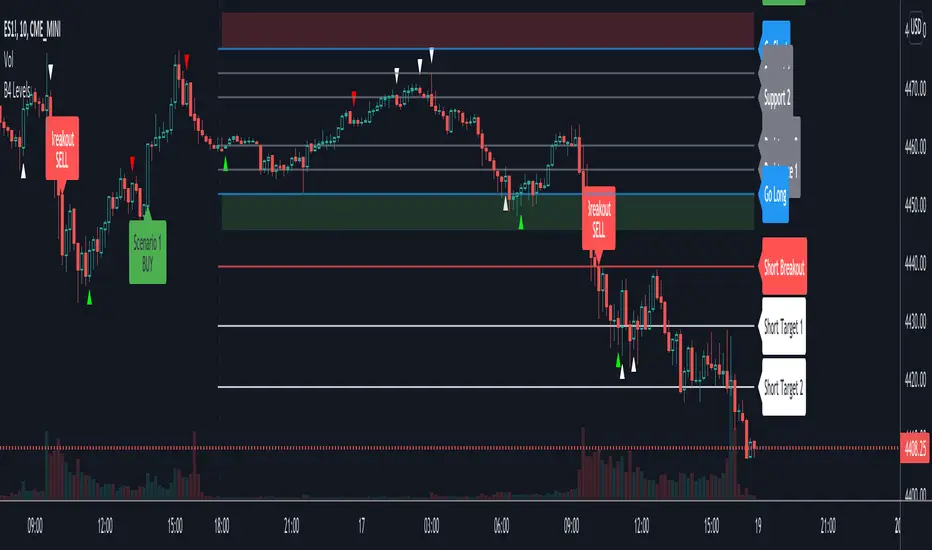
B4Signals Levels PremiumB4Signals Levels is a versatile indicator that allows traders to recognize key price levels, entry and exit points, and appropriate risk management.
B4Signals Levels indicator identifies trade entries for pivot points and breakouts. Trade entry points identified with B4Signals Levels are highly accurate on their own but they become very powerful when integrated into the rest of the B4 suite of indicators. Each entry is confirmed and validated with the the B4Signals Trading System before opening a position.
B4Signals Levels features:
10 clearly identified pivot points that provide traders with key support, resistance, trade entry and exit levels
Trade entry signals with profit target and stop loss levels
Breakout signals with profit target and stop loss levels
Trend reversal arrows for possible peak points of an existing trend
Trend exhaustion arrows for profit taking zones
Traders can enable and customize the following:
Select the aggregation to fit the trader's style of trading (intraday, swing trades, options, etc.)
Customize the visibility of the historical levels for backtesting
Customize the visibility of different types of trade entries
Setup alerts and get notified:
Trade entries are triggered
Price breakouts are triggered
Trend reversal has been identified
Trend exhaustion has been identified
Disclaimer
Copyright by B4Signals.
The information contained in our scripts/indicators/ideas does not constitute financial advice or a solicitation to buy or sell any securities of any type. We will not accept liability for any loss or damage, including without limitation any loss of profit, which may arise directly or indirectly from the use of or reliance on such information.
All investments involve risk, and the past performance of a security, industry, sector, market, financial product, trading strategy, or individual’s trading does not guarantee future results or returns. Investors are fully responsible for any investment decisions they make. Such decisions should be based solely on an evaluation of their financial circumstances, investment objectives, risk tolerance, and liquidity needs.
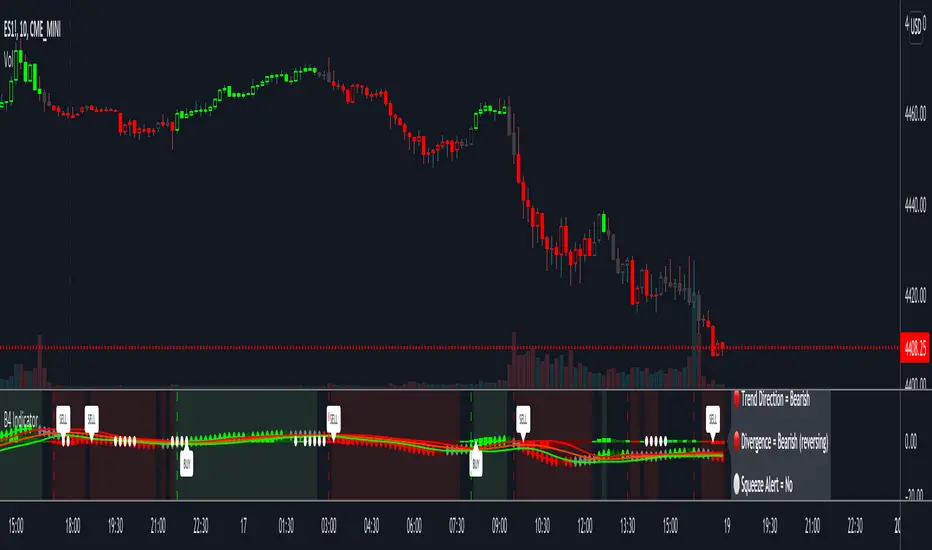
B4Signals IndicatorB4Signals Indicator is part of a suite of technical indicators that will help you target high value trading opportunities no matter what you trade. A successful trader understands the need to take advantage of opportunity when there is a trend that exhibits good momentum. Now, with B4Signals Indicator you can capture momentum while managing risks with our multi-featured indicator that is designed to identify breakouts or breakdowns in every market condition while providing clear trade entries and exists upon a single glance.
B4Signals Indicator is simple and easy to learn, yet robust enough to be reliable across all types of stocks, in all types of market environments. It provides high probability of reliable signals. It harnesses the power of confluence of indicators to confirm buy/sell conditions.
Virtually every day, B4Signals Indicator proves itself in the real world trading arena-rendering profits over a variety of markets and time frames. We combined highly successful trend following strategies to identify breakout or breakdown points as entry signals. B4Signals Indicator is an extremely accurate tool, and a vital and part of our B4 Trading System, a suite of technical indicators that provides amazingly accurate buy and sell entries, protective stops, trailing stops and profit targets. With every trade you will know the precise entry level and whether you are going long or short, how much you need to risk on the trade and when to exit.
Either As A Stand Alone Indicator or As a Part of Our Suite:
B4Signals Indicator can be used standalone or as a part of your current trading strategy.
Let the B4 Trading System show you when to get in a trade, how long to let your profits run, and when to exit. Virtually every possible market contingency is covered by the system rules so you always know exactly what to do. At the time of every entry, you always have a solid protective stop and precise target so you know exactly where to get in and where to get out and what to do in case things don’t go your way. This eliminates many stressful decisions associated with trading errors and unnecessary losses. B4Signals Indicator was designed for both new and seasoned traders.
B4Signals Indicator Features:
Trading Bands - These bands by themselves can be highly effective tools, but the potential for trading success is greatly increased when combined with B4 System
Confluence Conformation Cloud - A special combination of top performing, proven technical indicators that produces an incredibly easy and reliable way to identify the start and end of market trends
Bull Bear Lines - These fire either red or green to alert you to get ready to enter your position
Buy & Sell Signal Entries - When these signals are generated, they alert us to a market ready to possibly explode to new highs or lows
Trend Line - Identifies the prevailing direction of price. It shows the direction and speed of price, clearly and accurately identifying when bullish or bearish momentum is high
Squeeze Dots - Alerts you when markets may break out of a consolidation range
Squeeze Cloud - Changes colors in the bands when a squeeze is present getting you ready for an explosion in price action
Labels - Market Forecast, Trend, Divergence and Squeeze Alert. These labels are color coded to held you identify market turning points
Bar Coloring - Allows several options to color the candles according o strategies within the indicator
Our indicator is completely customizable and clearly identifies buy and short signals based on a combination of 12 unique metrics.
B4Signals Indicator Works In Any Market & Allows Users To:
Stay in positions longer, and catch entries/exits & reversals with crystal clear signals for precision
Designed for both trend following and contrarian traders
Timely filter out noise from the price in order to have clear pictures of the underlying market trend
Catch trends when they change bullish/bearish colors from green to red & vice versa
Improves chances of getting out of a winning position in profit
Disclaimer
Copyright by B4Signals.
The information contained in our scripts/indicators/ideas does not constitute financial advice or a solicitation to buy or sell any securities of any type. We will not accept liability for any loss or damage, including without limitation any loss of profit, which may arise directly or indirectly from the use of or reliance on such information.
All investments involve risk, and the past performance of a security, industry, sector, market, financial product, trading strategy, or individual’s trading does not guarantee future results or returns. Investors are fully responsible for any investment decisions they make. Such decisions should be based solely on an evaluation of their financial circumstances, investment objectives, risk tolerance, and liquidity needs.
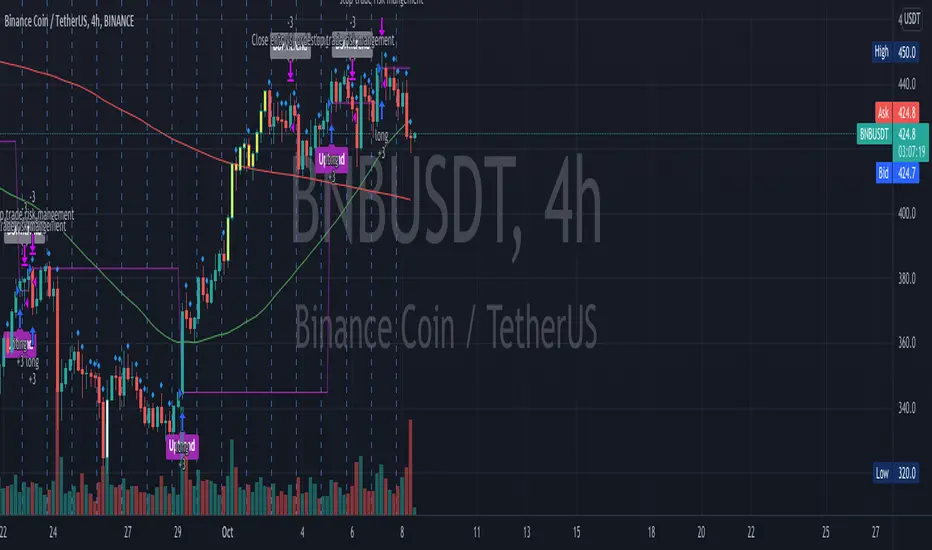
CPR by PIVOT EDGEIntroduction to the Indicator "CPR by PIVOT EDGE - with AUTO BUY SELL Triggers"
The Foundation layout for this indicator is based on PIVOT's strategy which are nothing but the most important levels that the price has respected in the past. The values for the pivots are derived from the key attributes of the price in any timeframe such as the previous OPEN, HIGH, LOW and CLOSE. These define the mood of the price and where it intends to move in relation to the previous range formed. Earlier HIGH - LOW i.e the RANGE indicates the possible movement that a stock can make in the current session and as per the calculated pivots we can possible find out the tentative supports and resistances. In addition to this indicator, It is advisable to use the price action theory which helps in taking a right decision for entries.
This indicator by itself is complete in nature, i.e it guides the user for possible entry levels and the projected targets that we can achieve and also the likely stop loss limit in case the price reverses. So beforehand even before entering into a trade position, the user can ascertain what can be his loss or max profit and then he can chose an optimum position size for favorable results. This Indicator also comes with labels for all PIVOTS like CPR , TC , BC , S1,R1, PDH , PDL etc.. which makes it easier to understand levels and trade
The beauty of this Indicator lies in the fact that it can be used for all types of trading styles like Scalping, Intra day, Swing or Positional and Investments also. It works on all timeframes and across all market segments like EQUITY, COMMODITIES , FUTURES , FOREX etc. This indicator can be used for any exchange and any time zone also without any changes or adjustments needed.
Now let us understand the features of this Indicator in detail.
TIMEFRAME - It has options to choose between Day, week and month as timeframe. By default it is set to Day timeframe - Though this Indicator works on all timeframes, it is advisable to work on ,15,30 mins Intraday and 1H,2H, 4H for Swing and D,W candles for Positional trades.
DISPLAY CPR BAND - This displays the CPR range that consists of Pivot , TC and BC . This Band or Range is the core of this indicator and this gives a detailed information about the tentative range and momentum of the market for the present period
as well a prediction for next session and also can tell you the history of its prior period. This level acts as both support and resistance based on the direction of the trend. The unique feature built in this indicator is that
the CPR Band changes its color based on whether it is ascending or descending CPR or in other works if it is higher value relation or lower value relation compared to previous session. Green for Higher and red for lower relation.
DISPLAY SUPPORT RESISTANCE - This indicates the important support and resistance levels for the day which is derived from the price details of prior period that is based on HIGH / LOW / CLOSE of prior period.
DISPLAY PREVIOUS HIGH / LOW / CLOSE - I have included Daily / Weekly. It is important to know the earlier highs / lows and close since price respects it very much just like support and resistance .
DISPLAY TOMORROW CPR - This displays the CPR band and support / resistance for tomorrow. It give an advance information of tomorrows trend and momentum today itself if you study the CPR concepts you can be prepared for tomorrows' market and can very well know in advance if it will be a sideways market or a trending day.
PMA - Pivot Moving averages are an important combination of 3 Fibonacci series based moving averages. Here I have used 9,14 & 23 as the series which I found gave best results after long period of back testing and finetuning. It clearly gives you the mid term trend of the price and if you just follow the color of the band then you wont go wrong. Always try to take entries whenever price finds support or resistance close to the curve and avoid taking entries whenever price is too far from these curves.
These curves and the area are also color coded to depict buying and selling zones.
MAJOR TREND - This displays the prevailing major trend in the market and I have used as 200 period moving average by default which you can change to suit your needs. You can check the major trend of the market by using higher timeframes above 1Hr.
MARKET BIAS INDICATOR - One more unique feature of this Indicator is the background color which denotes on which medium trend currently the market is i.e whether Buying is favorable or selling is favorable. Light blue if for Buying zone and Light yellow is for selling zone.
BUY SELL triggers - This is going to be the most unique and advanced feature of this indicator. I have carefully studied and created a special trigger system which will alert the user whenever a BUY or SELL opportunity is presented in the stock. This is the result from a lot of study of the pivot strategies, CPR techniques, Price action theory, Candle stick patterns , market structure and my trading experience all put together. You can set the automatic alerts to any number of stocks to whichever timeframe you prefer either for Intraday or even swing & positional trading. ( Depends on the type of Trading view account you hold). Please note that this Indicator trigger's works even for the free trading view account and you do not need paid version.
Color classification - Buy triggers bars will be colored in Parrot green or Lime green color, Sell triggers bars will be colored in pink color. Regular Bullish and bearish candles will remain as Green and red.
ALERTS - I have coded automatic alert system in trading view and named them as ENTRY SIGNALS. You can add alerts to any of the stocks at whichever timeframe you prefer so that whenever there is a BUY or a SELL condition met, you will get notification or Desktop / Mobile app / Email etc.
IMPORTANT NOTE : This indicator does not guarantee any favorable results nor protect your from any loss. You own the complete risk of your trades. It is suggested that you use this indicator and do back testing for considerable period to understand how it works the the potential win rate it can give.

OnePunch Algo Momentum Indicator V1This is another Plugin from One Punch Algo Team. We call it OnePunch Algo Momentum Indicator V1.
Basic Use:
One Punch Algo Momentum Indicator plugin is used for momentum stocks and high volatility crypto. It provide signals based on Simple Moving Average, Volume, Support & Resistance Lines.
SIGNALS/ALERTS
Buy Signal: Purple Color uptrend icon gives you a signal of an up-trending movement or we call it momentum movement. This signal basically happen when a stock land in a high volatility zone. We use in-build systems such as SMA, Support and Resistance and Trends to come up with the Buy Signal.
Sell Signal: Gray Color downtrend icon gives you a signal of a downtrend movement.
Other Lines Shown in the Diagram:
Red Line is the 200 Day Simple Moving Average (SMA)
Green Line is the 50 Day Simple Moving Average (SMA)
Strategy Tester
Always make sure to use the strategy tester to test how historically our Algo has performed in different time frames. One Punch Algo Momentum Indicator provide the ability to backtest based on certain time periods. This allows you to backtest our Algo vs some other Algo to find which performed well for the given time period, you if you want to see buy and hold performance better than the use of an Algo. This is a strong tool to use for your analysis of a stock or crypto.
What are the timeframes where it is most effective?
Different Stocks or Crypto perform differently with One Punch Algo Momentum Indicator. Please make sure to backtest a stock or crypto before you use the strategy.
Short Term/Day Trading Setup
For Short Term or Day Trade: 1min, 5min, 15min & 30min candlesticks works really well.
Also 3min, 5min, 7min and 15min works as well
Mid Term Trading Setup
For Mid-term traders: 30min, 1hr,2hr, and 4hr setup works really well.
For Long Term Trading Setup
For long term traders: 4hr, 1D, 1Week and 1Month Setup works well.
Best used with Heikin Ashi or Candlestick charts.
DISCLAIMER: Stocks and options trading involves substantial RISK of LOSS and is NOT suitable for every investor. The valuation of stocks and options may fluctuate, and, as a result, clients may lose more than their original investment. If the market moves against you, you may sustain a total loss greater than the amount you deposited into your account. You are responsible for all the risks and financial resources you use and for the chosen trading system. You should not engage in trading unless you fully understand the nature of the transactions you are entering into and the extent of your exposure to loss. If you do not fully understand these risks, you must seek independent advice from your financial advisor.
All trading strategies are used at your own risk. And OnePunch ALGO Developer, Youtuber or the channel does NOT take any responsibility for your losses using any of the advice or suggestions or strategies are shown/said in any of OnePunch ALGO Youtuber or the channel videos.
[Hennessy]_Weather Buy Sell Swing SignalENG)
This indicator is based on ATR ( average true range ). The weather emojis are signaling changes in volatility . It generates a signal by breaking the ATR line.
Average True Range (ATR) is the average of true ranges over the specified period. ATR measures volatility , taking into account any gaps in the price movement.
Calculation
ATR = (Previous ATR * (n - 1) + TR ) / n
Where:
ATR = Average True Range
n = number of periods or bars
TR = True Range
The True Range for today is the greatest of the following:
Today's high minus today's low
The absolute value of today's high minus yesterday's close
The absolute value of today's low minus yesterday's close
💥 how to use :
🌈 - Long/Buy
⚡️ - Short/Sell
green ▲- adjust leverage or long hold
red ▼ - adjust leverage or short hold
Exit line - ATR trend line . can be used as an SL line.
💥Trading Strategy
This indicator is appropriate for swing or day traders.
Timeframe recommendation: 1H or 4H
when 🌈 /⚡️ appears it's a first entry point for long/short.
If ▲/▼ signal follows after 🌈 /⚡️ then hold your position until it shows the opposite signal.
However, since ATR is an indicator to find out trend changing points the signal might not be accurate on the "no trend" zone
In "NO TREND ZONE", you may stop trading by using this indicator and wait for the best signal or you may do the followings:
Try to use 21 EMA trend line - after the entry signal if the candle breaks the 21 EMA towards the opposite direction, close 50% of your position.
DO NOT FORGET TO EXIT on an opposite signal to your position. - e.g. enter at 🌈 > exit at ⚡️
Try to avoid entering a new position in NO TREND ZONE and try to use other indicators (such as RSI , Stoch , ADX , KDJ..etc.) as well to get a better result.
KOR)
Hennessy_Weather 지표는 ATR기반 보조지표입니다
TR의 돌파여부 등으로 진입 시그널을 발생시켜줍니다.
ATR( Average True Range )이란?
TR이라는 변동성의 값을 평균화하여 선으로 표현한 지표이다.
ATR지표는 다른지표와 다르게 매매신호를 보여주는것이 아닌, 변동성을 측정하여
종목의 위험도와 투자적합구간이 적합한지의 여부를 보여주는 특징입니다.
TR 구하는 공식으로는
1. 금일의 고가 - 금일의 저가
2. 금일의 고가 - 전일의 종가
3. 금일의 저가 - 전일의 종가
3가지 중 절대값이 가장 큰 값이 TR이 됩니다.
🌈무지개 = 롱 진입 시그널입니다.
⚡️번개 = 숏 진입 시그널입니다.
▲ = 롱 불타기 or 롱포지션 홀딩 시그널입니다.
▼ = 숏 불타기 or 숏포지션 홀딩 시그널입니다.
Exit Line = 단순 ATR을 표기해주는 선이며 매매에 도움 되지 않습니다.
Hennessy_Weather 매매전략
기본적으로 1시간 4시간봉에서 사용하기를 추천드립니다.
● 1시간 이상 타임프레임에서 신뢰도가 더 높으며
저배율로 스캘핑보단 데이트레이딩 혹은 스윙으로가져가시기를 추천 드립니다.
● 기본적으로 🌈(롱) / ⚡️(숏) 시그널에 1차 진입을 하며, 화살표에 불타기 혹은 HOLD를 선택합니다.
진입한 포지션의 반대 시그널이 나올 시에는 스위칭을 원칙으로 합니다.
● ATR은 변동성에 관한 지표이므로 횡보구간에 다소 취약할 수 있습니다.
강한 추세장에선 반대 페이크시그널이 다수 발생할수 있습니다.(저배율로 대응하세요)
● 횡보구간에서의 대응방법은 매매를 하지않는것과 다음과 같이 보수적으로 진입하는 방법이 있습니다.
● 보조도구로 넣어둔 21ema를 위나 아래로 돌파하여 수익발생시 고니, 다시 해당 ema를 돌파하려는 움직임에 엑싯하는 전략
● 몇번의 짧은 손절을 감수하고 🌈에 진입하였다면 반대시그널인 ⚡️에 스위칭하는 원칙매매로 대응하여
큰 방향 발생시 손실을 만회하는 전략이 있습니다.
횡보구간에서는 최대한 진입을 조심하고 다른 보조지표( RSI , Stochastic , ADX ,KDJ)등 과 함께 사용하여 보다 좋은 결과물을 만드시길 바랍니다.

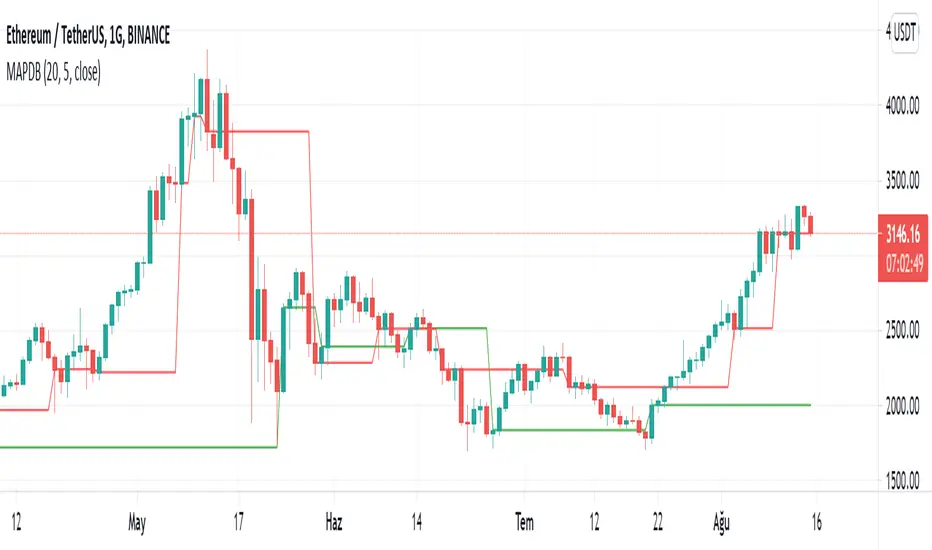
Moving Avarage Percentage difference bands It creates a buy and sell signal according to the up and down percentage differences of fast and slow moving averages. Green band breaks are buy and red band breaks are sell signals difference there is a threshold value for optimization, high values generate more signals, but the risk of these signals increases..
hızlı ve yavaş hareketli ortalamaların yüzdesel farklarının aşağıya ve yukarıya kırılımlarına göre alım ve satım sinyali oluşturur yeşil bant kırılımları al kırmızı bant kırılımları sat sinyalidir optimizasyon için eşik değeri eklenmiştir yüksek değerler daha fazla sinyal almanıza sebep olur ama riskli sinyal sayısı artar düşük değerler daha az sinyal almanızı sağlar ama riskli sinyal sayısıda azalır.
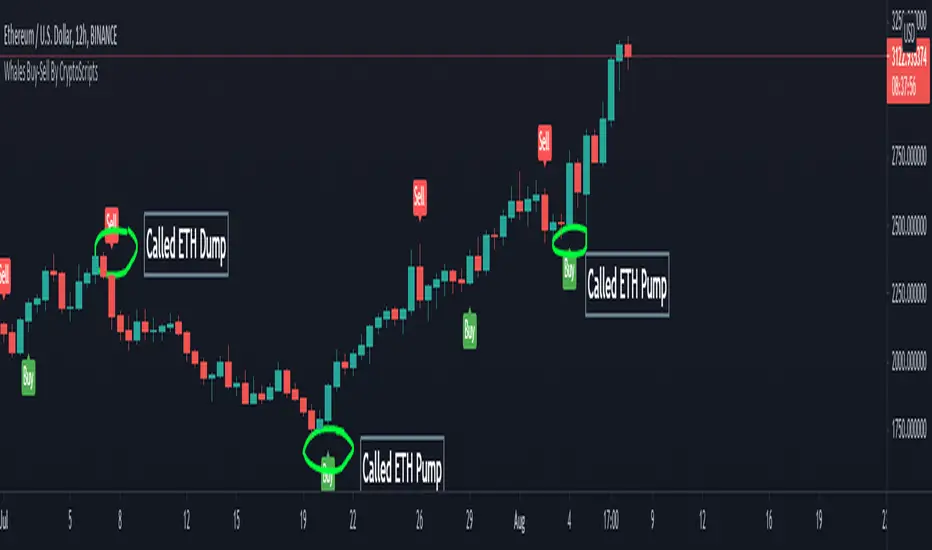
Whales Buy-Sell By CryptoScriptsThe Whales Buy-Sell indicator is very unique because it uses a combination of the smoothing range, average ranges, and hi-band/low-bands combined with various moving averages to nail whenever the overall trend is changing. This is extremely important during periods of high volatility and large moves. It helps to keep someone in a trade longer and get out fast if the trend is changing. The big caveat I can stress is waiting until the candle closes so that you know the signal is confirmed! Use the Bar Replay feature to further understand the intricacies of how the indicator produces signals. I find it is better on larger timeframes (1h and higher) because it's measuring larger trends. It can still be used on smaller timeframes but may not be as accurate. The big shortcoming is that is doesn't do well in choppy environments (i.e barely any price movement up or down) and you may get a lot of back and forth buy/sell signals so PLEASE keep that in mind. Experiment with various tickers/timeframes and see what works best for you :)
This indicator is a trend analysis indicator. Trend analysis is a technique used in technical analysis that attempts to predict future stock price movements based on recently observed trend data. Trend analysis is based on the idea that what has happened in the past gives traders an idea of what will happen in the future, but that is NOT always the case! Past performance is NOT indicative of future returns. There are three main types of trends: short-, intermediate- and long-term. Trend analysis tries to predict a trend, such as a bull market run, and then ride that trend until data suggests a trend reversal, such as a bull-to-bear market.
Alerts
You can set alerts for either a 'Buy Signal' or 'Sell Signal'. I recommend setting alerts for the candle close so that you know the signal is confirmed! If the "Add Alerts" option is greyed out for the indicator, just refresh your tradingview page and you should be able to see it :)
PM me to obtain access and please let me know if you have any questions!
DCA_PREMIUMOur new indicator tracks trends to create buy and sell alerts, see below how it works.
HOW IT WORKS:
It uses RMA which is the same moving average used by RSI and HMA, they intersect give us an entry signal, be it a buy or sell, as the entry signal the script will color the bars according to the signal.
When a GREEN candle appears, it indicates a large purchase volume and when a PURPLE candle appears, it indicates a large sales volume.
The indicator will alert for entries only according to the trend of the traded asset
FOR EXAMPLE:
I am trading USDJPY in an uptrend, the indicator will only alert me for buy entries, if it applies to downtrend.
DASHBOARD:
Our dashboard indicates the volatility of the traded asset, the short-term trend and the trade signal.
HOW TO USE:
Choose the asset you want to trade and, in the settings, change the time period you want for your trading style, for example: Swing Trade, Day Trade or Position.
See regions with large trading volumes indicating price manipulation or just supports and resistances too strong to break.

RSVP Extractor By CryptoScriptsThis indicator has the same alerts as the VP Extractor except I overlaid the RSI on top of it (yellow line) to help take advantage when the RSI is overbought/oversold while also being able to see what the VP extractor is saying :)
It highlights yellow any time the RSI is below 30 (potential buy signal) and highlights orange anytime the RSI is above 70 (potential sell signal). You can also adjust the settings so that it'll highlight yellow when RSI is below 25 or 20 etc. so you can pick whatever value you want and the colors will adjust accordingly :) You can also set alerts for RSI overbought/oversold!
Please see the VP Extractor Alerts below! Those are still the same as before but since I now have RSI then you can be more confident in your signals if RSI is flashing a yellow shaded area (oversold) and the VP extractor is flashing a rocket symbol (buy), then both together would be a very strong buy signal. Using the RSI signals with the VP Extractor signals below will make you VERY successful with this indicator :)
The VP Extractor signals is a combination of the Volume Extractor and Price Extractor. There was a lot of coding involved in this one and it involves a Volume / Price Oscillator derived from various volume /price metrics combined with Bollinger Bands and Overbought/Oversold levels. This indicator is unique because it not only measures the standard deviations whenever the oscillator crosses outside the BBs but it does so at ranges that are most advantageous for the trader to identify KEY buy/sell levels (as shown above). I'll break down each signal below and how to best take advantage of them so you can get the best entries and capture the most profit per trade.
*This indicator works best on the Binance or Bybit exchange for crypto but also works for stocks and forex. It's best used on small-medium timeframes such as the 15min, 1h, 4h, 8hr, or 12h. It tends to give more false signals on the 1D timeframes and higher.
Red Alarm - this signal indicates that the volume and/or price oscillators are overbought and/or crossing outside of the bollinger bands . This is a STRONG sell signal but should still be combined with support/resistance levels and confirmed with other indicators.
Red Diamond - this signal indicates that the volume and price oscillators are crossing outside of the bollinger bands above the 20 level but is not yet overbought. This is a potential sell signal but should still be combined with support/resistance levels and confirmed with other indicators.
Red Shaded Area - this indicates the volume and price oscillators are overbought. This is a potential sell signal but should still be combined with support/resistance levels and confirmed with other indicators.
Rocket - this signal indicates that the volume and/or price oscillators are oversold and/or crossing outside of the bollinger bands . This is a STRONG buy signal but should still be combined with support/resistance levels and confirmed with other indicators.
Green Diamond - this signal indicates that the volume and price oscillators are crossing outside of the bollinger bands below the 20 level but is not yet oversold. This is a potential buy signal but should still be combined with support/resistance levels and confirmed with other indicators.
Green Shaded Area - this indicates the volume and price oscillators are oversold. This is a potential buy signal but should still be combined with support/resistance levels and confirmed with other indicators.
Input Options
Show 80 Levels - This checkbox will create a red zone and green zone for the 60-80 levels on the indicator. This is useful if the volume and price oscillators reaches one of these levels, you can be sure it's going to reverse soon and can have more confidence if it crosses outside of the BBs in addition to that.
VEO Length - This changes the height of the oscillator and will change how your signals flash (more or less often). Use this if you find you're getting too many signals or not enough. I find this is best at 21 but feel free to test out what works for you depending on your timeframe.
Moving Average Volume Source - This is currently set to None but you can change it to Exponential, Hull, or Simple moving average . I found that None works best but feel free to test out the different options.
Moving Average Length - Changing this length will do nothing to your chart if None is selected for the Moving Average Volume Source, therefore you will most likely keep this setting default at 9.
Alerts
I've set alerts on this indicator for each icon (Red Alarm, Red Diamond, Overbought, Rocket, Green Diamond, Oversold). I HIGHLY recommend setting the alerts for Candle Close so that you can be sure the signal is confirmed.
You may notice that the indicator can give multiple signals back-to-back or be overbought/oversold for multiple candles. When this happens, it's best to look at other indicators such as the RSI , MFI Pro, etc to nail the best entry and have confluence with your decision. With that said, having multiple signals back-to-back can also be an indication that the move is close to happening.
This indicator is a strong indicator by itself but works best when combined with my other indicators just as the Whales Buy-Sell and the MFI Pro as well as the RSI , and MACD i.e taking a trade when all indicators are showing overbought, "Buy", "Sell", etc. Measuring volume and price action is an extremely important aspect of trading and one I believe should not be overlooked. I hope I made everything as clear as possible and please let me know if I didn't.
PM me to obtain access and please let me know if you have any questions! :D

Skynet PA oscThe Skynet PA osc has the following features :
1>>> Oscillator : The oscillator represents the rate of change of close price for the past 20 candles.
1.a> Bullish signal : When the oscillator turns green/lime color, it indicates that the price is gaining momentum on the upside.
1.b> Bearish signal : When the oscillator turns red, it indicates that the price is gaining momentum on the downside.
2>>> Entry/exit points :
2.a> Strong bullish : When an aqua/blue color diamond appears, it indicates a strong bullish momentum for the price.
2.b> Strong bearish : When a pink/purple color diamond appears on the zero line, it indicates a strong bearish momentum for the price.
**** Volume along with the oscillator is used to generate the diamond labels.
Disclaimer: This indicator is not 100% accurate and false signals are generated from time to time. Trading in the markets involves huge risks and one should always do his/her own research before making any trading decisions. This indicator is only designed to help you make a trading decision.

Skynet levels + trend + entry/exitThe Skynet levels + trend + entry/exit has the following features.
1>>> The SKYNET LEVELS : There are 3 Skynet levels namely "Upper Pivot" represented by color aqua/blue, "Lower Pivot" represented by the color pink/purple and "Pivot levels" represented by color yellow. The Skynet levels are calculated based on the OHLC data of the past 20 candles.
1.a> The "Upper Pivot" acts as the first resistance for the price and a breakout at the "Upper Pivot" indicates strong upward momentum.
1.b> The "Lower Pivot" acts as the first support for the price and a breakdown at the "Lower Pivot" indicates strong downward momentum.
1.c> The "Pivot level" acts as the median line for the price and the price behavior at the "Pivot level" should be given great significance.
***The "Upper Pivot" and "Lower Pivot" also displays the range of the price action for the past 20 candles. A narrow range indicates volatility suppression and possibility of a big price movement in the future.
Similarly, a wide range indicates volatility expansion which is usually followed by a sideways price movement.
The Skynet levels can be turned ON/OFF from the indicator settings.
2>>> The SKYNET TRENDS : The Skynet trend is a visual trend displayed to make it easy to identify the trend and change in trends.
The trends are identified using the movement of customized exponential moving averages and the price movement itself.
The green/lime color indicates a bullish trend and the red/maroon color indicates a bearish trend.
The darker shade of the green/lime color indicates a stronger bullish momentum and also indicates that the price is too far away from its mean level and there is a likely chance of mean reversion.
Similarly, the darker shade of the red/maroon color indicates a stronger bearish momentum and also indicates that the price is too far away from its mean level and there is a high chance of mean reversion.
3>>> Entry/Exit points : Entry/Exit points are represented by "Green up triangle" and "Red down triangle" respectively.
These labels are generated on the basis of the movement of the price in reference to its "Anchorline". The "Anchorline" is calculated by using the OHLC data of the past 20 candles.
**** This "Anchorline" is different from the earlier mentioned "Pivot level" . Both are derived from OHLC data of the past 20 candles but with different calculations.
Disclaimer: This indicator is not 100% accurate and false signals are generated from time to time. Trading in the markets involves huge risks and one should always do his/her own research before making any trading decisions. This indicator is only designed to help you make a trading decision.

Elastic OscillatorThis indicator will show the "tension" points on the market, possible turning points, and reversals. It's possible to change how much elasticity the indicator will filter. Another parameter is to show all the times the candle's high/low value touches the bands. There are three bands. It can work as a region for entering the signals and possible exit points.
The default configuration will provide very few signals. The higher the elasticity, the lower the number of signals. It can work as a confirmation indicator too.

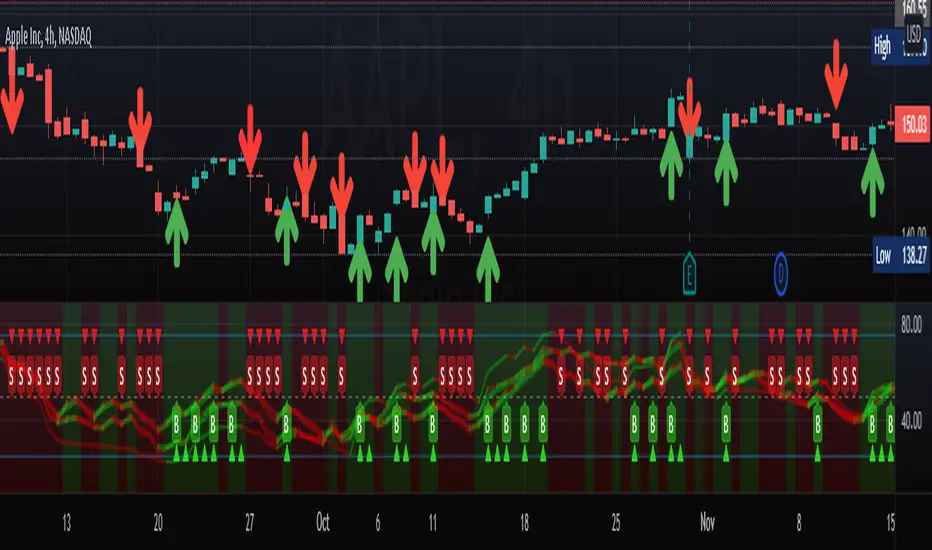
MechaOscillatorWhat is MechaOscillator?
MechaOscillator was created as a companion to our main script MechaAlgo. Using MechaOscillator along with MechaAlgo will allow you to boost your overall understanding of any market, and make more informed decisions as a trader.
Feature List
Built-In Improved WaveTrend Oscillator
Buy & Sell Signals
Bullish and Bearish Divergences
Short and Long Term Trend Indicators
Trend Strength Indicator
Market State Indicator
Real Time Informational Dashboard
Bullish and Bearish Breakout Indicator
Many More Features to Come!
By using this script you acknowledge that MechaOscillator cannot guarantee you profit, and that this product was only created in attempt to benefit traders. You also acknowledge that past performance is not indicative of future results, and that the experience of other users or what you see online may not always be your experience.

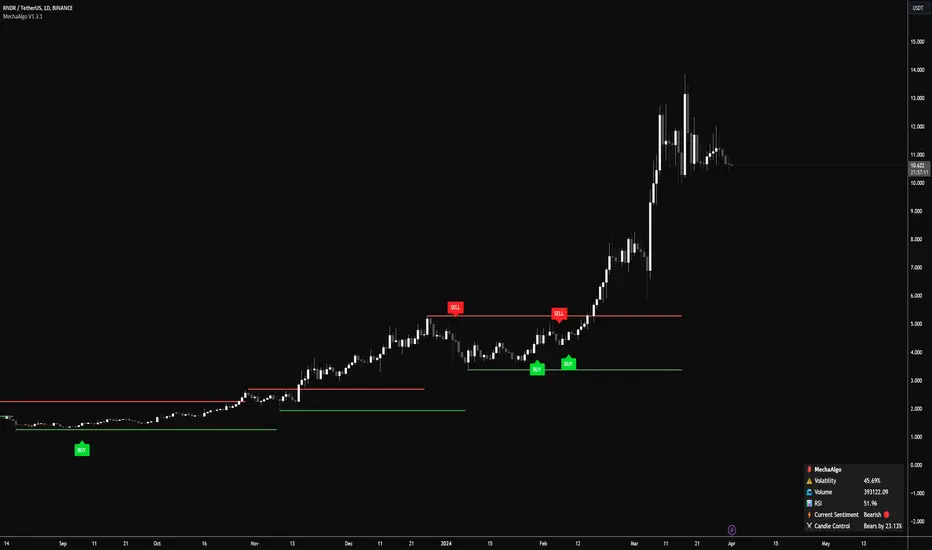
MechaAlgoWhat is MechaAlgo?
MechaAlgo was created to assist any type of trader on a day to day basis. Our intelligent and accurate algorithms turn complex charts into profitable plays, minimizing losses and maximizing profits. We hope that you will find use in the tools and resources we provide, and we will continue to improve on our products in order to take your trading to new heights!
Any Time, Any Market
Our indicators work with real time data on any market. This means that any kind of trader will find our tools useful, regardless of what you are trading.
Feature List
Multiple Signal Modes
Numerous Candle Coloring Modes
Reversal Cloud Overlay
Auto Support & Resistance
Auto Trendlines
Auto Profit Targets
Real Time Informational Dashboard
Multi-Timeframe Trend Panel
Future Trend Projection
Many More Features to Come!
By using this script you acknowledge that MechaAlgo cannot guarantee you profit, and that this product was only created in attempt to benefit traders. You also acknowledge that past performance is not indicative of future results, and that the experience of other users or what you see online may not always be your experience.