custom Bollinger bands with filters - indicator (AS)-----------Description-------------
This indicator is basically Bollinger bands with many ways to customize. It uses highest and lowest values of upper and lower band for exits. I think something is wrong with the script but cant find any mistakes – most probably smoothing. The ATR filter is implemented but is working incorrectly. In code you can also turn it into strategy but I do not recommend it for now as it is not ready yet.
So this is my first script and I am looking for any advice, ideas to improve this script, sets of parameters, markets to apply, logical mistakes in code or any ideas that you may have. Indicator was initially designed for EURUSD 5MIN but I would be interested in other ideas.
-----------SETTINGS--------------
---START - In starting settings we can choose
Line 1: what parts to use BB/DC/ATR
Line 2: what parts to plot on chart
Line 3 Whether or not apply smoothing to BB or ATR filter
Line 4 Calculate deviation for BB from price or Moving average
Line 5 Fill colors and plot other parts for debug (overlay=false)
Line 6:( for strategy) – enable Long/Short Trades
---BB and DC – here we modify Bollinger bands and Donchian
Line 1: Length and type of BB middle line and also length of DC from BB
Line 2: Length and type of BB standard deviation and multiplier
Line 3: Length and type of BB smoothing and %width for BB filter
---ATR filter – (not ready fully yet)
Line 1: type and length of ATR
Line 2: threshold and smoothing value of ATR
---DATE and SESSION
Line 1: apply custom date or session?
Line 2: session hours settings
Line 3:Custom starting date
Line 4: Custom Ending date
-----------HOW TO USE--------------
We open Long if BB width is bigger than threshold and close when upper band is no longer highest in the period set. Exact opposite with Short
Bband

Bollinger Bands %B (ValueRay)One of the key features of this BB%B is its ability to highlight overbought and oversold conditions. This allows you to make informed decisions on when to enter and exit a trade, helping you maximize your profits and minimize your losses.
- Bollinger Bands %B with the ability to change to a different Time Frame.(Defaults to current Chart Time Frame).
- Ability To Turn On/Off Background Highlighting if BB %B is Above/Below 0 / 1 thresholds.
- Ability To Turn On/Off Background Highlighting when BB %B Crosses back above/unser 0/1 thresholds.
---
My personal recommandation use: combine with CM_Ultimate RSI Multi Time Frame (ChrisMoody) and have solid oversold/overbought levels, when hes RSI and my BB %B are bot red/green

BB-RSI-ADX Entry PointsThis is a combination of indicators used to find oversold and overbought entry points for possible reversion.
A Green arrow will appear when all condition are met for an ENTER LONG position.
A Red arow will appear when all condition are met for an ENTER SHORT position.
You can modify all of these condition parameters from the indicator's settings.
How does the indicator work
The signals are using Bollinger Bands , BB %B , RSI and ADX indicators to try and find points of reversal
Enter LONG Conditions
Current candle low is below BB lower band.
The BB %B is more than 0.
RSI > 30
ADX > 25
Enter SHORT Conditions
Current candle high is above BB upper band.
The BB %B is less than 1.
RSI < 70
ADX > 25
Those are the default settings that seem to work for me but you can customize all of these from the indicator settings.
I find this strategy to best work on a 3 minute timeframe
Note: The bb %B is calculated for stDev - 1. This will help you see a change happening faster.

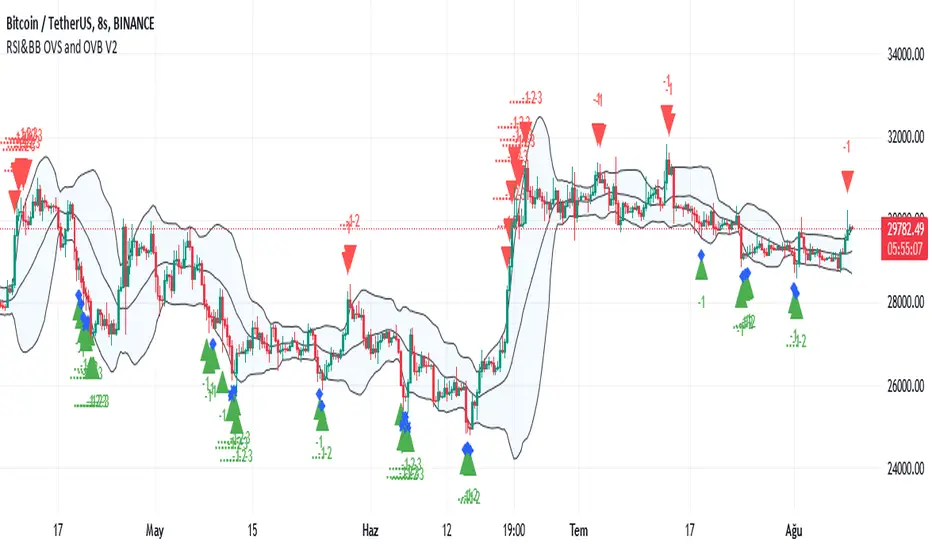
RSI and BBand simultaneously OverSoldENG : This indicator is created by combining the standard period RSI indicator with an Oversold limit of 32, an Overbought limit of 70 and a period of 14 (these values can be changed optionally from the entries and still tabs of the indicator settings) and the Bollinger Band. indicator with a standard deviation of 2 and a period of 20. Also, the RSI Oversold is an upward green triangle where the price simultaneously falls below the BB and the lower limit (Low) (i.e. below 32), where the RSI Overbought (i.e. above 70) at the same time the price rises above the BB and the upper limit (Upper) is a downward red triangle. is indicated by a triangle. An alarm condition is established on these conditions. Source codes are posted visually and written in clear language and with explanations for beginners to learn to pine.
TR : Bu gösterge OverSold sınırı 32, OverBought sınırı 70 ve periodu 14 olan (bu değerler tercihe göre indikatör ayarlarının girdiler ve still sekmelerinden değiştirilebilir) standart periodluk RSI göstergesi ile standart sapma değeri 2, periodu 20 olan Bollinger Bandı göstergesinin birleştirilmesiyle oluşturulmuş olup ilaveten RSI'nin OverSold iken (yani 32 altına düştüğü) aynı anda fiyatın BBand alt sınırı (Lower) altına düştüğü yerleri yukarı yönlü yeşil üçgenle, RSI'nin OverBought iken (yani 70 üstüne çıktığı) aynı anda fiyatın BBand üst sınırı (Upper) üstüne çıktığı yerleri aşağı yönlü kırmızı üçgenle belirtmektedir. Bu şartlar üzerine de alarm kondüsyonu oluşturulmuştur. Kaynak kodları görünür olarak yayınlanmış olup, pine öğrenmeye yeni başlayanlar için anlaşılır dilde ve açıklamalar eklenerek yazılmıştır.
BBands ChannelsBased on the Bollinger Bands system. This shows outer channels to the bollinger bands .

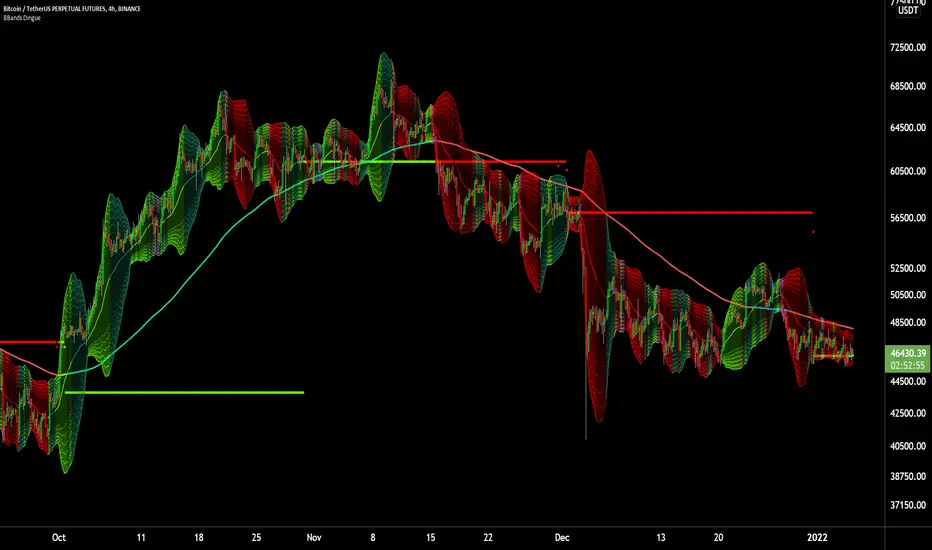
6X Bollinger Bands + MA + VWAP Dingue V56X Bollinger Bands Dingue V5 - This is the updated version for Pine Script 5
This indicator lets you quickly see all the intricacies of the Bollinger Bands; it simplifies its usage and maximizes the results.
Color-coded if the price is above or under the middle and based on direction.
Color-coded for expansion and contraction of the bands.
Option to plot ‘Squeezed bands’. It will show above the bands when they become smaller than the setting chosen. This helps identify build-up that might explode one way or another.
- 6x independent Bands can be adjusted as you want. It gives you possibilities in how you see variance, trends, support and resistance.
You can also select the MA type: SMA EMA WMA VWAM FRAMA … to explore new ways to see the Bollinger bands.
New in this version, you can now add a separate ‘Long MA’ that you can select independently from the Bands. Ex. Plot 200 SMA This helps in building a strategy with the trend and the bands.
Like the MA above, you can also plot 2 different VWAP independently from the Bands. This also helps knowing where the price stands compared to the bigger time frame VWAP’s price.
'Tool tips' explain other settings, if you have any questions, feel free to ask in the comments below.
Thank you for the feedback and check all my ‘Dingue’ indicators.
Bollinger Band Layer Entry (BBLE) The Bollinger Band Layer Entry Indicator uses plenty of Bollinger Bands to create an onion-looking layered indicator to help with layered entries. It is similar to a Ribbon but better. This indicator is best used with any volume-related indicator so you can recede from entering into any position with too much momentum to rebound off of any line. Note that this indicator is best used with another strategy like pair trading. It is not recommended to trade based on this indicator only. Please stay aware of any news about the stock you are trading because some events may have a big impact and force the market to go bullish/bearish by a lot. This indicator can be used with all chart types and works well with many other indicators. It allows for complete customization and offers easy-to-understand settings which can be designated to a certain individual. You can modify every single factor of the BBs which allows for an even more personalized and adapted Indicator that reflects your trading/ investing needs. You also have the option to choose which type of MAs will be used to create the Bollinger Bands , a few of which include: EMA, SMA, WMA, HMA, RMA, DMA, LSMA, VAMA, TMA, MF.
Bollinger Bands are a way to measure and visualize volatility. As volatility increases, the wider the bands become, and the more they deviate from the basis. Vice versa, when volatility decreases, the gap between the bands and basis decreases. Yet a big advantage for not only this but many other indicators is created due to the ample count of different settings that are widely used, it is difficult to view the market through the eyes of all types of investors/traders. This indicator manages to counter exactly this issue, you will be able to see all of these settings on one chart and at one time and enter/exit positions accordingly.
Using this indicator will allow you to visualize entries with ease and make order layering (buying/selling in layers) much more simple. You can choose a certain amount of Bollinger Bands you would like displayed and customize all technical and style-related settings related to each of the BBs separately.
A few of the technical settings you can change for each Bollinger Band are:
Bollinger Band count (Select how many BBs you want to be displayed.)
MA type used to make the Bollinger Bands (EMA, SMA, WMA, etc.)
Source (close, open, high, low.)
BB length (The length of each Bollinger Band, its lookback. How many previous candles should it be based on? Choose each Bollinger Band's lookback length.)
BB deviator (The standard Deviator applied for the BB for both the upper and lower line.)
Offset
A few of the style settings you can change for each Bollinger Band are:
Upper, Lower, Basis line opacity % (separate for each)
Upper, Lower, Basis line color (separate for each)
Fill (the color used to fill from the upper to the lower band) (separate for each)
Fill opacity % (the opacity used when filling the upper line to the lower line) (separate for each)
This indicator is unique because it can be used for all strategies and all trading styles, for example, day trading or long-term investing, really anything if used correctly. The reason it can be used in so many instances is a result of the detailed and in-depth settings tab that allows complete customization of each separate Bollinger Band. This allows the indicator to be used and to be useful in various situations and allows you to dominate the market. Integrated alerts also enhance your efficiency while using this indicator because you can choose to be notified at the crossing of any of the Bollinger Bands.
The technical part of this indicator plots the selected amount of Bollinger Bands using custom-built specified Bollinger Bands accordingly. Then it uses the style settings and styles it as you selected.

Bollinger Bands Fibonacci Ratios StrategyHello, everyone!
We have just released an innovative strategy for TradingView. It allows you to identify price pivot points and volatility.
This strategy is:
User-friendly
Configurable
Equipped with Bollinger Bands and smoothed ATR to measure volatility
Features
Thanks to the BB Fibo strategy, you can:
Trade stocks and commodities.
Identify price pivot points.
Choose any band for trading Long or Short positions.
Swap upper and lower bands applying Use Reverse Buy/Sell parameters.
Note! The upper bands are for the Long position. The lower bands are for the Short positions.
Parameters
We have equipped our strategy with more than 14 additional parameters. So, you can configure the EA according to your needs!
Inputs:
Length
Source: Open, High, Low, Close, HL2, HLC3, OHLC4
Offset
Fibonacci Ratio 1 — a Fibonacci factor for the 1st upper and lower indicator lines calculating.
Fibonacci Ratio 2 — a Fibonacci factor for the 2nd upper and lower indicator lines calculating.
Fibonacci Ratio 3 — a Fibonacci factor for the 3d upper and lower indicator lines calculating.
Use Reverse Buy — the strategy will use lower Bollinger bands instead of upper ones.
Fibonacci Buy — band selection for opening Long positions conditions.
Use Reverse Sell — the strategy will use upper Bollinger bands instead of lower ones.
Fibonacci Sell — band selection for opening Short positions conditions.
Style:
Basis — baseline color and style settings.
Upper 3 — the 3d upper line color and style.
Upper 2 — the 2nd upper line color and style.
Upper 1 — the 1st upper line color and style.
Lower 1 — the 1st lower line color and style.
Lower 2 — the 2nd lower line color and style.
Lower 3 — the 3d upper line color and style.
Background — the background color within the 3d upper and 3d lower indicator band.
Precision — the number of decimals for BB Fibo values.
Note! Try BB Fibo on your demo account first before going live.

Kelt + BBand Combination (kingthies) █ Overview
The Kelt-BBand Combo is a trading approach that I've used for multiple years now, and works on any timeframe, chart possible. There are various versions of this approach published by myself and others who find value in measuring the deviations of price and strategize market entries and exits. For an entry-level description of each component, I'll type them up below.
█ Using This Indicator
While there are various strategies to use this tool, I'll share the one that has yielded me the most success across traditional and cryptocurrency markets - first understand the different appearances of both....
IF the bbands are inside the kelts, the squeeze is on. In 90% of cases this is often a bullish leaning event
IF the bbands are pinching (regardless of slope or kelt behavior),these are your primary support and resistances, respectively
When trending up, HA candles will touch between the upper kelt and upper bband on every candle, across all timeframes
When trending down, HA candles will touch between the lower kelt and lower bband on every candle, across all timeframes
If one timeframe is not giving clear indicator of trend direction or s/r to follow, zoom out. the higher timeframe will always win and show you the true direction
█ Intro to Bollinger Bands
Bollinger Bands consists of a center line representing the moving average of a security’s price over a certain period, and two additional parallel lines (called the trading bands) one of which is just the moving average plus k-times the standard deviation over the selected time frame, and the other being the moving average minus k-times the standard deviation over that same timeframe. This technique has been developed in the 1980’s by John Bollinger, who lately registered the terms “Bollinger Bands” as a U.S. trademark in 2011. Technical analysts typically use 20 periods and k = 2 as default settings to build Bollinger Bands, while they can choose a simple or exponential moving average. Bollinger Bands provide a relative definition of high and low prices of a security. When the security is trading within the upper band, the price is considered high, while it is considered low when the security is trading within the lower band.
There is no general consensus on the use of Bollinger Bands among traders. Some traders see a buy signal when the price hits the lower Bollinger Band and close their position when the price hits the moving average. Some others buy when the price crosses over the upper band and sell when the price crosses below the lower band. We can see here two opposing interpretations based on different rationales, depending whether we are in a reversal or continuation pattern. Another interesting feature of the Bollinger Bands is that they give an indication of the volatility levels; a widening gap between the upper and lower bands indicates an increasing volatility, while a narrowing band indicates a decreasing volatility. Moreover, when the bands have an almost flat slope (parallel to the x-axis) the price will generally oscillate between the bands as if trading through a channel.
█ Intro to Keltner Channels
Keltner Channels aka Kelts were first described by a Chicago grain trader called Chester W. Keltner in his 1960 book How to Make Money in Commodities. Though Keltner claimed no ownership of the original idea and simply called it the ten-day moving average trading rule, his name was applied by those who heard of this concept through his books.
Similarly to the Bollinger Bands, Keltner channel is a technical analysis tool based on three parallel lines. In fact, the Keltner indicator consists of a central moving average in addition to channel lines spread above and below it. The central line represents a 10-day simple moving average of what Chester W. Keltner called typical price. The typical price is defined as the average of the high, low and close. The distance between the central line and the upper, or lower line, is equivalent to the simple moving average of the preceding 10 days' trading ranges.
One way to interpret the Keltner Channel would be to consider the price breakouts outside of the channel. A trader would track price movement and consider any close above the upper line as a strong buy signal. Equivalently, any close below the lower line would be considered a strong sell signal. The trader would follow the trend emphasized by the indicator while complementing his analysis with the use of other indicators as well. However, the breakout method only works well when the market moves from a range-bound setting to an established trend. In a trend-less configuration, the Keltner Channel is better used as an overbought/oversold indicator. Thus, as the price breaks out below the lower band, a trader waits for the next close inside the Keltner Channel and considers this price behavior as an oversold situation indicating a potential buy signal. Similarly, as the price breaks out above the upper band, the trader waits for the next close inside the Keltner Channel and considers this price movement as an overbought situation indicating a potential sell signal. By waiting for the price to close within the Channel, the trader avoids getting caught in a real upside or downside breakout.
Happy Trading!

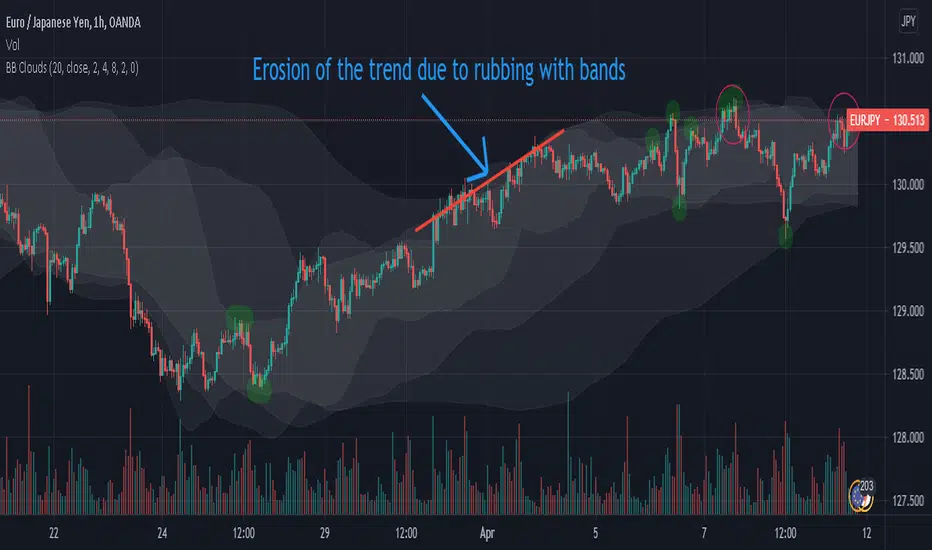
Bollinger Bands Clouds - BB CloudsBollinger Bands Clouds provides Bollinger Bands of different timeframes in a chart.
It actually shows BB from a new angles.
This indicator can show three BB from different timeframes simultaneously.
The idea is to be able to combine different levels of BB from other timeframes in one chart
Each cloud is a Bollinger band whose time frame is a multiple of the current chart time frame. If this multiplier is set to 1, its Bollinger bands will be drawn for the current time frame and will be no different from normal Bollinger bands.
This indicator can be suitable for fractal perspective.
Multipliers can be changed from within the indicator settings:
settings -> mult1, mult2 and mult3
For a dark theme, enable the Dark Theme option from the indicator settings.
Asynchronous Bollinger Bands - Async BBThis indicator allows you to draw Bollinger bands using higher timeframes.
Note: The timer of your Bollinger Bands must be a multiple of the current chart of the chart.
For example: If your chart is 4 h and you set the sync value to 3, the Bollinger Bands will be drawn with a 12H time frame. 3 * 4H = 12
If the sync is equal to 1, normal Bollinger bands are drawn and will be no different from the normal Bollinger band .
Using this indicator may be appropriate for fractal perspectives.

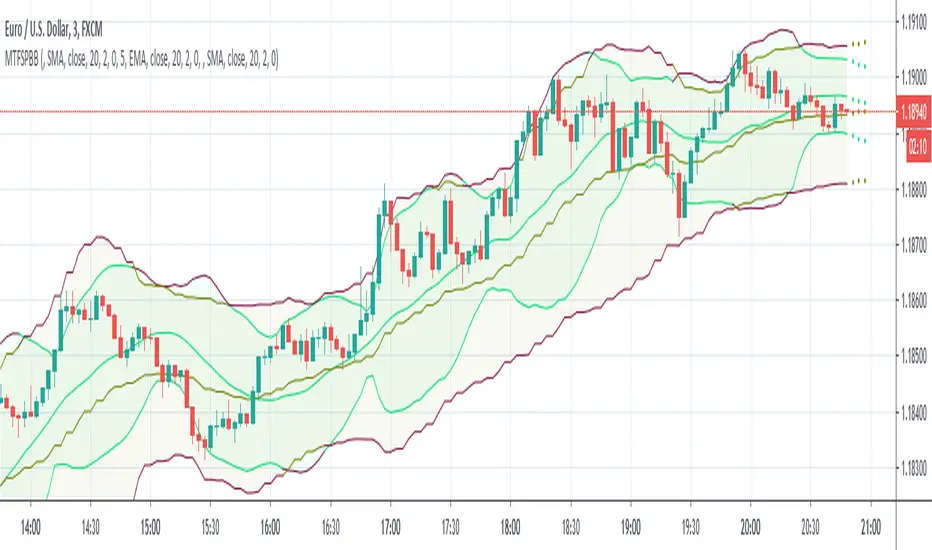
MultiTimeFrame Shifting Predictive Bollinger BandsThis is the optimized version of my MTFSBB indicator with capability of possible bands prediction in case of negative shifting (to the left).
Make me happy by using it and sending me your ideas about the prediction.
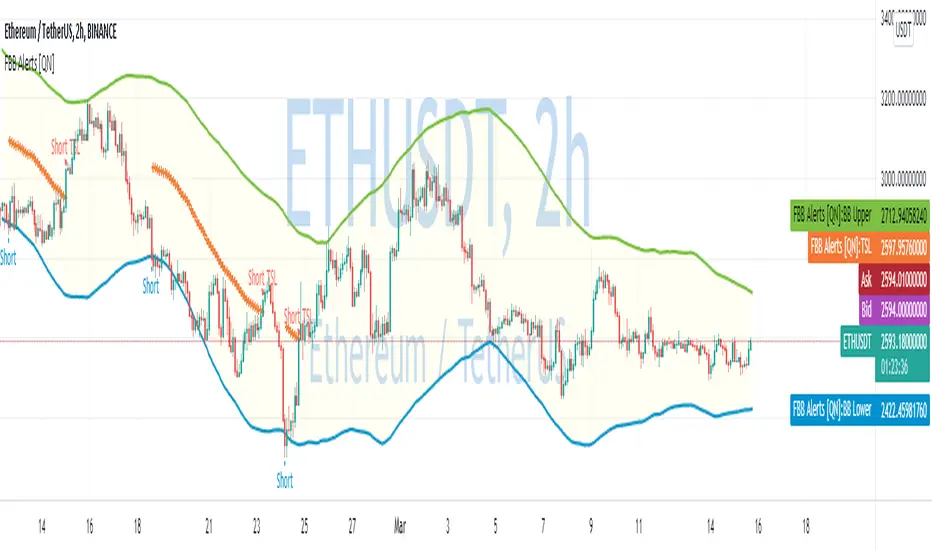
Fibonacci Bollinger Bands Alerts [QuantNomad]These are alerts for my Fibonacci Bollinger Bands Strategy. You can find more details and strategy description in it:
It's a pro indicator, you can have access to it for a small fee. Link to my PRO indicators you can find in my signature.
Disclaimer
Please remember that past performance may not be indicative of future results.
Due to various factors, including changing market conditions, the strategy may no longer perform as good as in historical backtesting.
This post and the script don’t provide any financial advice.
3MAs & BB, Time-Res, Low-VolTriple MAs with EMA/SMA option, and specific timeframe options.
Very customizable.
Bollinger Bands
If BollingerBand Width is lowest in 100 bars it fills background.

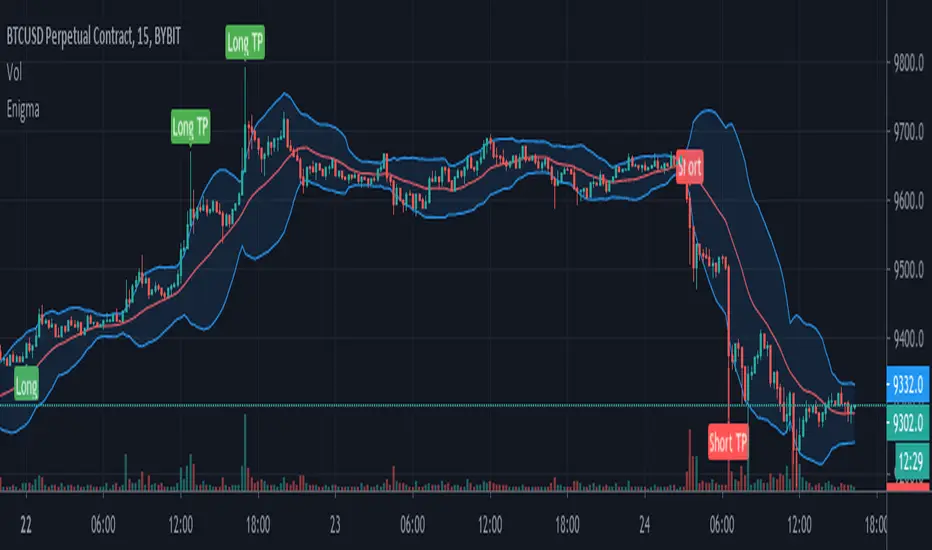
EnigmaThis is the study version of the Enigma strategy.
The indicator is based on volatility algorithm that measures changes in market prices over a period of time.
Trading Rules
1. Go long when the buy signal appears.
2. Go short when the sell signal appears.
3. Close the position when the take profit signal appears.
4. Risk 2-5% of porfolio max.
5. Use stop loss of 3% from entry.
Please PM me for access.
Enigma (STRATEGY)Based on volatility algorithm that measures changes in market prices over a period of time.
Trading Rules
1. Go long when the buy signal appears.
2. Go short when the sell signal appears.
3. Close the position when the take profit signal appears.
4. Risk 2-5% of porfolio max.
5. Use stop loss of 3% from entry.
Please PM me for access.

MultiTimeFrame Shifting Bollinger BandsJust 3 Bollinger Bands with different adjustable timeframes plus shifting (left/right) capability and non-integer deviation values.
I wrote this because I couldn't find the perfect BB indicator that matches my needs. Feel free to use it.

BB-levels_MTFThis indicator draws Bollinger Bands- levels from higher timeframes on the chart's right border as a horizontal support/resistance lines. BB(20)- levels are shown from timeframes MN, 2W, 1W, 1D, 4H and 1H.
Levels are shown both for Standard Deviation 1 (dotted BB25- and BB75- lines) and STD 2 (solid BB0- and BB100- lines), as well as SMA20 (blue BB50- line).
You can choose if you want to see only the lines or the labels also. And you can modify the line's length and width, and the label's position on the screen also.

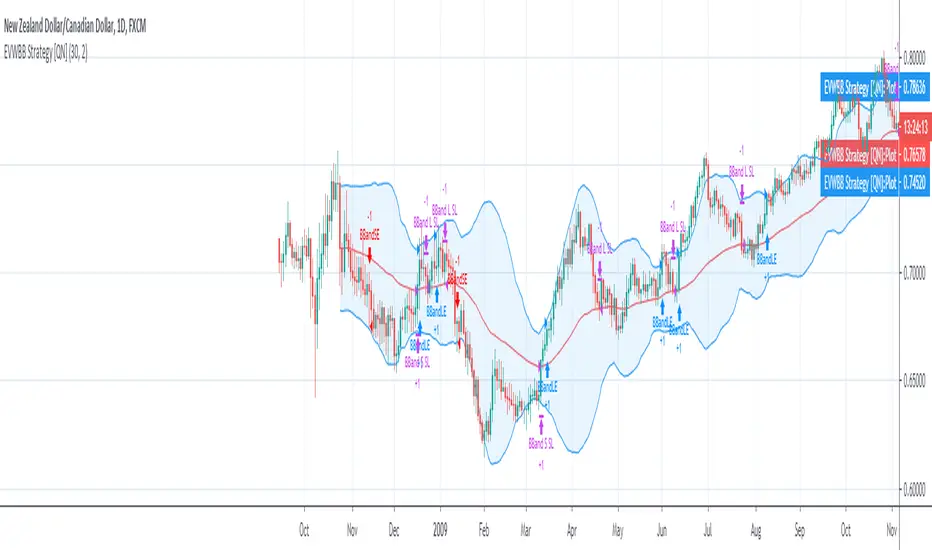
EVWBB Strategy [QuantNomad]It's my new strategy using EVWMA (Elastic Volume Weighted Moving Average).
Now I created a Bollinger Bands strategy where basis level is EVWMA.
It looks pretty interesting but you have to be careful with the entries/exits on the same bar, I'm using stop orders, so on big moves it happens pretty often.
In the next version, I will try to eliminate these issues.
Entry for this strategy happens when price crossover upper for long and lower for short. I exit both short and long on basis level.
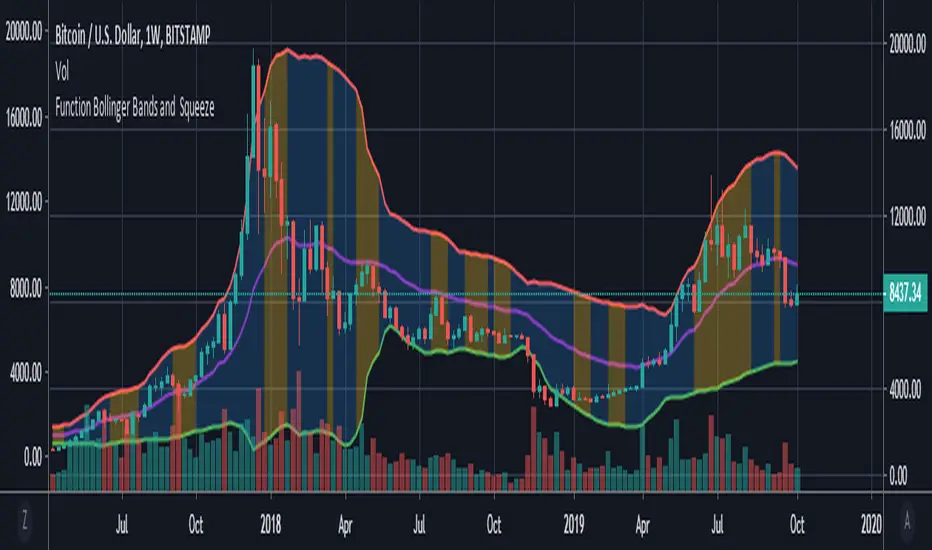
Function : Bollinger Bands and BBW Squeeze DetectorThis script shows Bollinger Bands function and want to detect Bollinger Band Width Squeeze with a successful, different perspective .
Bollinger Bands : You can specify the Bollinger Bands periods as mutable variables .
Bollinger Band Width Squeeze : First the Bollinger bands width was calculated.The width was then divided into levels using the money flow index.
Thus, the bollinger takes into account the available volume averages when calculating the band width mfi (Money Flow Index).
After this modelling, we can limit and color the lower limit and upper limits just as Relative Strength Index.
We can even put warnings on oversold areas if desired. Let's not forget that we are working with width rather than price.
By design, squeeze areas are defined directly above the Bollinger Bands with coloration. I think it is very practical and looks stylish.
I tried and found it quite successful and wanted to share it with users.
I came up with many ideas when I wrote this system, and I will share them very soon . I hope it will be useful to users and give new ideas.
Best regards.

Multi EMA/SMA with Bollinger Bands Combo 1.0This script provides:
5 regular EMAs
5 regular SMAs
3 multiple time frame EMAs
3 multiple time frame SMAs
Bollinger Bands
All features can be turned on/off and customized regarding color, lines, etc.
Excellent for TradingView users with limited or free accounts.

Price Divergence + OBV Candles + EMAPrice Divergence
Fisher Transform
MACD
Stochastic
BB%
OBV Candles
Positive or negative obv overlay on candles
EMA Cloud + cross trend bar
Fav and I'll add you.
