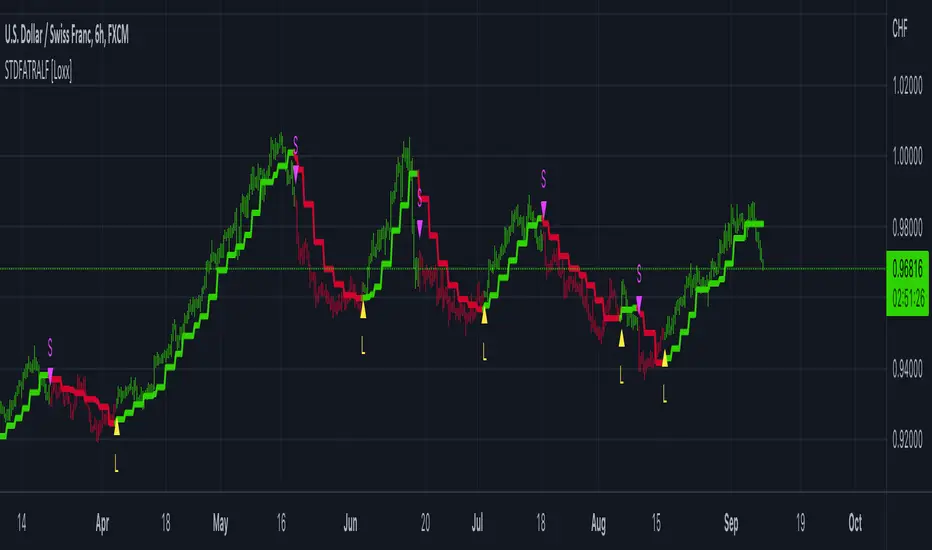
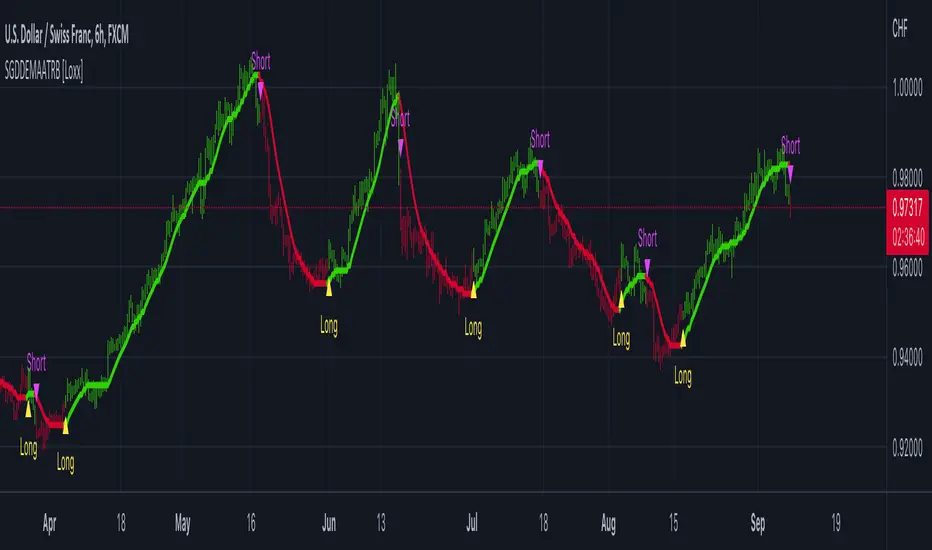
ATR Trailing Stop Loss [V5]A complete ATR Trailing Stop Loss in version 5.
Features Include:
Timeframe Option
Long/Short Triggers (Green/Red Triangles)
Long/Short Conditions (Bottom Colored Line)
"Golden" Long/Short Triggers (Yellow Triangles)(Hanging Man or Shooting Star Candlestick patterns breaking ATR trailing stop)
Alerts
Rango Verdadero Medio (ATR)

ATR Trend Bands [Misu]█ This indicator shows an upper and lower band based on price action and ATR (Average True Range)
The average true range (ATR) is a market volatility indicator used in technical analysis.
█ Usages:
The purpose of this indicator is to identify changes in trends and price action.
It is mainly used to identify breaking points and trend reversals.
But it can also be used to show resistance or support levels.
█ Features:
> Buy & Sell Alerts
> Buy & Sell Labels
> Color Bars
> Show Bands
█ Parameters:
Length: Length is used to calculate ATR.
Atr Multiplier: A factor used to balance the impact of the ATR on the Trend Bands calculation.

SuperTrend Entry(My goal creating this indicator) : Provide a way to enter the market systematically, automatically create Stop Loss Levels and Take Profit Levels, and provide the position size of each entry based on a fix Percentage of the traders account.
The Underlying Concept :
What is Momentum?
The Momentum shown is derived from a Mathematical Formula, SUPERTREND. When price closes above Supertrend Its bullish Momentum when its below Supertrend its Bearish Momentum. This indicator scans for candle closes on the current chart and when there is a shift in momentum (price closes below or above SUPERTREND) it notifies the trader with a Bar Color change.
Technical Inputs
- If you want to optimize the rate of signals to better fit your trading plan you would change the Factor input and ATR Length input. Increase factor and ATR Length to decrease the frequency of signals and decrease the Factor and ATR Length to increase the frequency of signals.
Quick TIP! : You can Sync all VFX SuperTrend Indicators together! All VFX SuperTrend indicators display unique information but its all derived from that same Momentum Formula. Keep the Factor input and ATR Length the same on other VFX SuperTrend indicators to have them operating on the same data.
Display Inputs
- The indicator has a candle overlay option you can toggle ON or OFF. If toggled ON the candles color will represent the momentum of your current chart ( bullish or bearish Momentum)
your able to change the colors that represent bullish or bearish to your preference
- You can toggle on which shows the exact candle momentum switched sides
your able to change the colors that represent a bullish switch or bearish switch to your preference
- The trader can specify which point you would like your stop loss to reference. (Low and High) Which uses the Low of the Momentum signal as the reference for your Stop Loss during buy signals and the High as the reference during sell signals. Or (Lowest Close and Highest Close) which uses the Lowest Close of the Momentum signal as the reference for your Stop Loss during buys and the Highest Close as the reference during sells.
- The colors that represent your Stop Loses and Take Profits can also be changed
Risk Management Inputs
- Your Risk MANAGMENT section is used to set up how your Stop Loss and Take Profit are calculated
- You have the option to take in account Volatility when calculating your Stop Loss. A adjusted ATR formula is used to achieve this. Increase Stop Loss Multiplier from 0 to widen stops.
- Increase Take Profit Multiplier from 0 to access visual Take Profit Levels based on your Stop Loss. This will be important for traders that Prefer trading using risk rewards. For Example: If the the Take Profit Multiplier is 3 a Take Profit level 3 times the size or your stop loss from your entry will be shown and a price number corresponding to that Take Profit Level becomes available.
- Enter your current Account size, Bet Percentage and Fixed Spread to get your Position Size for each trade
-Toggle on the Current Trade Chart and easily get the size of your Position and the exact price of your Take Profit and Stop Loss.
You can increase the Size of the Current Trade Chart= Tiny, Small, Normal, Large, Huge and change the Position of the Current
trade Chart to your preference, (Top- Right, Center, Left) (Middle- Right, Center, Left) (Bottom- Right, Center, Left).
How it can be used ?
- Enter Trades and always know where your stop is going to be
- Eliminate the need to manual calculate Position Size
- Get a consistent view of the current charts momentum
- Systematical enter trades
- Reduce information overload

The Killer Whale - Multiple Keltner Channels by JoeFinally, after centuries of pain and suffering, the good townsfolk of TradingView have been given a single Keltner Channel indicator that will grant them FREE access to MORE THAN ONE Keltner Channel.
With "The Killer Whale" indicator, Joe has once again saved all the peasants—those who cannot add 10,000 indicators to our charts—from the dirty tyrants who arrogantly rule over us with disdain.
And, now, not only can you have more than one Keltner Channel with this single indicator, but you can have UP TO FOUR! For FREE!
Yes, I know, it seems too good to be true. But, install and enjoy your newfound freedom!
Options:
Keltner Channel length and source
Multiplication Factor for each channel
SMA or EMA
ATR Length
Border and fill colors for each channel
Now, go, therefore, and Keltner to your heart's content. May The Killer Whale be with your charts forever!

SSL + Wave Trend StrategyStrategy incorporates the following features:
Risk management:
Configurable X% loss per stop loss
Configurable R:R ratio
Trade entry:
Based on strategy conditions below
Trade exit:
Based on strategy conditions below
Backtesting:
Configurable backtesting range by date
Trade drawings:
Each entry condition indicator can be turned on and off
TP/SL boxes drawn for all trades. Can be turned on and off
Trade exit information labels. Can be turned on and off
NOTE: Trade drawings will only be applicable when using overlay strategies
Alerting:
Alerts on LONG and SHORT trade entries
Debugging:
Includes section with useful debugging techniques
Strategy conditions
Trade entry:
LONG
C1: SSL Hybrid baseline is BLUE
C2: SSL Channel crosses up (green above red)
C3: Wave Trend crosses up (represented by pink candle body)
C4: Entry candle height is not greater than configured threshold
C5: Entry candle is inside Keltner Channel (wicks or body depending on configuration)
C6: Take Profit target does not touch EMA (represents resistance)
SHORT
C1: SSL Hybrid baseline is RED
C2: SSL Channel crosses down (red above green)
C3: Wave Trend crosses down (represented by orange candle body)
C4: Entry candle height is not greater than configured threshold
C5: Entry candle is inside Keltner Channel (wicks or body depending on configuration)
C6: Take Profit target does not touch EMA (represents support)
Trade exit:
Stop Loss: Size configurable with NNFX ATR multiplier
Take Profit: Calculated from Stop Loss using R:R ratio
Credits
Strategy is based on the YouTube video "This Unique Strategy Made 47% Profit in 2.5 Months " by TradeSmart.
It combines the following indicators to determine trade entry/exit conditions:
Wave Trend: Indicator: WaveTrend Oscillator by @LazyBear
SSL Channel: SSL channel by @ErwinBeckers
SSL Hybrid: SSL Hybrid by @Mihkel00
Keltner Channels: Keltner Channels Bands by @ceyhun
Candle Height: Candle Height in Percentage - Columns by @FreeReveller
NNFX ATR: NNFX ATR by @sueun123

MTF Supertrend [Trading Nerd]Trend Trading Strategy using Supertrends
Backtesting Script that uses a multitimeframeanalysis of the Supertrend Indicator. The trend direction is determind by a higher Timeframe (TF) Supertrend. The entry Signals are given by the Supertrend of the current TF. The script is NOT repainting (the script takes the previous value of the higher TF Supertrend, if the higher TF candle is not confirmed yet).
Strategy Conditions
Longs:
The higher TF Supertrend has to be green
The current TF Supertrend change from red to green
Shorts:
The higher TF Supertrend has to be red
The current TF Supertrend change from green to red
Optional:
Option: If enabled also a trend chage of the higher TF Supertrend is a valid Entry Signal
If enabled Signals are discarded if the ADX is below the value
Take Profit
On default there is no Take Profit. You can activate a Risk Reward Based Take Profit target trough the option. Also a Partial Take Profit is possible.
Stop Loss
The default Stop Loss Strategy is a Trailing Stoploss. As trailing Price the current TF Supertrend is used.
Additional
Time Filter: Only opens trade in the defined Session. Open trades are still being closed outside of the Session.
Start Date/End Date: Limits the backtest for the defined Date Range
Trading Days: Only open Trades on the checked Days
Risk % per Trade: If enabled the Strategy uses X% of the capital (defined in Settings -> Properties -> Initial Capital)
Use Compound Interest: If enabled Capital is recalculated for every trade (initial capital + net Profit)
IMPORTANT: For low Timeframes and Markets with tight SL (like Forex) it requires a lower Margin Percent than default. Go to Settings->Properties and lower the required Long/Short Margin. Otherwise Trades might not be considered because of too less capital/marign. Margins can e.g. set to: 2% (Forex), 10% (Stocks), 20% (Crypto).

Candle Info by MontyThis indicator was made to help my friend.
This indicator basically calculates the MOVE in percentage and shows the OHLC of candle in a label.
-> Panel Index: How much index you want the label to be.
-> Show Candle OHLC: Shows Open High Low and Close of the candle in the panel/label
-> % Calculation Mode:
1: Calculated by Candle Wick Low to Candle Wick High for Green candle and Vice Versa for Red Candle
2: Calculated by Open of a candle to the current price.
-> Label Text Color: Used to change the color of the Label Text
-> Label Background Color: Used to change the color of Label background
Join the free Discord: discord.gg/chuffgang

ER-Adaptive ATR, STD-Adaptive Damiani Volatmeter [Loxx]ER-Adaptive ATR, STD-Adaptive Damiani Volatmeter is a Damiani Volatmeter with both Efficiency-Ratio Adaptive ATR, used in place of ATR, and Adaptive Deviation, used in place of Standard Deviation.
What is Adaptive Deviation?
By definition, the Standard Deviation (STD, also represented by the Greek letter sigma σ or the Latin letter s) is a measure that is used to quantify the amount of variation or dispersion of a set of data values. In technical analysis we usually use it to measure the level of current volatility .
Standard Deviation is based on Simple Moving Average calculation for mean value. This version of standard deviation uses the properties of EMA to calculate what can be called a new type of deviation, and since it is based on EMA , we can call it EMA deviation. And added to that, Perry Kaufman's efficiency ratio is used to make it adaptive (since all EMA type calculations are nearly perfect for adapting).
The difference when compared to standard is significant--not just because of EMA usage, but the efficiency ratio makes it a "bit more logical" in very volatile market conditions.
The green line is the Adaptive Deviation, the white line is regular Standard Deviation. This concept will be used in future indicators to further reduce noise and adapt to price volatility .
See here for a comparison between Adaptive Deviation and Standard Deviation
What is Efficiency Ratio Adaptive ATR?
Average True Range (ATR) is widely used indicator in many occasions for technical analysis . It is calculated as the RMA of true range. This version adds a "twist": it uses Perry Kaufman's Efficiency Ratio to calculate adaptive true range
See here for a comparison between Efficiency-Ratio Adaptive ATR, and ATR.
What is the Damiani Volatmeter?
Damiani Volatmeter uses ATR and Standard deviation to tease out ticker volatility so you can better understand when it's the ideal time to trade. The idea here is that you only take trades when volatility is high so this indicator is to be coupled with various other indicators to validate the other indicator's signals. This is also useful for detecting crabbing and chopping markets.
Shoutout to user @xinolia for the DV function used here.
Anything red means that volatility is low. Remember volatility doesn't have a direction. Anything green means volatility high despite the direction of price. The core signal line here is the green and red line that dips below two while threshold lines to "recharge". Maximum recharge happen when the core signal line shows a yellow ping. Soon after one or many yellow pings you should expect a massive upthrust of volatility . The idea here is you don't trade unless volatility is rising or green. This means that the Volatmeter has to dip into the recharge zone, recharge and then spike upward. You can also attempt to buy or sell reversals with confluence indicators when volatility is in the recharge zone, but I wouldn't recommend this. However, if you so choose to do this, then use the following indicator for confluence.
And last reminder, volatility doesn't have a direction! Red doesn't mean short, and green doesn't mean long, Red means don't trade period regardless of direction long/short, and green means trade no matter the direction long/short. This means you'll have to add an indicator that does show direction such as a mean reversion indicator like Fisher Transform or a Gaussian Filter. You can search my public scripts for various Fisher Transform and Gaussian Filter indicators.
Price-Filtered Spearman Rank Correl. w/ Floating Levels is considered the Mercedes Benz of reversal indicators
Comparison between this indicator, ER-Adaptive ATR, STD-Adaptive Damiani Volatmeter , and the regular Damiani Volatmeter . Notice that the adaptive version catches more volatility than the regular version.
How signals work
RV = Rising Volatility
VD = Volatility Dump
Plots
White line is signal
Thick red/green line is the Volatmeter line
The dotted lower lines are the zero line and minimum recharging line
Included
Bar coloring
Alerts
Signals
Related indicators
Variety Moving Average Waddah Attar Explosion (WAE)
Damiani Volatmeter

STD-Filtered, ATR-Adaptive Laguerre Filter [Loxx]STD-Filtered, ATR-Adaptive Laguerre Filter is a standard Laguerre Filter that is first made ATR-adaptive and the passed through a standard deviation filter. This helps reduce noise and refine the output signal. Can apply the standard deviation filter to the price, signal, both or neither.
What is the Laguerre Filter?
The Laguerre RSI indicator created by John F. Ehlers is described in his book "Cybernetic Analysis for Stocks and Futures". The Laguerre Filter is a smoothing filter which is based on Laguerre polynomials. The filter requires the current price, three prior prices, a user defined factor called Alpha to fill its calculation. Adjusting the Alpha coefficient is used to increase or decrease its lag and it's smoothness.
Included:
Bar coloring
Signals
Alerts
Loxx's Expanded Source Types
Step Generalized Double DEMA (ATR based) [Loxx]Step Generalized Double DEMA (ATR based) works like a T3 moving average but is less smooth. This is on purpose to catch more signals. The addition of ATR stepped filtering reduces noise while maintaining signal integrity. This one comes via Mr. Tools.
Theory:
The double exponential moving average (DEMA), was developed by Patrick Mulloy in an attempt to reduce the amount of lag time found in traditional moving averages. It was first introduced in the February 1994 issue of the magazine Technical Analysis of Stocks & Commodities in Mulloy's article "Smoothing Data with Faster Moving Averages". The way to calculate is the following :
The Double Exponential Moving Average calculations are based combinations of a single EMA and double EMA into a new EMA:
1. Calculate EMA
2. Calculate Smoothed EMA by applying EMA with the same period to the EMA calculated in the first step
3. Calculate DEMA
DEMA = (2 * EMA) - (Smoothed EMA)
This version:
For our purposes here, we are using Tim Tillson's (the inventor of T3) work, specifically, we are using the GDEMA of GDEMA for calculation (which is the "middle step" of T3 calculation). Since there are no versions showing that "middle step, this version covers that too. The result is smoother than Generalized DEMA, but is less smooth than T3 - one has to do some experimenting in order to find the optimal way to use it, but in any case, since it is "faster" than the T3 (Tim Tillson T3) and still smooth, it looks like a good compromise between speed and smoothness.
Usage:
You can use it as any regular average or you can use the color change of the indicator as a signal.
Included
Alerts
Signals
Bar coloring
Loxx's Expanded Source Types
Reversal MagictrendThis indicator combine multiple indicator in one pine script : Main indicator is Exponential Moving Average (EMA), Commodity Channel Index (CCI), Average True Range (ATR), Crossover Signal & Alert.
1)
For Exponential Moving Average (EMA) have 5 type :
EMA 7 : Green Color (Transparent)
EMA 21 : Red Color (Transparent)
EMA 34 : Orange Color (Faint)
EMA 50 : Purple Color (Transparent)
EMA 90 : Aqua Color (Faint)
Trendband / Background Color in between EMA line :
EMA 7 Cross up EMA 21 : Green
EMA 7 Cross down EMA 21 : Red
EMA 21 Cross up EMA : Yellow
Crossover Signal :
EMA 7 Cross up EMA 21 = Golden Cross : Blue Diamond
EMA 7 Cross down EMA 21 = Death Cross : Red Diamond
Example :
2)
Commodity Channel Index (CCI) :
Have background color : Green for positive value
CCI Signal = Anchor / Hook
- As a signal of reversal. Strong reversal when appear on weekly chart
Example :
Weekly :
Daily :
I am inspired from : www.tradingview.com
Check out his indicator here :
3)
Average True Range (ATR) as Supertrend
Green (Start) New Start for uptrend
Red (End) New Start for downtrend
Also Add on value for each signal.
Example :
I am inspired from : www.tradingview.com
Check out his Supertrend here :
4)
For this indicator, user have option to turn on / off :
- Previous Signal as a backtest
- Previous Trend as a backtest
- ATR to make chart more clean.

Capital Coders - Volume/Volatility StrategyThis strategy utilizes a combination of Volume and volatility to identify highly volatile candles, in periods of high and low volume trading. This allows the strategy to adjust to the market conditions. The Average True Range will highlight High Volatility breakouts, while the 24Hr Volume will determine weather the Trend will continue, or reverse.
Risk Management is an important part of any trading strategy. With this Strategy, you can leave your Risk calculator at home. Simply enter the maximum Risk per trade (% of your account) and let the Strategy determine your lot/position size.
Dynamically exit the market based on a single or multiple take profit levels. With simple configuration, this makes it easier than ever to dynamically exit the market.
Strategy includes the following features
Built in Risk Management
Variable Take Profit Levels
Built in Strategy Alerts
Signal Customization
ATR Range ProbabilityUse ATR for measure range probability reversal or target line calculate by close price +- %ATR
Default line and table show -100 to 100%, And the rest can add in setting tab max 200%
- This release measure base on TF D, Line and Table appear on TF D and lower
- Table show range %ATR ,data and difference form current price ,
- line price and text need to be update.

Braid Filter with adjustable ATRThis is an update of the Braid Filter indicator by Mang, with an option to modify ATR value to reflect on the chart. It is also updated to Pine Script v5.

PluePhantom's Trailing Stop Loss Multiple of ATRThis is a simple trailing stop loss line for long and short positions, made by Bluephantom using PS v2. I converted it onto v5
It is calculated as a multiple of the ATR instead of a percentage.
You are able to change the multiple and the ATR length.
It can be used as a guide to where you should consider putting in your stop loss on a trade and to where you should move your stop loss to as the days go by.
This indicator is experimental. Use at your own risk.

KTP ATR , TR and DATR by Mitraj ThakkarThis indicator provides values of ATR, TR and DATR values side by side which makes it easy for user to compare it for current
candle and takes decision. It is not a complete system for trading but it aids in taking decision for entry and exit. for eg. ema crossover is formed for entry, we can take entry 5% of datr above pattern and keep stop loss 10% datr below pattern.
ATR stands for Average true range of last 14 candles.
TR stands for true range of each candle.
DATR stands for Daily Average True Range.

Daily/Weekly ExtremesBACKGROUND
This indicator calculates the daily and weekly +-1 standard deviation of the S&P 500 based on 2 methodologies:
1. VIX - Using the market's expectation of forward volatility, one can calculate the daily expectation by dividing the VIX by the square root of 252 (the number of trading days in a year) - also know as the "rule of 16." Similarly, dividing by the square root of 50 will give you the weekly expected range based on the VIX.
2. ATR - We also provide expected weekly and daily ranges based on 5 day/week ATR.
HOW TO USE
- This indicator only has 1 option in the settings: choosing the ATR (default) or the VIX to plot the +-1 standard deviation range.
- This indicator WILL ONLY display these ranges if you are looking at the SPX or ES futures. The ranges will not be displayed if you are looking at any other symbols
- The boundaries displayed on the chart should not be used on their own as bounce/reject levels. They are simply to provide a frame of reference as to where price is trading with respect to the market's implied expectations. It can be used as an indicator to look for signs of reversals on the tape.
- Daily and Weekly extremes are plotted on all time frames (even on lower time frames).

3c Ultimate reversal strategy With scanner and backtester v2This might just be the ultimate strategy to identify reversals.
This strategy includes a scanner, a backtester and ability to connect it with you 3 commas bot(See adviced settings below)
Strategy:
-Signals reversal that happened in the last bar. This signal DO NOT repaint.
-Identifies potential reversal that might happen in the current bar but can also not happen depending upon the timeframe closing price.
-The strategy combines the Moving Average Trend Changer, SuperTrend (ATR price detection) and ADX.
-It reduces the number of false signals in sideways market conditons and give more reliable trade signals.
-The signal does not repaint and can be used in any market condition. It determines the trend with high precision.
Take profit:
-Set 2 separate TP conditions.
-You can take profit using percentage, ATR, or RR(Risk Reward), aswell as using Trailing Take Profit.
- Use sell signal from the strategy(I often find way better results using that)
Stoploss:
-You can use either ATR, Percentage or sell signal from the strategy
(For now to let the strategy itself decide when to TP or SL, just set these parameters really high.)
Scanner:
-Identifies coins that are currently in the sell zone
-Identifies coins that are currently in the buy zone
-Screener explores up to 20 pairs in current graph's time frame.
-Optimize the strategy to your liking and use the built in backtester to see if it is a viable strategy.
3commas settings:
-For now you can only use simple bots.
-Create LONG and SHORT bots for the coins you like to trade and set up alerts(You can send long and short signal from the same alert)
-Set TP to 50% the strategy will handle buys and exits based on your inputs.
-Set safety orders to 0. I might add DCA to the strategy if testing proves that to be a good solution.
-When you have made the bots input the bot ID and token adress in the settings of the strategy.
-When creating the alert use this webhook :https://3commas.io/trade_signal/trading_view
-In the message field you use {{strategy.order.alert_message}} as the placeholder.
In the future this signal might make it to the 3commas marketplace. You can then subscribe to that signal where I have cherrypicked coins based on thorough backtesting and optimization.

[SS]Multicolor BB with Squeez Moving Average & Colored BarsHello Followers,
Hope u guyz doing well in the market.
Came with a standalone Trading System which helps u with the trend & choppiness zone.
This system is combination of multiple stretagies which makes it better than single published indicators.
=========================================================================================================
We have used Variety-Filtered, Squeeze Moving Averages which is a chop zone indicator that identifies when price is below a specific volatility threshold calculated as the difference between a fast and slow moving average and filtered using ATR- or Pips-based threshold. This indicator can be use as both an entry and exit indicator. It identifies both chop zones and breakouts/breakdowns
Uses:-
When the candles turn white and the threshold bands appear on the chart, this is indicative of low volatility
When price exits the threshold bands, price will usually explode up or down giving a long or short signal. This acts as a sort of squeeze momentum.
Included:
Bar coloring
Signals
Alerts, 4 types of alerts: Squeeze started, Squeeze ended, long, and short
<<------------------------------------->>
Multicolour Bollinger Bands indicator that indicates market phases.
It plots on the price chart, thanks to different color zones between the bands, a breakdown of the different phases that the price operates during a trend.
The different zones are identified as follows:
- red color zone: trend is bearish , price is below the 200 periods moving average
--> orange color zone: price operate a technical rebound below the 200 periods moving average
- yellow color zone: (phase 1 which indicate a new bearish cycle)
- light green zone: (phase 2 which indicate a new bullish cycle)
--> dark green zone: trend is bullish , price is above the 200 periods moving average
- grey color zone: calm phase of price/low volatility
- dark blue color zone: price is consolidating in either bullish or bearish trend
- light blue zones: price will revert to a new opposite trend (either long or short new trend)
By identifying clearly the different market phases with the multicolor Bollinger bands , the market entries by either a the beginning of a new trend or just after a rebound or a consolidating phase is easier to spot on.
<<==========================>>
The credit of above indicator souce goes to loxx & Deveatt. I just backtested and modified it to increase accuracy of trade and clear visual representation for trades.
Modified the trend based SMA and BB period and entry criteria.
<<===========================>>
<>
1) Look for BB COLOR and SMA for trend either up or down.
2) Look Bar coloring, enter when price above sma and green for long else short.

Daily Volume, RVol, RRVol, and RS/RW LabelsHeads-up display of essential Real Day Trading criteria
Daily Volume
Relative Strength/Weakness
ATR 14 and ATR 14 percent of price
Relative Volume (RVol)
Relative Volume to SPY RVol (RRVol)

Mtf Supertrend Table
english
It is a study of how the supertrend indicator looks on multiple timeframes. You can see the Supertrend direction in Multiple Timeframes by looking at the chart
Türkçe
supertrend indikatörünün çoklu zaman dilimdlerinde nasıl göründüğü yönünde bir çalışmadır. Tabloya bakarak Çoklu Zaman dilimlerinde Supertrend yönünü görebilirsiniz

True_Range_%Average True range percent show the the latest true range value as percentage of previous close.
Standard ATR shows the average of absolute value of True range. This is problem when price level changes over time. Because Stocks trading at higher price level e.g $1,000 will have high ATR value as compared to stocks trading $ 50. This may look like volatility has increase recently which is of-course not true. As you can see in the chart, ATR value of period before 2020 is lower than the recent period.
True Range Percentage solves value. With this script you can also find when there is a Volatility spike (1.5 time of avg) or Low volatility (0.7 times of avg).
Volatility is cyclic in nature. It oscillates between high and low. Observing this behavior can be extremely usefully in timing entry and exits.

Swing Trend StrategyThis script is a trend following system which uses a long term Moving Average to spot the trend in combination with the Average True Range to filter out Fakeouts, limiting the overall drawdown.
Default Settings and Calculation:
- The trend is detected using the Exponential Moving Average on 200 periods.
- The Average True Range is calculated on 10 periods.
- The Market is considered in an Uptrend when the price closes above the EMA + ATR.
- The Market is considered in a Downtrend when the price closes below the EMA - ATR.
- The strategy will open a LONG position when the market is in an Uptrend.
- The strategy will close its LONG positions when the price closes below the EMA.
- The strategy will open a SHORT position when the market is in a Downtrend.
- The strategy will close its SHORT positions when the price closes above the EMA.
This script is best suited for the 4h timeframe, and shows good results on BTC and ETH especially.
The options allow to modify the type of moving average to use, the period of the moving average, the ATR multiplier to add as well as the possibility to open short trades or not.
