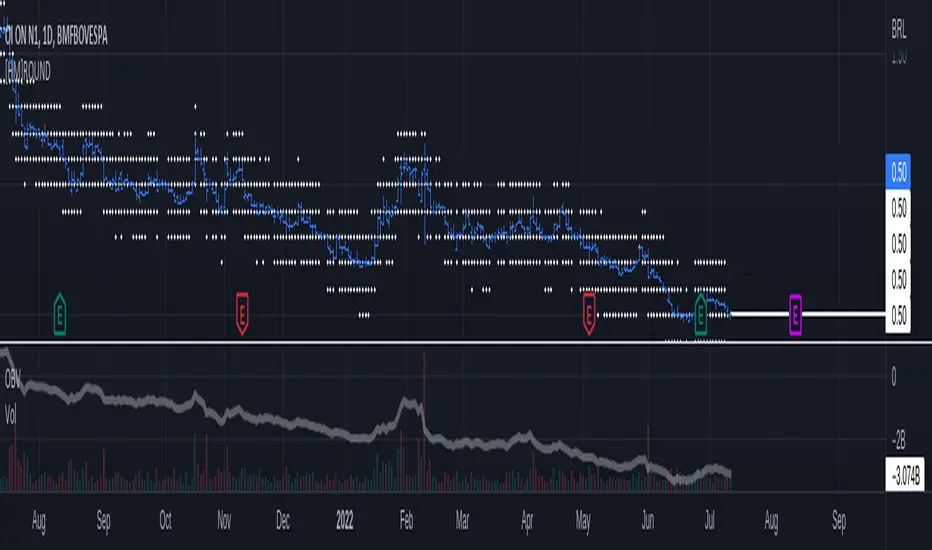
Market ExtremitiesHere I'm proposing an indicator to measure market extremities, it is different than usually used STDv function and has a much simpler underlying mechanism. However, what you will compromise by it is that it is not going to work efficiently like STDv and you will need to use some form of trend and momentum indicators along with it. Not efficiently doesn't mean not tradable, in fact, this is what I use over STEDv myself to reduce the noise of Bollinger Bands.
This indicator is only designed to catch the highs and lows of the market during intraday. It works across all markets and it is surprisingly good at it and has certain predictive nature since the price seems to hang around the extreme lines. Having said that, an astute trader can trade this for both breakouts and mean reversion strategies.
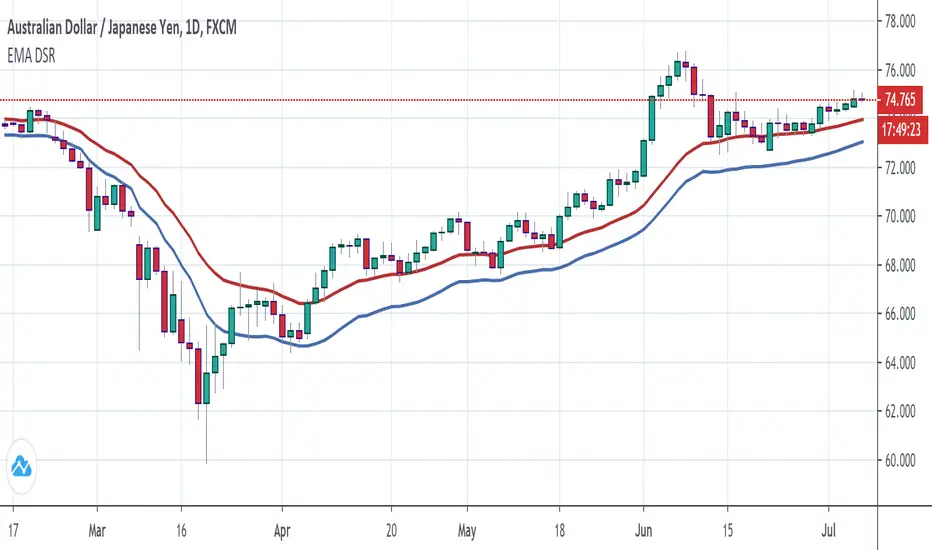
For reference here is one chart marked
This is for educational purpose only-
Past performance is no indicator of future success and author takes no responsibility for the trader's actions.
Enjoy~
ATR

MedianBandsHere I propose another simple S/R band technique, works on all TF and all securities, this is again one of the simplest forms of logic with a little tweak to tackle modern volatile markets.
It enables us to trade both mean reversion as well as breakout trades as it works in both trending and non-trending markets. You can even use pre-existing ranges as good position management markers.
It requires little to no intervention from the user. The white line is the opening price of the day, I'm a big believer of that so you will find it everywhere in my indicators. :3
Past performance is not assurance of the future performance and this is for educational purposes only.
The script will be protected to avoid theft but you can add to your favorites to use it as you please.
Enjoy~

Trend Cloud
The clouds reflect a possible overextension of the trend. Traders could use it as a signal to scale out the positions in the direction of the present trend or avoid scaling in.
The indicator plots the difference between ADX over the 45 level proportionate to the range between an ATR multiplier around MA. By default, the ADX is calculated with a DI length of 14 and an ADX smoothing of 14, an ATR length of 14, MA length of 20 and a multiplier of 2.
On the chart, I have highlighted with the vertical line the candles when the indicator was activated on all four timeframes simultaneously.
ATR_Trade_strategyATR Based Strategy
Identify the ATR range on Daily Chart.
ATR HIGH= Previous Close +ATR
ATR Low =Previous Close - ATR
Long when Close is above ATR High
Short when Close is below ATR Low
Exit when close moves below EMA(10) OR
a user-selected max loss
Alpha BandsAlpha Bands, this is a new idea I've been playing with recently in all my indicators.
In layman terms we are here using mult to multiply length of the plot to replicate effect of multi time frame plot. Under the hood it is basically fast ma crossing over slow one but with this simple multiplier introduction is able to give it properties of higher TF ma's but without the usual problem of the TV where multitimeframe MA plots rather crudely if you use security function.
Introducing it as core trend indicator, and around it I've utilized ATR to create simple but complete indicator to give good view of the market state and trend. Due to this setup it can be used for both trending and mean reversion trades, you can also utilize existing ranges for entry, exit and SL.
This indicator is example of how simple little tweaks can turn a age old tools into more advanced solutions.
This is purely for educational purposes, any past or claimed results may not replicate themselves while you trade them so use your own discretion. Author takes no responsibility of individual traders success or loss on this.
Source code will be protected since there is trend on TV where ideas are stolen and sold to unsuspecting retailers.

Exertion MeterHello traders, today I wanted to present you something special. I present you the Exertion Meter!
Created from scratch, this idea is based on a theory of mine called "Exertion".
Exertion occurs when price moves beyond the previous bar's range thus it has "exerted itself".
The idea is that when price moves a lot, it exerts a lot of energy which eventually leads to calmer motion, usually in the direction price has exerted itself.
Now, when price has exerted itself a lot in a particular direction, it's telling you that it will likely continue in that direction.
Once this happens, it will gradually calm down until price begins the cycle again, exerting itself in either the same or opposite direction.
This theory is similar to the theory of expansion & contraction phases.
This indicator attempts to show you where price has exerted itself by giving you a two lines cross signal.
The default settings are recommended, but experimentation is encouraged to fit your own personal system.
Both settings control the standard deviation line ( aka . Upper Bollinger Band ).
Enjoy, and hit the follow button to get easy access to all my indicators and to follow my latest publications!
ATR Auto Oscillator [DepthHouse]The ATR Auto Oscillator uses advanced range calculations to determine a dynamic range that the applied market moves within. Like an RSI , the ATR Auto Oscillator measures the speed and change of price movements through a given range. Unlike an RSI , the ATR Auto Oscillator automatically re-configures range values dependent on the user set lookback.
The oscillator ranges between (0.1) and 1.1. Generally, the market is oversold while the bands are below 0.2 and is overbought while above 0.8.
The two bands displayed are used to determine short term trend directions and the oversold/undersold state of the applied market. Crossovers of these bands could give a hint to the direction the market is moving.
The fast band (green) is the direct value of where the market is within its calculated range; 1.1 representing the top of range, and -0.1 representing the bottom. Even when this value is near the bottom of the top of the range, the auto oscillator will readjust to create a new range that the market travels within.
The slow band (red) is a lagging version of the fast band which is used to determine the oversold/overbought signals. When this band travels within the oversold and overbought regions the background color will change to signal a warning. If the fast band crosses the slow band within these zones, an opaque signal will appear. These signals are used to catch possible trend reversals.
Breakout Signals ( BETA ):
Breakout signals are the up and down arrows displayed on the top and bottom of the oscillator. A refined range is generated by the user set 'High Low Length'; it is then displayed by the light gray horizontal lines. If the user set band (fast or slow) returns into the range within a given period (breakout offset) then a signal will generate.
Built in Alerts (must be set up by user):
Bullish & Bearish Crossovers within the oversold and overbought ranges.
Bullish & Bearish Breakout alerts (beta)
Users can also set custom alerts. Example: Fast Band crossing up Value: 0.7
To gain access to this indicator please follow the link below.
Feel free to message me with any questions directly here on TradingView.

Up/Down Trend MarkerA simple indicator of trend by using 3 EMAs of multiplies of 2, 5 and 10, filtered by standard positive/negative directional movements (DM) which are the base of Average Directional Index (ADX).
The "Trend Strength" option is included to set the EMA multipliers and also the variation between DM+ and DM- which interpret the trend as a weak or a strong one.
Note that the markers only point to almost the beginning of the trends and just change the direction when the opposite trend is detected.
Feel free to send me your opinions.

ATR Vol Proxy CrossThis script is a simple ATR cross, where the short-term ATR helps quickly and easily determine whether volatility is "high" or "low" compared to the long-term ATR value. Both values are adjustable, but initially calibrated for the daily chart.

ATR COG (Joy Bangla)Notes:
Black crosses indicate squeeze. It means an impending move once squeeze is released
Price tends to go from red dot to green dot to red dot to green dot to red dot in an endless cycle. We wait for the price bar to not touch the dots before we make a move
If the price goes between the dots and the lines, it means it is likely overheated/oversold respectively
If the price moves above the top line, it means the market is super overbought
If the price moves below the bottom line, it means the market is super oversold
This is an updated version 4 script from Lazy Bear's code as found from here
The update is there to ensure we can have alerts successfully set on Trading View

[CP]ATR Triple Stop Loss LevelsATR based Triple Stop Loss levels that are plotted on the chart (like moving averages!).
With ATR Levels plotted on the price chart itself, you can better set your volatility based trailing Stop Loss.
Also helps to define the SL when making an entry into a stock.
Note:
This indicator is supposed to be used on Daily and Weekly Charts.
For other timeframes you would need to tweek the default parameters.

Trends & RangesTrends & Ranges uses EMA ATR bands as a SuperTrend indicator.
How to use:
This indicator can be used to give you a direction bias, with the added function to create ranges which often lead to reversals or flat trading periods. Trade the break-out or wait for pull backs in the direction of the trend.
I'm not great at explaining stuff and will probably make things only more complicated, so I won't bother for now,
but if you have a question on how the script works I will gladly give it a try.
The option "Flexible Trends" will disable the min/max function (trailing or non trailing).
Flexible Trends enabled:
Flexible Trends disabled:
Settings are not optimized for any asset or time frame, you will have to do that for yourself. Feel free to share them in the comments.
Thanks for showing interest, enjoy and good luck! :)

[HM] HORIZONTAL GRID ROUNDED (VOLATILITY BASED)The purpose of this indicator is to draw a horizontal grid having in mind:
- rounded price levels instead tradingview standard grid, zoom-based;
- calculated by volatility, using daily ATR;
- independent of timeframe in use, locked to DAILY calculations.
Further improvements are intended.
Wish this could be useful. Any questions, feel free to comment.
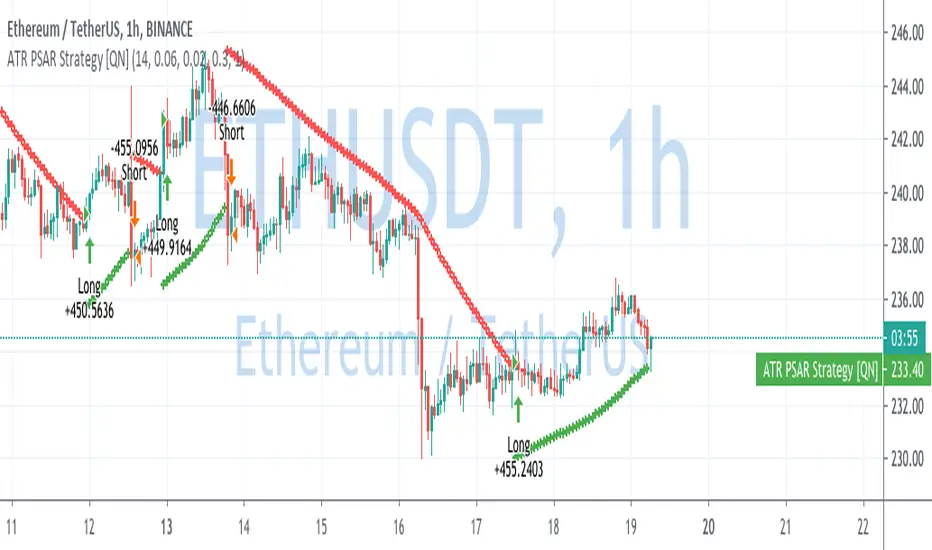
ATR Parabolic SAR Strategy [QuantNomad]I created a version of Parabolic SAR when I accelerate it not based on the difference from the extreme point but based on current ATR. So the idea is that for a more volatile market it should move faster.
Performance is calculated based on 25% equity invested and 0.1% commission.
What do you think about it? Does it make sense to do something like that?
Do you have in mind other ways I can accelerate it when the market starts to be more volatile?
Disclaimer
Please remember that past performance may not be indicative of future results.
Due to various factors, including changing market conditions, the strategy may no longer perform as good as in historical backtesting.
This post and the script don’t provide any financial advice.
Trending True RangeDisplay a smoothed true range during trending markets, thus filtering any measurement occurring during ranging markets. Whether the market is trending or ranging is determined by the position of the efficiency ratio relative to its Wilder moving average.
Settings
Resolution : resolution of the indicator
Length : period of the efficiency ratio and the Wilder moving averages used in the script
Usage
If you are not interested in volatility during ranging markets, this indicator might result useful to you. An interesting aspect is that it both measures volatility, but also determine whether the market is trending or ranging, with a zero value indicating a ranging market.
Indicator against Atr, with both length = 14, our indicator might be easier to interpret.
Note
Thx to my twitter followers for their suggestions regarding this indicator. I apologize if it's a bit short, the original code was longer and included more options, but forcing a script to be lengthy is a really bad idea, so I stayed with something less flashy but certainly more practical, "classic Grover" some might say.
Thx for reading!
ATR Take Profit bandsSimple ATR-scaled levels or bands of suggested price to take profit on directional trades.

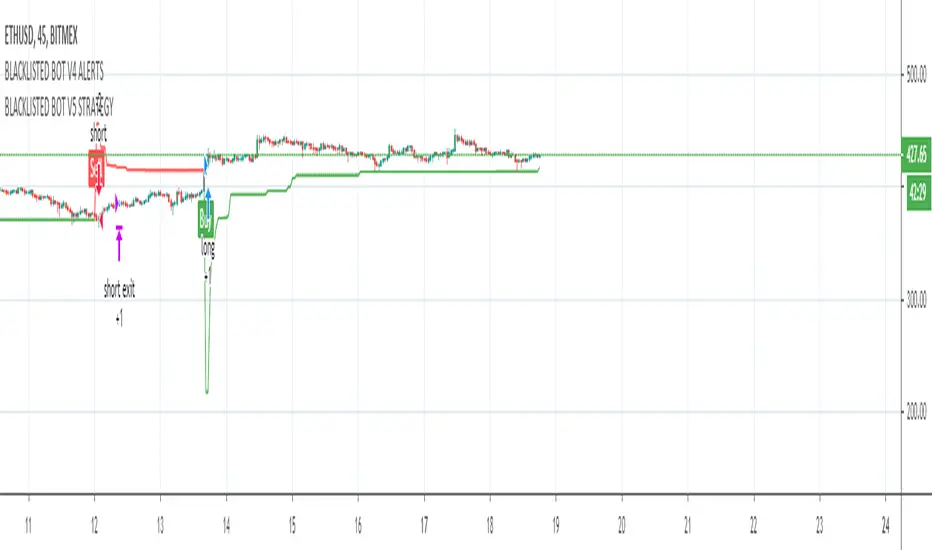
BLACKLISTED BOT V3 STRATEGYStudy used for the Blacklisted Trading Bot
This script uses a variation of ATR and Moving averages giving an alert for a fully automated trading solution.
Fine tuned parameters vary per coin which will be provided for the user after permission is granted.
To gain access to this strategy feel free to contact me directly using a private message.
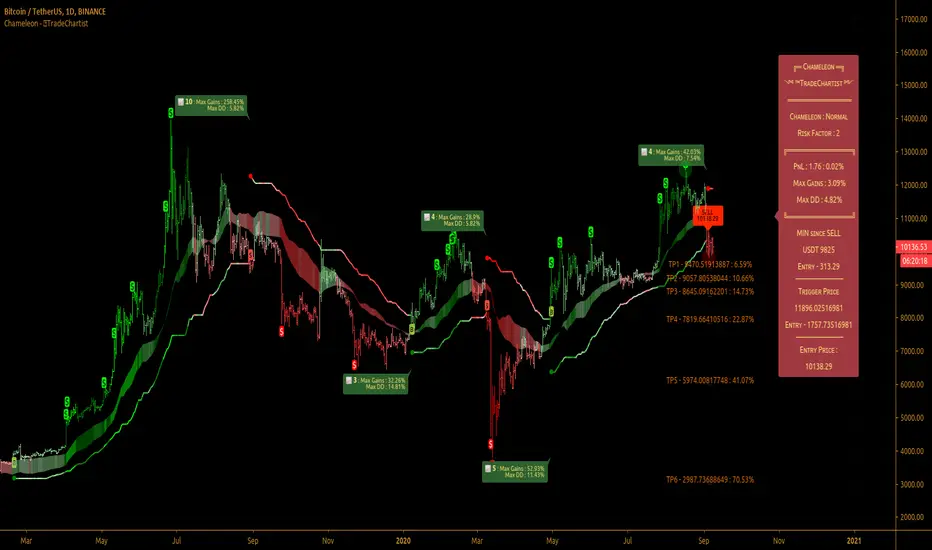
TradeChartist Chameleon™TradeChartist Chameleon is an exceptionally beautiful trend following indicator (visualised using Chameleon plot) based on Momentum and Volatility using User input of Chameleon Mode and Risk factor (ATR multiple) to generate Trade Opportunities.
===================================================================================================================
™TradeChartist Chameleon Features
Minimal user input of Chameleon Mode Selection from (Aggressive, Normal and Laid Back) and Chameleon Risk Factor (Min - 1, Max - 5 of ATR Multiple).
---> For Higher Timeframes, lower Risk Factor is recommended (Max - 3) as the trading range can be high based on Volatility.
---> For Lower Timeframes, higher Risk Factor can be used (Normal or Laid Back Mode) based on asset price volatility.
Comprehensive Chameleon Dashboard with useful information like Real-time Gains Tracker , User settings and general trade information. Dashboard can be customised based on user preference from Chameleon Settings.
Automatic Targets based on Trade.
Option to paint Price Bars to help identify Price Trend.
Option to display Profit Taking Bars (enabling this from settings will paint $ signs where Profit taking is recommended).
Option to color background based on trade type.
Alerts can be created for Long and Short Entry Signals using "Once per Bar" as Trade Entries are generated only upon confirmation (previous candle close below/above Chameleon Trigger line).
===================================================================================================================
How to create Alerts for ™TradeChartist Chameleon Long and Short Entries?
Alerts can be created for Long or Short entries using Once Per Bar as BUY and SELL labels appear with entries only on confirmation after bar close.
Does the indicator include Stop Loss and Take Profit plots?
This script doesn't have Stop Loss and Take Profit plots, but it can be connected to ™TradeChartist Plug and Trade as Oscillatory signal (" Chameleon ") to set StopLoss and Take Profit plots and to create all types of alerts too.
Does this indicator repaint?
No. This script doesn't repaint as it confirms its signals only after close above/below Chameleon Trigger line and also uses security function to call higher time-frame values in the right way to avoid repainting. This can be verified using Bar Replay to check if the plots and fills stay in the same bar in real time as the Bar Replay.
===================================================================================================================
Best Practice: Test with different settings first using Paper Trades before trading with real money
===================================================================================================================
This is not a free to use indicator. Get in touch with me (PM me directly if you would like trial access to test the indicator)
Premium Scripts - Trial access and Information
Trial access offered on all Premium scripts.
PM me directly to request trial access to the scripts or for more information.
===================================================================================================================
TradeChartist MTF Supertrend Pro™TradeChartist MTF SuperTrend Pro is the Multi Time-Frame version (using timeframe multiplier) of classic Volatility Stop or SuperTrend (Stop and Reverse indicator using multiple of Average True Range of lookback period trailing behind the price acting as both trend reversal signifier and StopLoss trigger at the same time ).
What does ™TradeChartist MTF SuperTrend Pro include?
Multi Time-Frame option using Time-Frame Multiplier to plot Higher Time Frame SuperTrend plot on Lower Time-Frame chart.
Auto-fibs - 2 types (1. Retracement from last significant high/low to previous significant low/high, 2. Retracement from Current High/Low to previous significant Low/High).
Trend identifying color bars.
Trend identifying Background colour.
Option to detect bars where Profit Taking is recommended using $ sign.
How to create Alerts for ™TradeChartist MTF SuperTrend Pro Long and Short Entries?
Alerts can be created for Long or Short entries using Once Per Bar as BUY and SELL labels appear with entries only on confirmation after bar close.
Does the indicator include Stop Loss and Take Profit plots?
This script doesn't have Stop Loss and Take Profit plots, but it can be connected to TradeChartist Plug and Trade as Non-Oscillatory signal to generate Automatic Targets, user set StopLoss and Take Profit plots and to create all types of alerts too.
Does this indicator repaint?
No. This script doesn't repaint as it confirms its signals only after close above/below SuperTrend plot and also uses security function to call higher time-frame values in the right way to avoid repainting. This can be verified using Bar Replay to check if the plots and fills stay in the same bar in real time as the Bar Replay.
===================================================================================================================
Tip 1: Using 1.618 as Timeframe Multiplier results in lucrative trades on most timeframes with ATR multiplier 1.618, 2.618 or 3.618. (Best Practice: Test with various values first on asset using Paper Trades before trading with real money)
Tip 2: Using bars, candles with no borders or Hollow Candles results in clear trend spotting with Bar color option enabled in settings.
===================================================================================================================
Chart below shows Performance of MTF SuperTrend Pro connected to Plug and Trade using Default settings.
===================================================================================================================
This is not a free to use indicator. Get in touch with me (PM me directly if you would like trial access to test the indicator)
Premium Scripts - Trial access and Information
Trial access offered on all Premium scripts.
PM me directly to request trial access to the scripts or for more information.
===================================================================================================================
SwingArm ATR Trend IndicatorThe general idea of using SwingArms is to provide a visual confirmation of a trend change.
Green for bullish (BUY)
Red for bearish (SELL)
A color-coded system providing an easy way for a novice to understand.
Converted to TradingView based on the work of Jose Azcarate.
I hope you guys enjoy.
Trailing Stop LossTrailing stop loss indicator to determine when to exit a position.
Multiple trailing stop loss calculation techniques are implemented:
ATR: Determines stop loss using a gap from recent highest value, that gap is defined by the ATR value and a multiplier
MA: Just a simple moving average used as a stop-loss
Percentage: Uses a percentage of the price
The script also implements alerting to be notified when the stop loss price is reached.

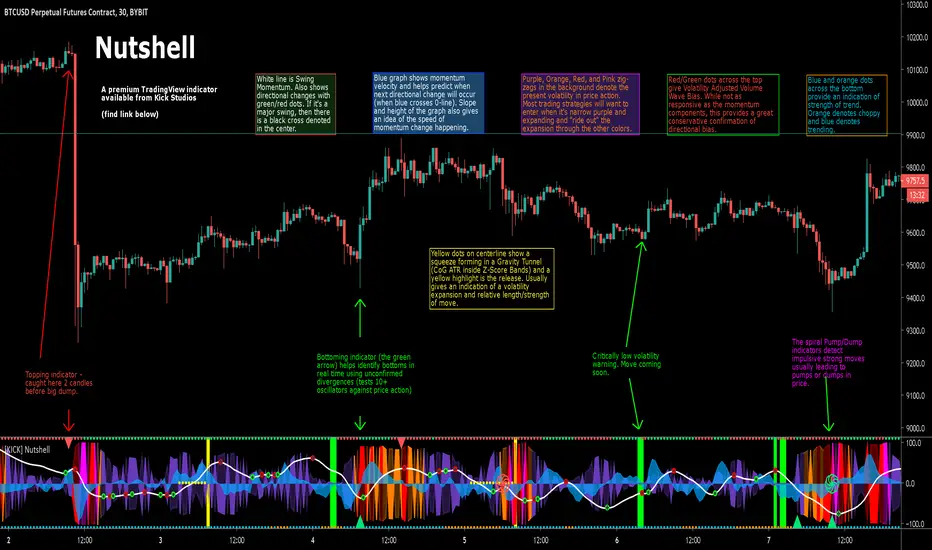
[KICK] NutshellThe Nutshell indicator gives you a true read of the market at quick glance – “in a nutshell”. The indicator contains components for volatility, momentum, trend strength, volume flow, price divergence detection, and impulsive move detection. This allows you to discern improved entry and exit points and accommodates many trading styles, systems, and strategies. It will work with most instruments and timeframes (though a few of the components do require volume, so some things like indexes won't work). The specific components of the indicator are:
Price action volatility indicator (the background zig-zags that are purple, orange, red, and pink). We are using a percentile ranking of ATR which gives a broader picture of the price volatility intra-bar than something like historical volatility percentile because it encompasses the range of price action and not simply the close of each bar. It is typically best to enter trades in the purple zone and “ride them out” through the higher volatility intervals.
Low volatility warning indicator (the bright green background highlights). When the ATR-PR is critically low, that means price volatility can only go on way (expand). These warnings are key to volatility strategies where knowing large moves are imminent is critical. While these warnings do not indicate the direction of the imminent move, there are plenty of other directional indicators present.
Gravity Tunnel Squeeze indicator (the yellow dots down the center-line, culminating in a yellow background highlight upon release). This is a slightly different take on the Momentum Squeeze indicator. In the traditional implementation a squeeze occurs when Keltner Channels move inside Bollinger Bands. In our implementation we use the Center of Gravity as a basis and measure when the Z-Score Deviation moves inside an ATR multiple. At the point of release you typically see an expansion of volatility, though often the signal presents earlier than an ATR-PR expansion. The longer the price action was under the squeeze the longer/farther the released price action is likely to go.
Swing Momentum indicator (white line with various red/green dots on it). The swing momentum indicator uses stochastic oscillators in the style of the ever-popular “Wave Trend” indicator to give a responsive read on the price action momentum. Green and Red dots indicate a change in direction of the momentum and when these occur in the extreme the center of the dot will be a black cross. Usually these extreme direction changes denote larger trend changes.
Momentum velocity indicator (blue area fill). This indicator can be used with the swing momentum line to determine how close/far the next direction change is away (every time the blue line crosses the zero-line a direction change occurs). The steeper the slope of this line also gives an indication of how fast the swing momentum is accelerating or decelerating.
Volatility Adjusted Volume Waves (the red/green dots across the top of the indicator) denote the current direction of price action based on cumulative volume weighted based on the ATR of the associated price action. While they are slower to respond than some of the other directional momentum components of this indicator, they can be treated as a pretty strong (conservative) confirmation of trend direction.
Strength of Trend (the blue/orange dots across the bottom of the indicator) is indicated with a Leaf-West variant of the ADX. Basically, if you see orange the price action is considered choppy and if it’s blue it’s trending. Depending on your time frame you can interpret these a bit differently. On smaller time frames you might consider the orange areas no-trade zones and wait until it turns blue.
Topping or Bottoming moves (Red triangles at the top or Green triangles at the bottom). We use a series of methods to detect likely reversal points (including checks for 10+ oscillator/price divergences). Since divergence is only confirmed after new local price highs/lows are established these reversal points won’t always be accurate, but we want to provide the earliest warning possible. Keep this in mind when taking action on them and wait a few bars for confirmation to be more conservative.
Pump and Dump warnings (red/green spirals that appear in the center of the indicator). Using 3rd generation moving average stochastics we get a very sensitive read on when they form patterns that typically precede large price action movements. These patterns work better for some markets than others so you will have to test with your instrument and timeframe to see how accurate they are for you. If you get one of these in conjunction with a red/green triangle and/or just after a low volatility or GT-Sqz release highlight, then buckle up.
The indicator also includes a number of custom alert conditions (all related to the above indicator components) that can be used to create alerts.
Use the link below to watch a tutorial video, request a trial, or purchase for access.