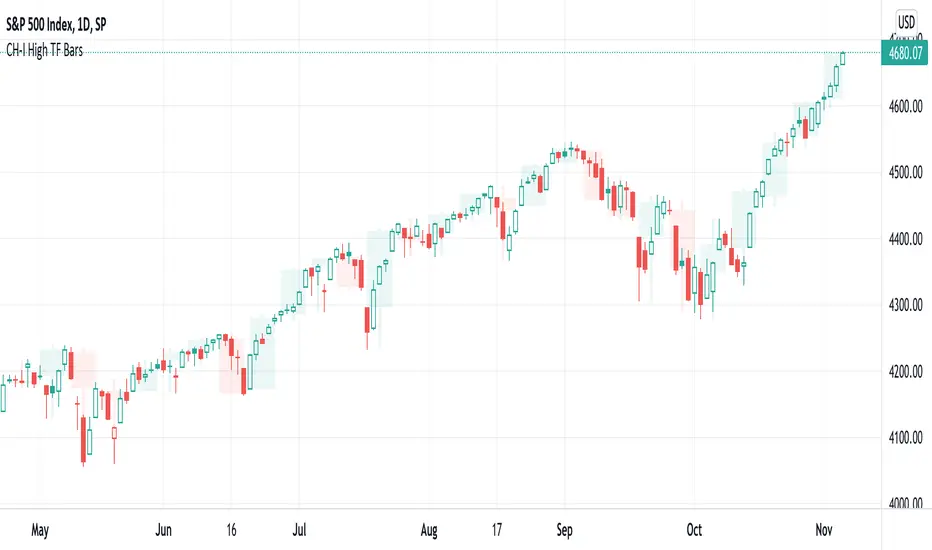
CH-I: Trend - Higher Timeframe BodyI took the script for the built-in indicator for candle bodies of a higher timeframe (www.tradingview.com) which has a fixed border width and style and added the possibility to customize both the border width and the border style or to even disable the display of any border at all, which makes the presentation of those boxes more flexible.
Ashi
True BarcolorHeikin Ashi can be useful for understanding trend based on price action but it doesn't take volume in context. Here I have tried to use volume for understanding true bar color and ultimately true trend analysis. It can also help you in not getting trapped in sudden shakeouts. Also, you can use it for averaging of your existing position.
Conditions used:
Relative closing price
Relative volume against previous bar and overall moving average of volume
Volume analysis
Trend analysis

Classic Candlestick on Range ChartHello traders!
This is my first script to share with everyone! As of right now the range candles on Tradingview are lacking the option to see range charts using the classic candlesticks. This script allows you to overlay a regular candlestick or heikin-ashi candlestick on a range chart!! Unfortunately, the only bar that cannot be a candlestick is the current bar. Once that bar has completed its range then it will update to a regular candlestick.
Install / Use instructions!
-For the best visual appearance it is important to set the transparency of up bars and down bars to 0. This setting is found in the main chart settings under SYMBOL. However, if you want to see the current unfinished range bar you need to set the "projection up bars" and "projection down bars" to the color you prefer.
-To change the colors of the candlesticks is found under the indicator settings like any other script!

HA,Renko, Linebreak,Kagi and Average all Charts Layouts in One This is an educational study, using the security functions provided by @PineCoders(big thanks to them for creating this ) in order to see the difference between multiple candle close plots using:
Heikin Ashi
Renko
Linebreak
Kagi
Average of them all.
Both the different securities and the average can be used as a source for different indicators like moving averages or oscillators getting with them some new and unique opportunities.
If you have any questions, let me know !

[TVExtBot]Heikinashi Upswing Strategy(30m&1h&2h)The Heikin-Ashi Upswing Strategy is a trend-following strategy suitable for short-term trading that utilizes Heikin-Ashi to follow an upward trend and realizes profits only in a rising market.
하이킨아시 업스윙 전략은 하이킨아시를 활용하여 상승하는 추세를 따라가며 상승장에서만 수익을 실현하는 단기매매에 적합한 추세추종 전략입니다.
* Buy Signal
The close price of the Heikin-Ashi candle was higher than the open price, and a golden cross occurred in the short-term EMA.
하이킨아시 캔들의 종가가 시가보다 크고 단기 EMA에 골든클로스가 발생.
* Sell Signal
The open price of the Heikin-Ashi candle is higher than the close price, the short-term EMA is dead cross, and overbought occurs.
하이킨아시 캔들의 시가가 종가보다 크고 단기 EMA가 데드클로스이고 과매수가 발생.
※Long만 사용가능한 전략입니다.(This is a strategy that only Long can use.)
Default Options(기본설정)
Short-Term Volatility (단기변동성) : 96 (※1)
Long-Term Volatility (장기변동성) : 97 (※1)
Take Profit (%) (익절) : 15%
Trailing Stop(%) (트레일링 스탑) : 10%
(※1) The lower the value, the more aggressive the buy.(값이 낮을수록 매수가 공격적입니다.)

Heikin Ashi Cloud overlayThis script displays a cloud representing the bodies of Heikin Ashi candles, which allows to have all the information of the HA technique without losing focus on the classical candles.
Also has arrows to indicate a trend reversal (counterproductive in a range !)
Heat Zone Relative Volatility Index 2.0v2 of Heat Zone RVI
• Updated aesthetics and added various alerts.
• The use of temperature descriptions with these Heat Zone scripts is more so metaphoric of the interpretations from what the RVI attempts to indicate primarily.
--- Due to the additions of the Overheated and Freezing Zones , the indicator-pane scaling is a little different from the original Heat Zone RVI .
Ex.)
--- If you like the scaling the way it was on v1, you can change it back by going into the settings , opening up the style page, and unchecking/turning off the Overheated Top Line as well as the Freezing Bottom Line . Otherwise, you can leave the settings be in regards to this matter.
Ex.)
Disclaimer : I am by no means a highly skilled or professional coder/programmer. I just enjoy dabbling and tinkering every now and again.
HOPE YOU ENJOY

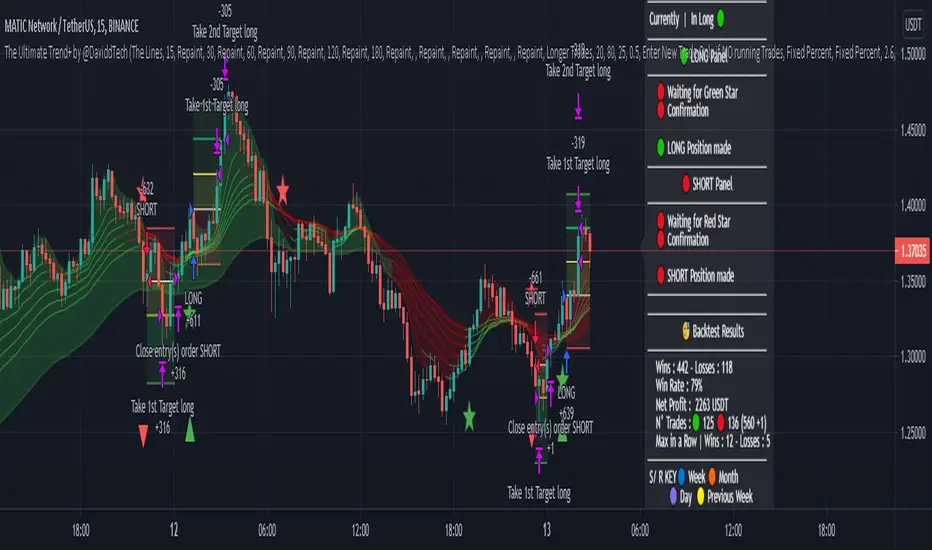
Multi Time Frame Heiken Ashi Candles by @DaviddTechMulti Time Frame Heiken Ashi Candles Visual Strategy.
Inspired by a video on YouTube by TradePro I decided to backtest this strategy.
The Strategy : This strategy waits for all the lines to cross green or red to look for a an entry.
It seems to give good results on the 15 minute timeframe.
1. The Cloud - Confirmed with no repainting.
2. The Lines may repaint as the price movement changes.
Confluence with the RSI STOCHASTIC.
If you use the RSI STOCHASTIC you have 2 options.
1. Super Scalper - Where the strategy will enter on every cross <> the two levels.
2. Longer positions - One entry is made where the RSI STOCHASTIC the closest to the GREEN/RED Star.
WARNING:
- For purpose educate only
- Plots EMAs and other values on chart.
- This script to change bars colors.
Ichimoku + RSI Crypto trending strategyThis is a crypto trending strategy designed for big timeframes such as 3-4h+.
Its components are:
RSI
ICHIMOKU full pack
Heikin Ashi candles for logic calculation inside
Rules for entry.
For long : we have a long cross condition on ichimoku and price is above the ichimoku lines, and at the same time RSI value is > 50.
For long : we have a short cross condition on ichimoku and price is below the ichimoku lines, and at the same time RSI value is < 50.
Rules for exit
We exit whenever we receive an opposite signal of the initial entry.
SInce this strategy is using no risk management inside, I recommend to be careful with it .
If you have any questions, let me know !

Multi TimeFrame (MTF) Trend StrengthCalculate and display simple multi timeframe (3 timeframe) trend strength using heikin ashi.

MTF Heiken Ashi (No Repaint)Hi there. This indicator is inspired by Heiken Ashi MTF (by @jdmonto0).
The problem with that indicator was that it repaints and I tried to solve that.
I figured that the reason the other version repaints was because the heiken ashio calculation is based on the close of the candle, and since the higher timeframe candle hasn't closed yet, the value of previous candles on a lower timeframe can change.
This version bases the calculation on the previous bar, which solves the repainting problem.
Please tell me what you think about it.
HPT - Heikin-Ashi Price ToolThis overlay study can be used with an Heikin-Ashi chart and diplays the real prices for Heikin-Ashi candles as circles for each bar. If the real closing price of the bar is higher then the opening price, the circle has a green color, otherwise it is red.
Here you can see the overlay : COINBASE:BTCUSD
The follwing moving averages are added to the chart as well: SMA 20, 50, 200 and EMA 8 (for analyzing trend and support/resistance ). A background fill can be activated for the overall trend.
I recommend to lower the opacity for the bars so that you can better see the circles for the real prices.
Heikin Ashi Candle OverlayHello Friend,
This is a very simple script for fun to demonstrate the new ability to change the colors of attributes pertaining to the plotbar() and plotcandle() functions using series inputs.
For Heiken Ashi lovers, this script does several things. It gives you both bars and hollow candles with Heikin Ashi values - something TV does not currently support.
It also gives you the ability to see your favorite HA candles while on the main series plot. When viewing indicators in the "Heikin Ashi" candle setting on TradingView, the input values are "smoothed' with HA values. This skews the way your indicators behave as the OLHC are calculated averages. Only the regular candle settings will give your indicators "real close" etc.
By 'Muting' the main series bars by toggling the 👁 symbol next to your ticker id, it makes the normal candles invisible. You then overlay this script, which allows you to see the HA Candle of your choice, while not affecting the way your indicators behave.
You now have the best of 2 worlds. Smoothed behavior of price action to help visualize trends, and accurate indicator values derived from actual OLHC data.
Plus, something about hollow HA candles is just kind of clean and soothing isn't it?
Cheers,
Bjorgum
Hollow Setting:
Bars
Or just plain old regular, but on the main chart

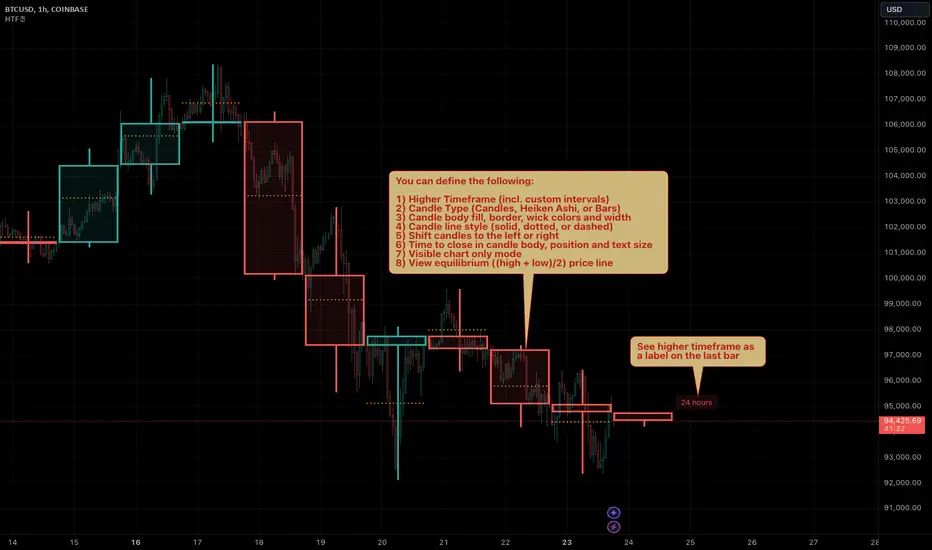
MTF CandleLevelsIn the spirit of freedom from oppression on this day of July 4th, 2021 in the United States, I hereby release this flagship indicator "MTF CandleLevels" into the wild for any subscribing TV member on the planet to utilize. It's now one my few great gifts to the souls of humankind within the realm of trading on TV. TradingView continues to bless Pine Script by releasing supplemental upgrades, enough for me to develop this indicator beyond it's experimental phase to full potential, as I had always wished to design it from theory. Educationally while using it, you will witness how OHLC/HA candles are actually formed for charts. I like to think of it as a candle formation microscope anyone can learn from.
It is intended for any style of trading or skill level from newcomer to advanced. There are no requirements/prerequisites for you use it. Which means you don't have to wear a mouth muzzle, get multiple doses of the life endangering FrankenJabs, subserviently bow down to authoritarian demands of obedience, or learn the ancient mystical art of deception "Fau Chi" in order to employ it's inherent power. A little sprinkle of satire helps with a dry technical read :). You have the absolute freedom to utilize it any way you see fit! That's right, it's even your choice whether you use it or not. The unshackled empowerment of choice always equates to FREEDOM. I can't program these precious gems without it...
One thing you will have noticed is it's specifically published on a Heikin Ashi(HA) chart, while having immunity to the Heikin Ashi candle charts unique open/close behavior. This has been believed to be an impossibility until now. For members who don't know, HA candle charts have a different `open` and `close` from the `open` and `close` of the other ordinary OHLC candle charts. Regardless of "CandleLevels Mode" chosen in Settings, the indicator will display identical on either bar chart type, excluding Renko, Line Break, Kagi, Point&Figure, and Range candle charts of course. It's abilities supersede the simpler "Multi-Time Period Charts" built-in TV indicator with a completely different architecture. For those of you extremely curious about how I accomplished this indicators level of code complexity, it was immensely difficult taking over a year of effort for this one functional unit, and I will leave it at that...
This novel MTF technology displays OHLC/HA support and resistance levels that mimic the functionality of larger duration candle formations in real time. Basically explained, while charting on a shorter duration timeframe candle chart, you can see open, high, low, and close levels fluctuate in the larger duration timeframe. This reduces the need to jump back and forth to view price action on different chart sampling intervals. You may even use multiple sets of CandleLevels indicators over a wide variety of chosen timeframe options, along with everything else in between.
The CandleLevels behavior is chosen within the indicator "Settings" using a selection mode of either the standard OHLC candlestick formations or Heikin Ashi candlestick formations. Each mode has a multitude of uses depending on the users trading style or timeframe.
Visbility of CandleLevels will ONLY occur when it is set to a larger duration timeframe interval than the current chart sampling rate. For example, you may be using the 5 minute interval sampling rate on the chart, yet you can easily see the open, high, low, close ranges with a chosen 120 minute timeframe setting. The multiple time frame(MTF) settings are highly adjustable having intervals of seconds, minutes, days, a multiple of the chart interval, or the common input(type=input.resolution) function provided by Pine.
CandleLevels come with multiple color schemes to reduce color interference with other indicators in the overlay pane, including the intended use of multiple sets of CandleLevels. My basic color scheme selections can be overridden to choose any imaginable color you desire for your visual acuity. Also, there are additional controls available to fine tune a visually pleasing appearance depending on your preferences and viewable area. One last new hidden fine tune capability, not only for this indicator but all TV indicators, is the agility to use up/down arrow keys on the keyboard when an indicator setting is in focus after mouse selection. For example, when choosing line thickness, you can modify values/options by key stroke. Try it out, I'm sure you will find this useful for any indictor for eternity.
NOTICE: There is only 500 line drawings available, in total to display, at this current release. This equates to 83 sets of CandleLevels maximum.
Features List Includes:
Candle type selection
MTF controls for seconds, minutes, days, multiple-of, and TV input
Multiple color schemes with color overrides
Color opacity selector
Line thickness control
Enable/disable capable MTF interval display with positioning
When available time provides itself, I will consider your inquiries, thoughts, and concepts presented below in the comments section, should you have any questions or comments regarding this indicator. When my indicators achieve more prevalent use by TV members, I may implement more ideas when they present themselves as worthy additions. Have a profitable future everyone!
RISK DISCLAIMER:
My scripts, indicators, and studies are specifically intended for informational and educational use only. These use historical data points to perform calculations to derive real-time calculations. They do not infer, indicate, or guarantee future results or performance.
By utilizing this script/indicator/study or any portion of it, you agree to accept 100% responsibly and liability for your investment or financial decisions, and I will not be held liable for your subjective analytic interpretations incurring sustained monetary losses. The opinions and information visual or otherwise provided by this script/indicator is not investment advice, nor does it constitute recommendation.

HTF Candles by Prosum SolutionsOverview of Features
This indicator was inspired by the work of "informanerd" in the script called "HTF Candles" as well as the built-in script called "Multi-Time Period Charts" by TradingView. The script will provide a highly customizable interface to specify the higher timeframe resolution for the candlesticks, the type of candle, as well as various styling options for the body, borders and wicks.
Usage Information
The indicator can be applied to any chart at any time frame, but resolutions less than 1 minute may demonstrate gaps between bars and the candles may not render properly.
When the "Same as chart" option is chosen for the "Resolution" field, the indicator will attempt to find a higher timeframe resolution to ensure the candlesticks are drawn.
Enjoy! 👍
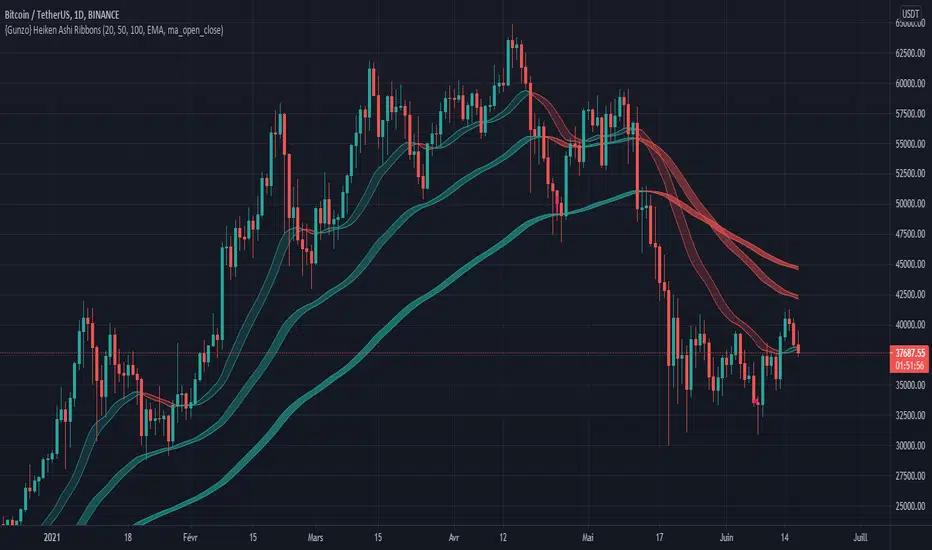
{Gunzo} Heiken Ashi RibbonsHeiken Ashi Ribbons is a trend-following indicator which gives entry and exit points for short-term, medium-term and long term trading (using Exponential Moving Averages and Heiken Ashi formulas).
OVERVIEW :
The Heiken Ashi Ribbons indicator is composed of 3 moving average ribbons (slow, normal and fast) that are computed using the Heiken Ashi formulas. The 3 ribbons give a clear vision of the current trend as they use moving averages that smooth out the price and filter noise from short term fluctuations. In a simplified way, you can consider each ribbon as a moving average with a larger body size.
If the price is above the slow ribbon, we consider the asset as trending up in the short term (trending down otherwise). If the price is above the fast ribbon, we consider the asset as trending up in the long term (trending down otherwise).
CALCULATION :
First of all, to compute a ribbon for this indicator we calculate a moving average (EMA by default) for common sources (OHLC) :
EMA (open), EMA (high), EMA (low), EMA (close)
We then apply the Heiken Ashi formulas to the moving averages calculated previously.
HA (open) = HA (open) previous + HA (close) previous
HA (close) = ( EMA (open) + EMA (high) + EMA (low) + EMA (close) ) / 4
HA (high) = max( EMA (open), EMA (close), EMA (high) )
HA (low) = min ( EMA (open), EMA (close), EMA (low) )
The ribbon displayed (by default) on the chart is the area between HA (open) and HA (close).
SETTINGS :
1st Moving average length : Length of the slow moving average
2nd Moving average length : Length of the normal moving average
3rd Moving average length : Length of the fast moving average
Moving average method : Moving average calculation method (EMA : Exponential Moving Average, SMA : Simple Moving Average, WMA : Weighted Moving Average)
Ribbon type : standard ribbon uses the area between HA (open) and HA (close). Large ribbon uses the area between HA (low) and HA (high)
Display ribbon as candles : change the type of visualization between area and candles
Display short term buy/sell signals : Display short term buy/sell signals (crosses) when the fast moving average and normal moving average are crossing
Display long term buy/sell signals : Display long buy/sell signals (circles) when the fast moving average and slow moving average are crossing
Display ribbon trending up signals : Display ribbon direction change (triangle up) when the trend of the ribbon changes to trending up
Display ribbon trending down signals : Display ribbon direction change (triangle down) when the trend of the ribbon changes to trending down
VISUALIZATIONS :
This indicator has 2 possible visualizations :
Ribbons : the ribbons can be considered as enhanced moving averages for trading purposes. They represent the area between the Heiken Ashi of the moving average of the open and closing price. The color of the moving average line is green when the ribbon is trending up and red when the ribbon is trending down.
Signals : Various signals can be displayed at the bottom of the chart (Buy/Sell signals, Ribbon direction changes signals).
USAGE :
This indicator can be used in many strategies, just like when you are using multiple moving averages. You should test these strategies and use the one that best fits your trading style.
Strategy based on crossovers :
When the fast ribbon crosses above the normal ribbon, it is a short term buy signal (it is recommended to wait for a confirmation)
When the fast ribbon crosses under the normal ribbon, it is a short term sell signal (it is recommended to wait for a confirmation)
When the fast ribbon crosses above the slow ribbon, it is a long term buy signal
When the fast ribbon crosses over the slow ribbon, it is a long term buy signal
Strategy based on price position :
When the prices closes above the ribbon, it is a buy signal (long term if above slow ribbon, short term if above fast ribbon)
When the prices closes below the ribbon, it is a sell signal (long term if below slow ribbon, short term if below fast ribbon)
Strategy based on price bouncing :
When the price decreases and reaches the green long term ribbon, the price candles may not be able to cross the ribbon. If the price increases, we consider that move as a bounce on the ribbon, which is a buy signal
When the price increases and reaches a red long term ribbon, the price candles may not be able to cross the ribbon. If the price decreases, we consider that move as a bounce on the ribbon, which is a sell signal
Strategy based on ribbon direction :
When the direction of the ribbon changes, the trend of the asset is changing which may lead to a crossover to the next candles if the trend is continuing in that direction (it is recommended to validate the entry points with a second indicator as this strategy may have some false signals).
Awesome Heikin Ashi [Morty]This indicator uses Heikin Ashi candles and two EMAs to help you follow the trend and enter the trade. Heikin Ashi candles help to smooth the price and EMAs are used to detect trend. The default parameter of EMA is EMA10 and EMA20. You can use it at any timeframe. You should always adjust the EMA length according to different timeframes.
Features:
- Highlight background based on two EMAs
- Adjustable EMA length
- Adjustable Label size
- Show entry and exit signal labels
- Show stoploss price
- You can choose Long only or Short only or both signals
- Alert functions for notification
NOTE: If you use this signal to enter a trade, make sure the candle is close and enter in the next candle.

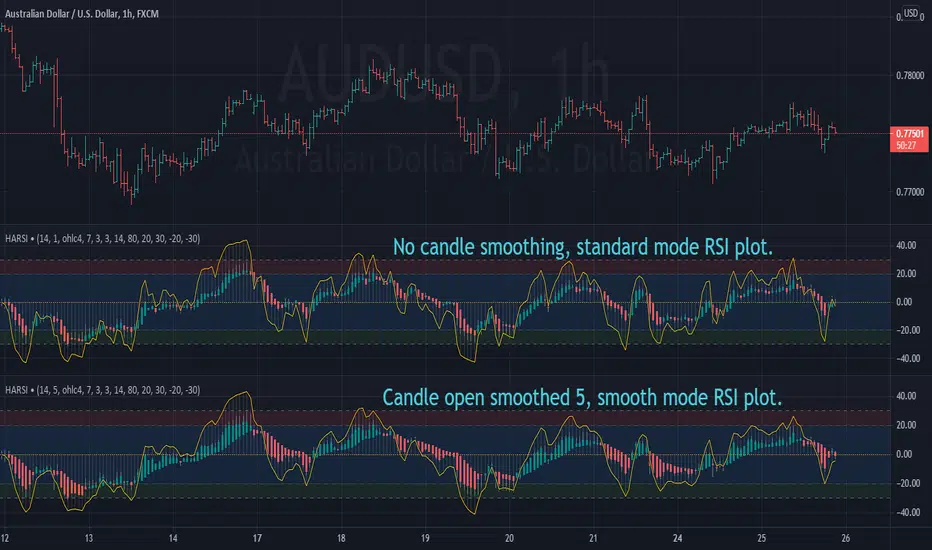
Heikin Ashi RSI OscillatorIntroducing HARSI - the RSI based Heikin Ashi candle oscillator.
...that's right, you read it correctly. This is Heikin Ashi candles in an oscillator
format derived from RSI calculations, aimed at smoothing out some of the
inherent noise seen with standard RSI indicators.
Science!
We likes it we does.
Included plot options for standard RSI plot overlay, and a smoothed variant with
it's own seperate length from the candles, oh and histogram option, for reasons.
Articles and further reading:
investopedia.com - RSI
investopedia.com - Heikin Ashi
This is a REALTIME indicator, so any values used for conditions should use
history 1, or alternatively, alerts should be called using once-per-bar-close.
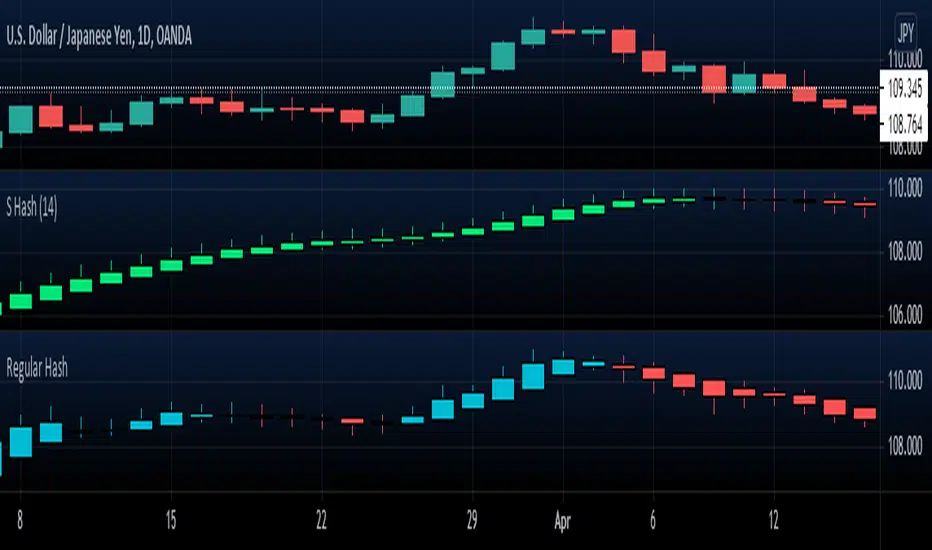
Smoothed Heiken AshiHeiken Ashi with price values smoothed via 14-EMA .
On the example chart you can compare it to a regular Hash using blue for upward trends
NSDT Heiken-Ashi Direction Bar MTFA simple script that places a bar at the bottom of the chart to indicate the direction of Heiken-Ashi candles - while still using traditional candles on the main chart. Try setting the bar on a higher timeframe to see the overall direction of the trend, while using traditional candles for entries/exits.
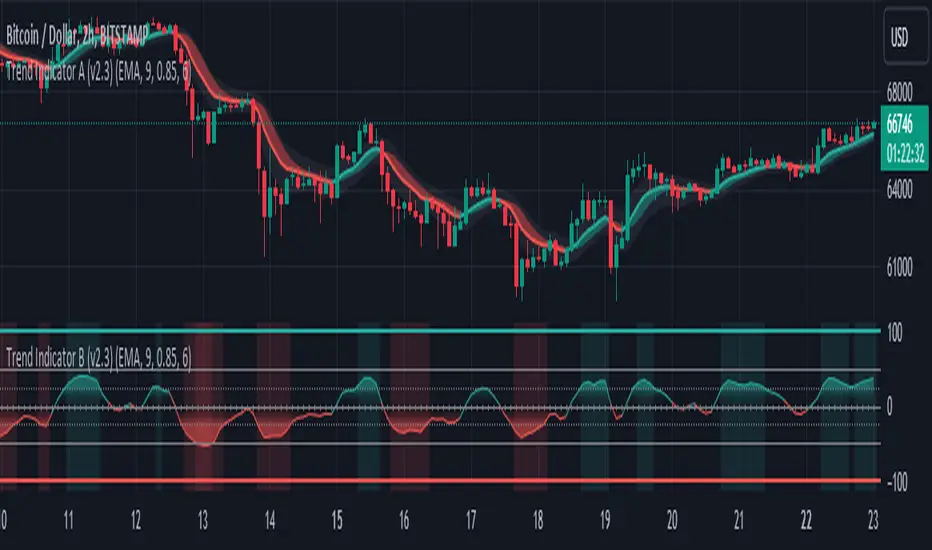
Trend Indicator A-V2 (Smoothed Heikin Ashi Cloud)"Trend Indicator A-V2" and "Trend Indicator B-V2" are updated and improved versions of my initial trend indicators. Totally rethinking the code, adding highs and lows in the calculations, including some more customisation through colour schemes.
In practice, this indicator uses EMAs and Heikin Ashi to provide an overall idea of the trend.
The "Trend Indicator A-V2" is an overlay showing “Smoothed Heikin Ashi” .
The "Trend Indicator B-V2" uses the same values in a different way to measure the momentum of the trend and identify potential trend rejections.
Please, take into account that it is a lagging indicator.

Trend Indicator B-V2 (Momentum measuring)"Trend Indicator A-V2" and "Trend Indicator B-V2" are updated and improved versions of my initial trend indicators. Totally rethinking the code, adding highs and lows in the calculations, including some more customisation through colour schemes.
In practice, this indicator uses EMAs and Heikin Ashi to provide an overall idea of the trend.
The "Trend Indicator A-V2" is an overlay showing “Smoothed Heikin Ashi” .
The "Trend Indicator B-V2" uses the same values in a different way to measure the momentum of the trend and identify potential trend rejections.
Please, take into account that it is a lagging indicator.
Crack_Heiken_Open_Ver_1.0.0
Hello dear traders from all over the world!
Our team recently have explored deeply in Heikin-Ashi Candlestick techniques and some of the benefits utilizing it. After multiple test phases figuring out the pros and cons, we derived some of the insightful strategies and developed it into an technical indicator that visualizes some of the major pivot levels deducted from Heikin-Ashi.
Unlike the common and conventional candlestick chart used widely by many traders these days, Heikin-Ashi candle chart applies different equations for computing the candle body (gap between open and close price). In fact, the close price is determined considering the open, high, low, and close prices of the original candlestick. This very method smooths out the price momentum by averaging out significant prices forming a candlestick. Many suggest one of the advantages of using Heikin-Ashi for traders as an efficient tool to filter out market noises during a liquidation.
These are the default formulas for Heikin-Ashi candlestick formation, where CO, CH, CL, and CC denote open, high, low and close price of the conventional candlestick, respectively. Similarly, HO, HH, HL, and HC denotes open, high, low and close price of the Heikin-Ashi candlestick.
HO = (Previous_HC + Previous_HO) / 2
HC = (CO + CH + CL + CC) / 4
HH = CH
HL = CL
Similar to the common technical chart, the Heikin-Ashi candlesticks are also to be observed and precepted as a complex structure, rather than a simple dimensional price movement. While this very methodology enables traders to objectively identify the strength of the market trends and trend reversal signals, it is yet quite weak during consolidation or accumulation phases. In other words, it is not so reliable when the market shows sideway moves usually before a big trend appears. Furthermore, the market noises in these days (especially in the post-COVID era) are not exactly like those in years ago. Unlike the old days, the liquidation cycle often happens so fast with wider range which led to certain unconventional phenomenon such as long candle wicks, whipsaws, stoploss hunting, and V-shaped patterns, etc. Therefore, we strongly recommend retail traders to not entirely depend only on the Heikin-Ashi when trading, but rather to consider it as one of the technical indicators that function as a side-aid to comprehend the trends.
This directly leads to introduction of the core logic of our new indicator that are assembled extracting useful strategies. This state-of-the-art mechanism shows multiple integral signals from the Heikin-Ashi. The color and the open price of the Heikin-Ashi candlesticks appear as dots on the regular chart. For those who are familiar using Heikin-Ashi will definitely find this useful
One of the important factors in Heikin-Ashi technique is to observe if the colors of the candle appear consecutively. Appearance of an opposite candle that breaks the continuity can be interpreted that the current trend is being weakened. Our indicator shows whether the Heikin-Ashi candles are formed as bullish or bearish and thus the traders can refer the trend signals given by the Heikin-Ashi candles. Series of consecutive colors means the trend is still progressing, until an opposite color appears. The default color for emergence of an opposite candle is orange. Hence, if an orange dot appears after series of the same color of dots, it can be signaled as a trend reversal.
Another efficient strategy is to search for the ‘Shaved Head(Bearish candle with no wick on top)’ and ‘Shaved Bottom(Bullish candle with no wick on bottom)’ patterns. Series of the shaved bottom candles indicates that the trend is bearish while that of shaved head indicates vice versa. In order for the candles to become shaved, the open price should not be broken (below for bullish candles and above for the bearish candles) during the formation of that very candle. This implies that the open price of the Heikin-Ashi candle (the middle of the previous candle body) acts as an important support or resistance.
Some of the decent strategies are summarized as below.
1. When the same color appears consecutively in a series, it means that the trend has started and the distances between the following dots represent the strength of the trend.
2. Similar to Parabolic SAR, the dots work as support and resistance. If the price breaks the dot, in other word if the dot fails to support or reject, be alerted as a weak signal for a trend reversal. (This implies that the Heikin-Ashi candle has failed to construct a shaved head or bottom)
3. If the orange dot appears after a clear and distinctive trend, interpret it as a medium signal for trend reversal. (This implies that the Heikin-Ashi candle has changed the color during on-going trend)
Weight more if one of these signals appear during a longer maintained trend. As mentioned, reliability highly drops when the market is in contraction and consolidation zone, when price is relatively moving sideways without a clear trend.
If you are interested in trying this indicator out, please comment or send direct message to this account.
안녕하세요. 트레이더 여러분 =)
예전과는 성향이 많이 변한 현대 금융 시장에서 하이킨 아시 차트의 적합성, 실용성, 그리고 응용성을 연구 및 고찰하던 저희 팀이 아주 유용한 지표를 개발했습니다. 하이킨 아시 캔들 차트를 보는 방법은 제가 어제 교육 자료로 정리해서 업로딩 해드렸으니 그 부분은 생략하겠습니다.
링크:
간략하게 정리를 해드리자면 하이킨 아시 차트는 진행중인 추세의 강도를 파악하거나 변곡점을 더 명확하게 보여주지만 횡보장에서는 신뢰성이 떨어진다는 치명적인 단점이 있습니다. 따라서 해당 차트를 일반 차트에서 효율적으로 참고할 수 있도록 저희가 하이킨 아시 기법을 활용해 도출한 주요 피봇 레벨들을 차트에 시각화해주는 지표를 개발했습니다.
지표를 매매전략에 활용할 수 있는 전략들은 다음과 같이 간추려볼 수 있겠습니다.
1. 동일한 색의 지표(점)들이 연속으로 형성이 된다면 (양봉 -> 양봉, 음봉 -> 음봉), 어느정도 추세가 시작되었다는 의미로 해석할 수 있고 각 점들 사이의 거리가 추세의 강도를 나타냅니다.
2. Parabolic SAR 지표와 유사하게 해당 지표는 지지와 저항의 역할을 합니다. 가격이 점을 돌파 및 이탈하면, 즉 지표가 가격을 지지/저항을 실패해 뚫리면 추세 변곡의 출현 여부를 처음으로 의심해볼 수 있는 시그널입니다. (점이 뚫렸다는 건 하이킨 아시 차트에서 캔들이 Shaved Candle을 형성하지 못했음을 뜻합니다.)
3. 명확한 추세가 어느정도 진행된 이후 주황색 점이 뜨면 추세 반전에 신호로 볼 수 있습니다. (하이킨 아시 캔들 색깔이 바뀐 상황입니다.)
더 오랜 기간 동안 유지되어온 추세일수록 중간에 위 시그널이 나타날 때 더 큰 의미를 부여할 수 있습니다. 앞서 언급했듯이 횡보장일 때, 명확한 추세가 나오지 않거나 횡보 변동폭이 크면 클수록 신뢰성이 크게 떨어질 수 있다는 점 항상 명심하세요.
해당 지표를 사용해보고 싶으신 분들은 댓글 혹은 메시지 보내주시면 되겠습니다~
다들 감사합니다. 성투하세요 =)
