OPEN-SOURCE SCRIPT
Actualizado MTF Previous Open/Close/Range

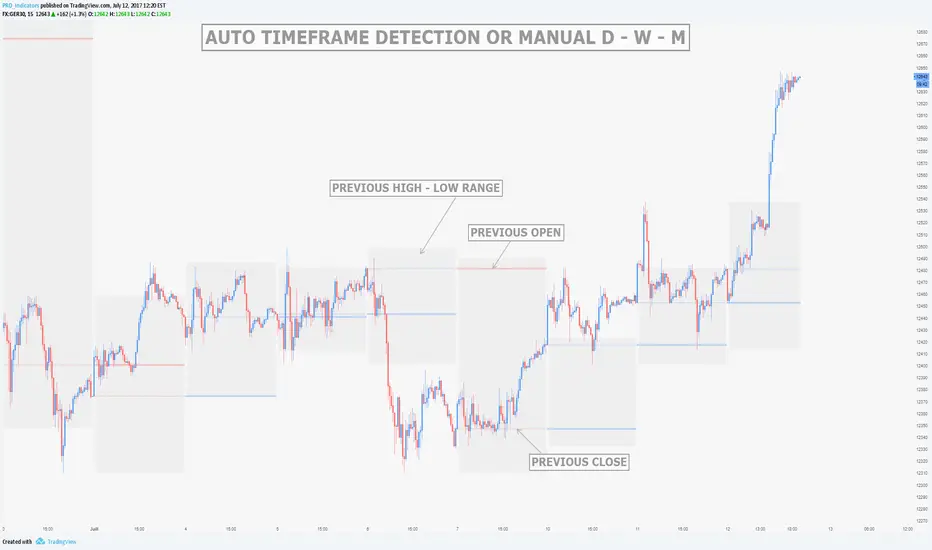
This indicator will simply plot on your chart the Daily/Weekly/Monthly previous candle levels.
The "Auto" mode will allow automatic adjustment of timeframe displayed according to your chart.
Otherwise you can select manually.
Indicator plots the open/close and colors the high-low range area in the background.
Hope this simple indicator will help you !
You can check my indicators via my TradingView's Profile : @PRO_Indicators
Notas de prensa
Added support for quarters and year timeframes. Added the optional plot of the 61% extension line (this extension generally acts like a support/resistance)
Notas de prensa
Added more timeframe options and a gap highlighting (can be desactivated)Script de código abierto
Fiel al espíritu de TradingView, el creador de este script lo ha convertido en código abierto, para que los traders puedan revisar y verificar su funcionalidad. ¡Enhorabuena al autor! Aunque puede utilizarlo de forma gratuita, recuerde que la republicación del código está sujeta a nuestras Normas internas.
To learn more about the PRO Strategy and request a trial for the indicators:
Website : pro-indicators.com
Discord : discord.gg/2mHQbEmb9P
Website : pro-indicators.com
Discord : discord.gg/2mHQbEmb9P
Exención de responsabilidad
La información y las publicaciones no constituyen, ni deben considerarse como asesoramiento o recomendaciones financieras, de inversión, de trading o de otro tipo proporcionadas o respaldadas por TradingView. Más información en Condiciones de uso.
Script de código abierto
Fiel al espíritu de TradingView, el creador de este script lo ha convertido en código abierto, para que los traders puedan revisar y verificar su funcionalidad. ¡Enhorabuena al autor! Aunque puede utilizarlo de forma gratuita, recuerde que la republicación del código está sujeta a nuestras Normas internas.
To learn more about the PRO Strategy and request a trial for the indicators:
Website : pro-indicators.com
Discord : discord.gg/2mHQbEmb9P
Website : pro-indicators.com
Discord : discord.gg/2mHQbEmb9P
Exención de responsabilidad
La información y las publicaciones no constituyen, ni deben considerarse como asesoramiento o recomendaciones financieras, de inversión, de trading o de otro tipo proporcionadas o respaldadas por TradingView. Más información en Condiciones de uso.