OPEN-SOURCE SCRIPT
Actualizado Day Week Month High & Low
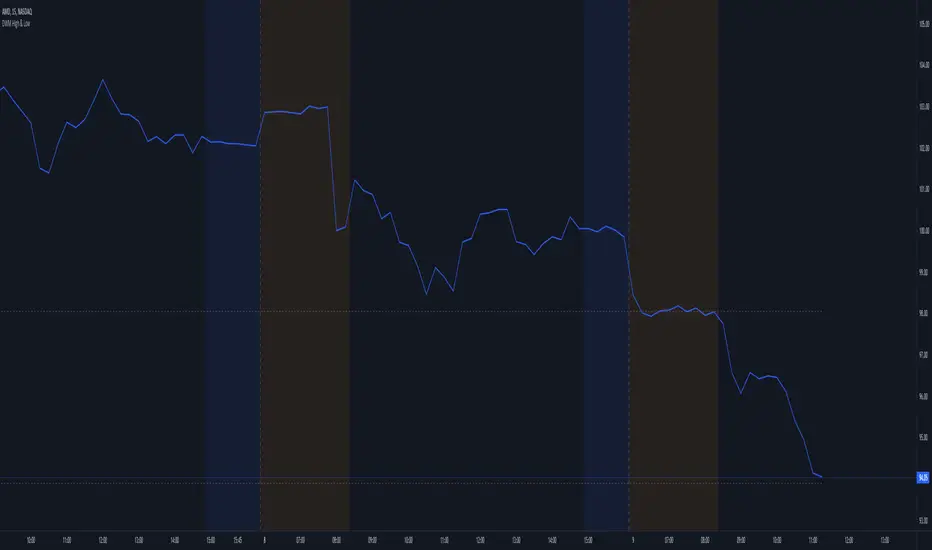
This is a small little script that helps visually mark the high and lows of the DAY, WEEK or MONTH (of your choosing). It's best when paired with my High and Low Fibonacci Pivot Points indicator to help emphasize the high and lows of the day, week or month.
Notas de prensa
Added a 2-Day high and low setting. This was added as an inquiry about a modification for a 2-Day high and low.Notas de prensa
Added some additional visual updates. I wasn't planning on releasing any additional updates, since I keep getting hit with infractions for my scripts being deemed as not original (although it's 100% my own work), nor not colorful/exciting to look at. Since, I've been receiving kind feedbacks from a user or two, I've released this update to the public.Updates Include:
- Allowing you to choose the line style (dashed, dotted or solid)
- Added an additional 1-Hour timeframe selection (for those who like to scalp with tight entries & stops)
- For those who set the timeframe to DAY, can choose to enable the lines to alternate to a different color, when the DAY high matches the WEEK high and the same is applied when the DAY low matches the WEEK low. This could be useful for those who swing trade on a weekly basis (i.e. open & close trades within the same week).
Script de código abierto
Fiel al espíritu de TradingView, el creador de este script lo ha convertido en código abierto, para que los traders puedan revisar y verificar su funcionalidad. ¡Enhorabuena al autor! Aunque puede utilizarlo de forma gratuita, recuerde que la republicación del código está sujeta a nuestras Normas internas.
Exención de responsabilidad
La información y las publicaciones no constituyen, ni deben considerarse como asesoramiento o recomendaciones financieras, de inversión, de trading o de otro tipo proporcionadas o respaldadas por TradingView. Más información en Condiciones de uso.