OPEN-SOURCE SCRIPT
Correlation Matrix
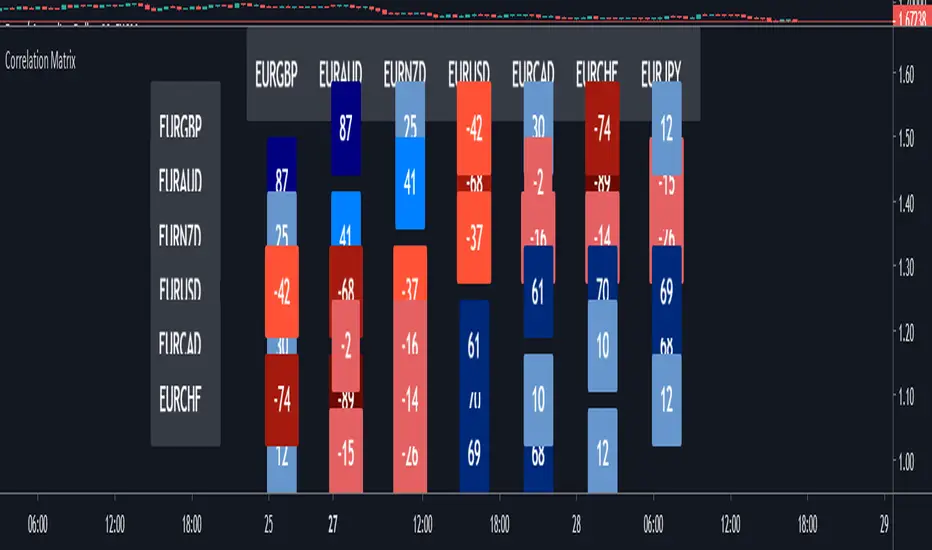
In financial terms, 'correlation' is the numerical measure of the relationship between two variables (in this case, the variables are Forex pairs).
The range of the correlation coefficient is between -1 and +1. A correlation of +1 indicates that two currency pairs will flow in the same direction.
A correlation of -1 indicates that two currency pairs will move in the opposite direction.
Here, I multiplied correlation coefficient by 100 so that it is easier to read. Range between 100 and -100.
Color Coding:-
The darker the color, the higher the correlation positively or negatively.
Extra Light Blue (up to +29) : Weak correlation. Positions on these symbols will tend to move independently.
Light Blue (up to +49) : There may be similarity between positions on these symbols.
Medium Blue (up to +75) : Medium positive correlation.
Navy Blue (up to +100) : Strong positive correlation.
Extra Light Red (up to -30) : Weak correlation. Positions on these symbols will tend to move independently
Light Red (up to -49) : There may be similarity between positions on these symbols.
Dark Red: (up to -75) : Medium negative correlation.
Maroon: (up to -100) : Strong negative correlation.
Script de código abierto
Fiel al espíritu de TradingView, el creador de este script lo ha convertido en código abierto, para que los traders puedan revisar y verificar su funcionalidad. ¡Enhorabuena al autor! Aunque puede utilizarlo de forma gratuita, recuerde que la republicación del código está sujeta a nuestras Normas internas.
Exención de responsabilidad
La información y las publicaciones no constituyen, ni deben considerarse como asesoramiento o recomendaciones financieras, de inversión, de trading o de otro tipo proporcionadas o respaldadas por TradingView. Más información en Condiciones de uso.