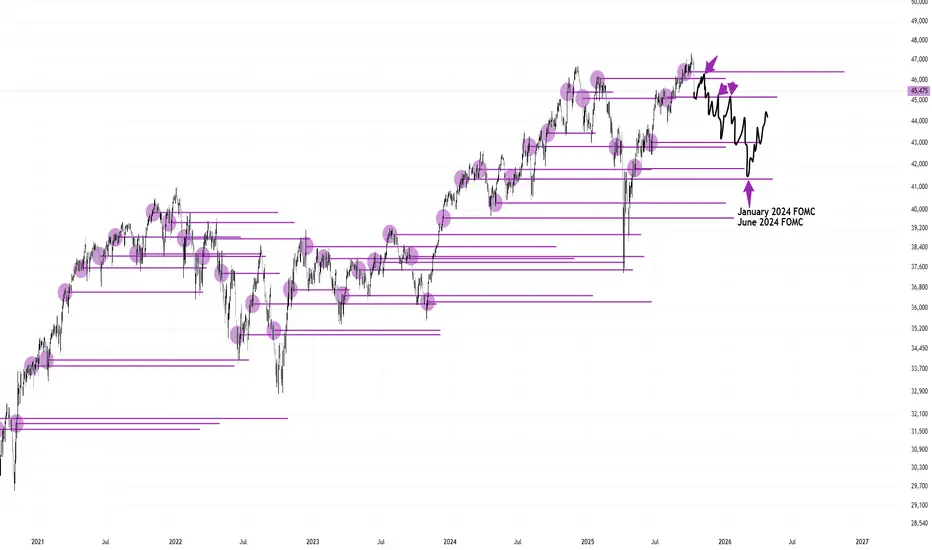
Below are my FOMC levels I have mapped out. Prices move SOLELY from FOMC releases.
This is a concept I first discovered last year and since then, have still been perfecting it.
I want to see the July FOMC hold as a short term support level before rallying into the September FOMC as resistance for the pullback dump.

Ultimately, I am looking for January 2024 FOMC to hold as the next major long term bottom before breaking out into the 48,000-50,000s

Below I will post screenshots of how FOMC levels are used as I am not good explaining. Take the time to study these charts and see for yourself that Dow Jones makes it's price action based on the releases of FOMC.
Protected Levels:
Levels that do not get touched and are defended.

Resistance Levels:


Support Levels:


And of course, the biggest support level used with the April dump right into May 2023 FOMC

Mean Reversion Levels:


These levels even work intra day. Take a look below to see how well these are respected.


This is a concept I first discovered last year and since then, have still been perfecting it.
I want to see the July FOMC hold as a short term support level before rallying into the September FOMC as resistance for the pullback dump.
Ultimately, I am looking for January 2024 FOMC to hold as the next major long term bottom before breaking out into the 48,000-50,000s
Below I will post screenshots of how FOMC levels are used as I am not good explaining. Take the time to study these charts and see for yourself that Dow Jones makes it's price action based on the releases of FOMC.
Protected Levels:
Levels that do not get touched and are defended.
Resistance Levels:
Support Levels:
And of course, the biggest support level used with the April dump right into May 2023 FOMC
Mean Reversion Levels:
These levels even work intra day. Take a look below to see how well these are respected.
Exención de responsabilidad
La información y las publicaciones que ofrecemos, no implican ni constituyen un asesoramiento financiero, ni de inversión, trading o cualquier otro tipo de consejo o recomendación emitida o respaldada por TradingView. Puede obtener información adicional en las Condiciones de uso.