📍 Live price context
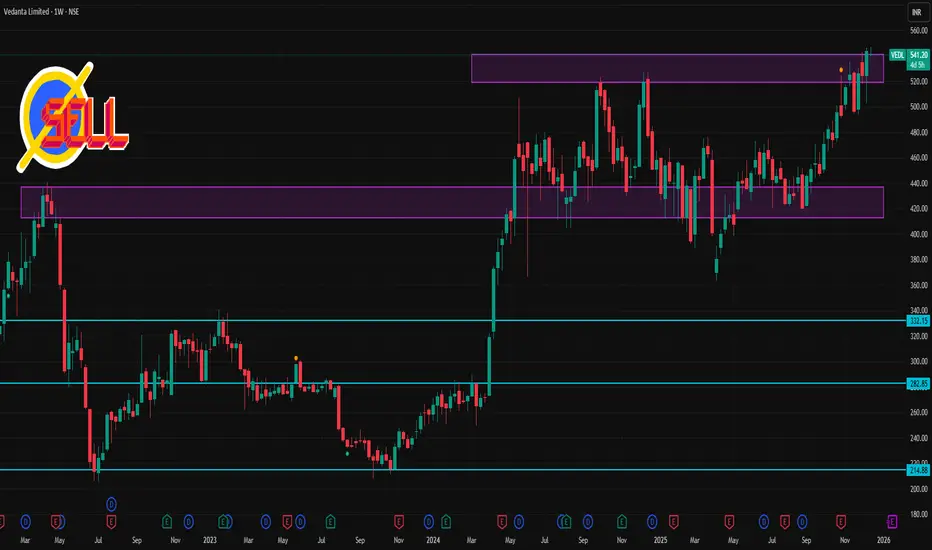
Vedanta is trading around ₹540 + on NSE.
📊 Weekly (1‑Week Timeframe) Key Levels
🧱 Resistance Levels (Upside)
These are levels where price may face selling pressure / struggle to break above:
R1: ~₹548 – ₹553 — short‑term technical resistance zone.
R2: ~₹555 – ₹560 — broader upside/wider resistance (weekly chart often reflects overhead supply near recent highs).
R3: ~₹565 + — psychological/upper projection zone if momentum continues.
📉 Support Levels (Downside)
Key floors where price may find buying interest / bounce:
S1: ~₹536 – ₹538 — immediate weekly support near pivot area.
S2: ~₹530 – ₹532 — next support cluster on weekly pivot levels.
S3: ~₹525 – ₹526 — deeper weekly support if price corrects further.
Publicaciones relacionadas
Exención de responsabilidad
La información y las publicaciones no constituyen, ni deben considerarse como asesoramiento o recomendaciones financieras, de inversión, de trading o de otro tipo proporcionadas o respaldadas por TradingView. Más información en Condiciones de uso.