📊 NFX  USOIL Chart Update
Fresh setup spotted:
🎯 Bias:
As long as demand holds, I’m favoring longs into supply.
Break below demand = setup invalidated.
Stay disciplined - this is a textbook demand-to-supply play.
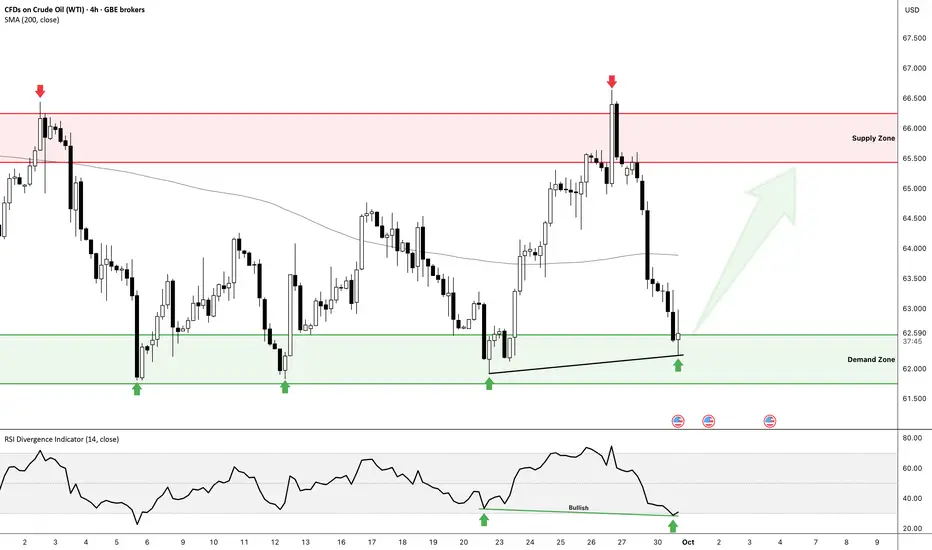
Fresh setup spotted:
- Price tapped into demand zone and bounced cleanly.
- Bullish RSI divergence confirmed → momentum shift to the upside.
- Eyeing the supply zone above as the next key test.
🎯 Bias:
As long as demand holds, I’m favoring longs into supply.
Break below demand = setup invalidated.
Stay disciplined - this is a textbook demand-to-supply play.
Operación activa
Thesis: Just entered a long on oil from the $61.00 May ’25 Support Zone. Despite the recent breakdown below the Aug–Sept demand zone, price shows a clear rejection off the May lows. Structurally, this looks like a bear trap-momentum is shifting, and macro conditions favor a bullish reversal.🔍 Setup Breakdown
- Support Zone Entry: $61.00 – May ’25 lows held firm, rejecting downside pressure.
- Demand Zone Fakeout: Breakdown below Aug–Sept demand zone likely short-lived.
- RSI Divergence: Bullish divergence forming on H4 - RSI troughs rising while price retests support.
- Volume Confirmation: Accumulation volume building near support zone.
- Projected Path: Targeting 66–68 supply zone, with potential extension to 72–74.
🎯 Trade Parameters
- Entry: $61.00
- Stop: Below 60.00 (invalidates reversal thesis)
- Target 1: 65.00–66.00 supply zone
- Target 2: 69.00–70.00 extended resistance
🧠 Macro Overlay
- Geopolitical Risk: Shutdown tensions + Russian Sanctions + Middle East volatility = potential supply disruptions.
- Credit Spreads Widening: Risk-off tone may favor commodities as hedges.
- Fed Easing Bias: Rate cuts support energy demand outlook.
⚠️ TL;DR
Long oil from $61.00 support. Bear trap below Aug–Sept demand zone. Macro tailwinds + bullish structure = asymmetric upside. Targets: 65–66, then 69–70.
Nota
Breakaway gap - indicating strong bullish momentumNow awaiting a breakout above 62 to confirm bullish continuation. - i'm expecting this to be a strong breakout given the current accumulation phase per volume profile
Nota
Price broke through resistance - Looks like the rally about to begin 🤞🏽Operación cerrada manualmente
Setup InvalidatedThe NFX Team
Exención de responsabilidad
The information and publications are not meant to be, and do not constitute, financial, investment, trading, or other types of advice or recommendations supplied or endorsed by TradingView. Read more in the Terms of Use.
The NFX Team
Exención de responsabilidad
The information and publications are not meant to be, and do not constitute, financial, investment, trading, or other types of advice or recommendations supplied or endorsed by TradingView. Read more in the Terms of Use.