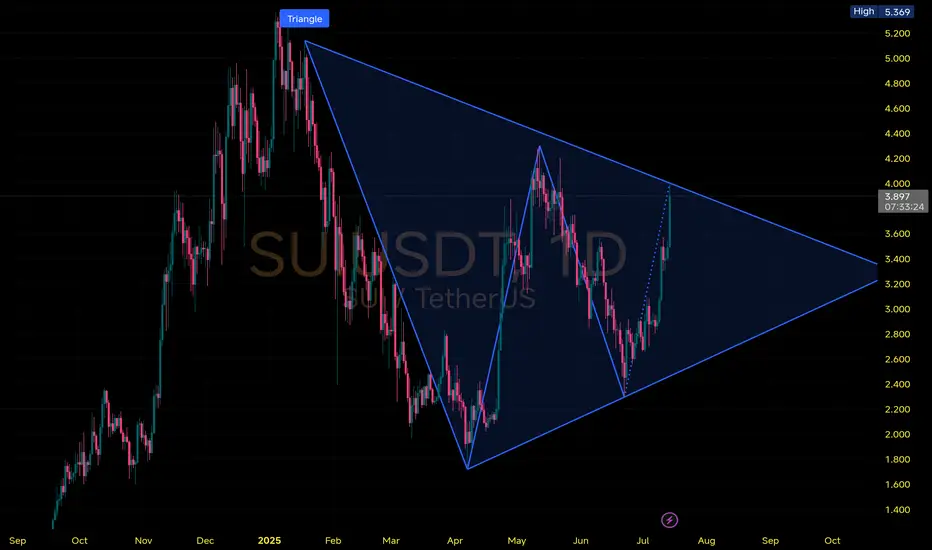
Price is tightening within a large symmetrical triangle pattern on the 1D chart, signaling a major move brewing in the coming weeks.
🔹Price currently pushing toward upper trendline resistance near $4.00
🔸Upside Potential: Break above $4.20 could trigger a rally toward $5.00–$5.30+
🔹Pattern target (if breakout confirmed): roughly $6.00+ based on pole height
🔸Support at $3.20 is key triangle base
🔹Breakdown below = bearish continuation risk toward $2.50
#SUI is coiling within a triangle. A breakout is imminent — watch closely for a decisive move above or below structure.
Exención de responsabilidad
La información y las publicaciones que ofrecemos, no implican ni constituyen un asesoramiento financiero, ni de inversión, trading o cualquier otro tipo de consejo o recomendación emitida o respaldada por TradingView. Puede obtener información adicional en las Condiciones de uso.