📊 Key insight
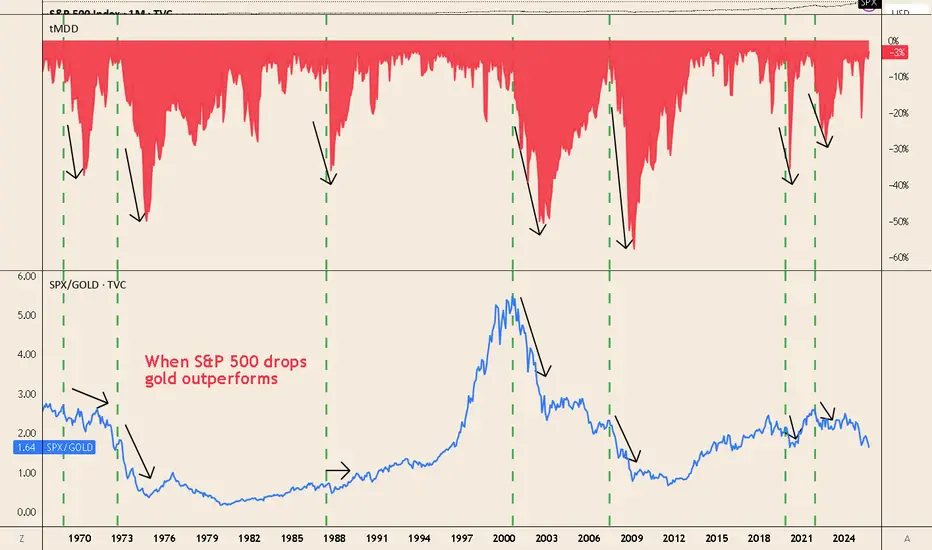
-Every major equity drawdown coincides with a drop in the SPX/Gold ratio — meaning gold outperforms stocks.
📉 What the chart shows
-1973–74 (stagflation): deep S&P 500 drawdown, SPX/Gold collapses.
-2000–02 (tech bust): ratio peaks ~5, then trends lower as gold rises and equities fall.
-2008–11 (GFC): brief liquidity hit to gold, then SPX/Gold plunges as gold rallies.
-2020 (COVID shock): rapid drop in SPX/Gold during equity sell-off.
-2022 bear market: ratio turns down again with inflation and rate stress.
Why it happens
-During market stress, investors seek safe collateral → gold demand spikes.
-Real rates and recession fears hurt equities more than gold.
-Silver carries industrial exposure, gold acts as a true safe haven.
🛡️ How to use it
-A gold allocation helps hedge against equity drawdowns.
-Long GOLD / short
  SPX (ratio trade) historically reduces portfolio volatility.
-Note: gold can dip during initial liquidity shocks (e.g., 2008, Mar 2020) — but recovers faster than equities.
-Every major equity drawdown coincides with a drop in the SPX/Gold ratio — meaning gold outperforms stocks.
📉 What the chart shows
-1973–74 (stagflation): deep S&P 500 drawdown, SPX/Gold collapses.
-2000–02 (tech bust): ratio peaks ~5, then trends lower as gold rises and equities fall.
-2008–11 (GFC): brief liquidity hit to gold, then SPX/Gold plunges as gold rallies.
-2020 (COVID shock): rapid drop in SPX/Gold during equity sell-off.
-2022 bear market: ratio turns down again with inflation and rate stress.
Why it happens
-During market stress, investors seek safe collateral → gold demand spikes.
-Real rates and recession fears hurt equities more than gold.
-Silver carries industrial exposure, gold acts as a true safe haven.
🛡️ How to use it
-A gold allocation helps hedge against equity drawdowns.
-Long
-Note: gold can dip during initial liquidity shocks (e.g., 2008, Mar 2020) — but recovers faster than equities.
Exención de responsabilidad
La información y las publicaciones no constituyen, ni deben considerarse como asesoramiento o recomendaciones financieras, de inversión, de trading o de otro tipo proporcionadas o respaldadas por TradingView. Más información en Condiciones de uso.
Exención de responsabilidad
La información y las publicaciones no constituyen, ni deben considerarse como asesoramiento o recomendaciones financieras, de inversión, de trading o de otro tipo proporcionadas o respaldadas por TradingView. Más información en Condiciones de uso.