---
### 📊 **Technical Summary:**
#### 🔹 **Chart Pattern:**
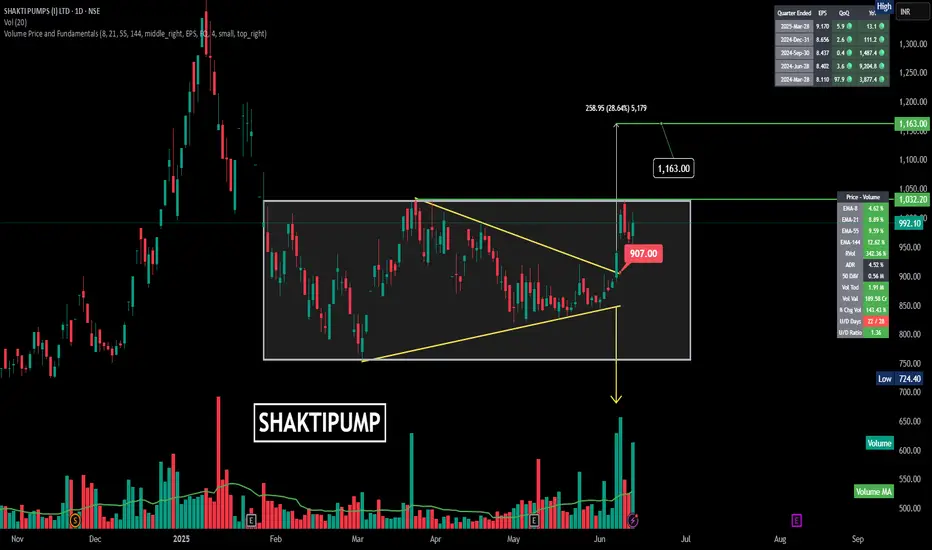
* A **falling wedge** breakout occurred **within a broader rectangular consolidation** (boxed range).
* The breakout zone was near **₹907**, and the stock has since surged past the key resistance.
#### 🔹 **Breakout Confirmation:**
* Price closed at **₹992.10**, sustaining above the breakout.
* The wedge breakout followed by a strong bullish candle confirms **upward momentum**.
#### 🔹 **Volume Action:**
* Noticeable spike in volume during the breakout — indicating **institutional or strong hands entry**.
* Volume > 1.91M, which is far above the 50-day average, confirming strength.
#### 🔹 **Target Projection:**
* Target = Breakout height added to breakout level
\= ₹907 + ₹258.95 ≈ **₹1,163**
* Marked on chart as **28.64% upside potential**
#### 🔹 **Indicators (Right Panel):**
* **EMA Trend**: All EMAs (8, 21, 55, 144) are rising — bullish alignment.
---
### 🔍 **Levels to Watch:**
| Type | Price (₹) |
| ---------------------- | --------- |
| **Breakout Level** | 907.00 |
| **Current Price** | 992.10 |
| **Resistance/Target** | 1,163.00 |
| **Support Zone** | 907–925 |
| **Volume Spike Price** | \~900–930 |
---
### ✅ **Conclusion:**
SHAKTIPUMP is showing a **textbook falling wedge breakout** with heavy volume. The target stands at **₹1,163**, offering a potential **17%+ upside** from current levels. As long as it holds above ₹907–925, the bullish structure remains intact.
---
### 📊 **Technical Summary:**
#### 🔹 **Chart Pattern:**
* A **falling wedge** breakout occurred **within a broader rectangular consolidation** (boxed range).
* The breakout zone was near **₹907**, and the stock has since surged past the key resistance.
#### 🔹 **Breakout Confirmation:**
* Price closed at **₹992.10**, sustaining above the breakout.
* The wedge breakout followed by a strong bullish candle confirms **upward momentum**.
#### 🔹 **Volume Action:**
* Noticeable spike in volume during the breakout — indicating **institutional or strong hands entry**.
* Volume > 1.91M, which is far above the 50-day average, confirming strength.
#### 🔹 **Target Projection:**
* Target = Breakout height added to breakout level
\= ₹907 + ₹258.95 ≈ **₹1,163**
* Marked on chart as **28.64% upside potential**
#### 🔹 **Indicators (Right Panel):**
* **EMA Trend**: All EMAs (8, 21, 55, 144) are rising — bullish alignment.
---
### 🔍 **Levels to Watch:**
| Type | Price (₹) |
| ---------------------- | --------- |
| **Breakout Level** | 907.00 |
| **Current Price** | 992.10 |
| **Resistance/Target** | 1,163.00 |
| **Support Zone** | 907–925 |
| **Volume Spike Price** | \~900–930 |
---
### ✅ **Conclusion:**
SHAKTIPUMP is showing a **textbook falling wedge breakout** with heavy volume. The target stands at **₹1,163**, offering a potential **17%+ upside** from current levels. As long as it holds above ₹907–925, the bullish structure remains intact.
---
Exención de responsabilidad
La información y las publicaciones que ofrecemos, no implican ni constituyen un asesoramiento financiero, ni de inversión, trading o cualquier otro tipo de consejo o recomendación emitida o respaldada por TradingView. Puede obtener información adicional en las Condiciones de uso.