Based on the charts and the market's performance on Monday, September 22, the Sensex has also experienced a significant correction, breaking below a key support level and its rising channel. The market sentiment has shifted from strongly bullish to cautiously bearish in the short term.
Detailed Market Structure Breakdown
4-Hour Chart (Macro Trend)
Structure: The long-term trend remains bullish, as the index is still trading above its early September lows. However, Monday's strong bearish candle, which broke below the rising channel, indicates a significant shift in the immediate trend. The bulls' control has been challenged, and a deeper correction is now more probable.
Key Levels:
Major Supply (Resistance): 83,750 - 83,900. This level has proven to be a very strong supply zone, rejecting the price on its recent attempt.
Major Demand (Support): The most critical support is the 81,800 - 82,000 zone. This area, which includes a prior breakout level, is the key "line in the sand" for the long-term bullish trend. A break below this would signal a major trend reversal.
1-Hour Chart (Intermediate View)
Structure: The 1H chart shows a clear MSS (Market Structure Shift) to the downside. The price has broken below the lower trendline of the rising channel and its immediate support at 82,400. This confirms the short-term bearish bias. The index is now making lower highs and lower lows.
Key Levels:
Immediate Resistance: The 82,400 level, which was a strong support, has now become a crucial resistance. Any bounce is likely to be met with selling pressure in this zone.
Immediate Support: The next key support level is the 81,800 mark. This is a psychological level that was tested on Monday and aligns with the major demand zone.
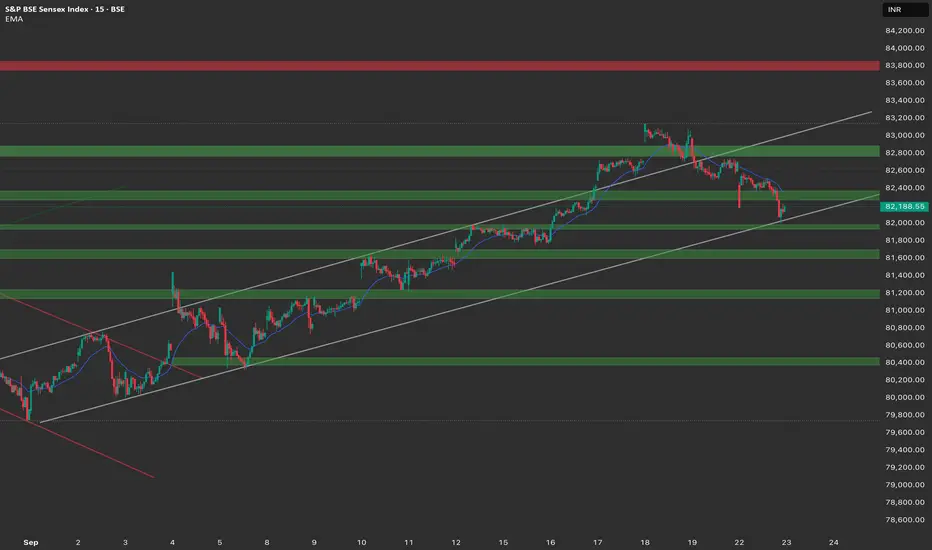
15-Minute Chart (Intraday View)
Structure: The 15M chart provides a clearer picture of the intraday fall. The price is showing a minor consolidation after the sharp decline. This is likely a pause before the next move. The price has retested the broken trendline and is now moving lower.
Key Levels:
Intraday Supply: The 82,400 area, which is the high of the recent consolidation.
Intraday Demand: The low of the recent consolidation and the intraday low, near 82,100.
Outlook: The intraday bias is bearish. The market is likely to continue its downward movement unless it can reclaim the 82,400 resistance level.
Trade Plan (Monday, 23rd September)
Market Outlook: The market is now in a short-term bearish phase. A "sell on rise" strategy seems more favorable, but a strong reversal from a key support level is also a possibility.
Bearish Scenario (Primary Plan)
Justification: The market has shown a clear change in structure with a breakdown of key levels. The path of least resistance is to the downside.
Entry: Look for a short entry if the price retests the 82,400 - 82,500 level and shows signs of rejection with a bearish candlestick pattern. Alternatively, a breakdown and 15-minute close below 82,100 would trigger a short entry.
Stop Loss (SL): Place a stop loss above 82,550.
Targets:
T1: 81,800 (Next major support).
T2: 81,600 (Next major demand zone).
Bullish Scenario (Counter-Trend Plan)
Justification: This is a counter-trend plan and should be approached with caution. It is based on the possibility of a strong bounce from a key support level.
Trigger: A strong bullish reversal candle (e.g., a hammer or engulfing pattern) near the 81,800 - 82,000 demand zone.
Entry: Long entry on a confirmed bounce from the demand zone.
Stop Loss (SL): Below 81,700.
Targets:
T1: 82,400 (Intraday resistance).
T2: 82,600 (Recent swing high).
Key Levels for Observation:
Immediate Decision Point: The 82,100 - 82,400 zone.
Bearish Confirmation: A break and sustained move below 82,100.
Bullish Confirmation: A recapture of the 82,400 level.
Line in the Sand: The 81,800 - 82,000 zone. The overall bullish trend is in jeopardy if this level is decisively broken.
Detailed Market Structure Breakdown
4-Hour Chart (Macro Trend)
Structure: The long-term trend remains bullish, as the index is still trading above its early September lows. However, Monday's strong bearish candle, which broke below the rising channel, indicates a significant shift in the immediate trend. The bulls' control has been challenged, and a deeper correction is now more probable.
Key Levels:
Major Supply (Resistance): 83,750 - 83,900. This level has proven to be a very strong supply zone, rejecting the price on its recent attempt.
Major Demand (Support): The most critical support is the 81,800 - 82,000 zone. This area, which includes a prior breakout level, is the key "line in the sand" for the long-term bullish trend. A break below this would signal a major trend reversal.
1-Hour Chart (Intermediate View)
Structure: The 1H chart shows a clear MSS (Market Structure Shift) to the downside. The price has broken below the lower trendline of the rising channel and its immediate support at 82,400. This confirms the short-term bearish bias. The index is now making lower highs and lower lows.
Key Levels:
Immediate Resistance: The 82,400 level, which was a strong support, has now become a crucial resistance. Any bounce is likely to be met with selling pressure in this zone.
Immediate Support: The next key support level is the 81,800 mark. This is a psychological level that was tested on Monday and aligns with the major demand zone.
15-Minute Chart (Intraday View)
Structure: The 15M chart provides a clearer picture of the intraday fall. The price is showing a minor consolidation after the sharp decline. This is likely a pause before the next move. The price has retested the broken trendline and is now moving lower.
Key Levels:
Intraday Supply: The 82,400 area, which is the high of the recent consolidation.
Intraday Demand: The low of the recent consolidation and the intraday low, near 82,100.
Outlook: The intraday bias is bearish. The market is likely to continue its downward movement unless it can reclaim the 82,400 resistance level.
Trade Plan (Monday, 23rd September)
Market Outlook: The market is now in a short-term bearish phase. A "sell on rise" strategy seems more favorable, but a strong reversal from a key support level is also a possibility.
Bearish Scenario (Primary Plan)
Justification: The market has shown a clear change in structure with a breakdown of key levels. The path of least resistance is to the downside.
Entry: Look for a short entry if the price retests the 82,400 - 82,500 level and shows signs of rejection with a bearish candlestick pattern. Alternatively, a breakdown and 15-minute close below 82,100 would trigger a short entry.
Stop Loss (SL): Place a stop loss above 82,550.
Targets:
T1: 81,800 (Next major support).
T2: 81,600 (Next major demand zone).
Bullish Scenario (Counter-Trend Plan)
Justification: This is a counter-trend plan and should be approached with caution. It is based on the possibility of a strong bounce from a key support level.
Trigger: A strong bullish reversal candle (e.g., a hammer or engulfing pattern) near the 81,800 - 82,000 demand zone.
Entry: Long entry on a confirmed bounce from the demand zone.
Stop Loss (SL): Below 81,700.
Targets:
T1: 82,400 (Intraday resistance).
T2: 82,600 (Recent swing high).
Key Levels for Observation:
Immediate Decision Point: The 82,100 - 82,400 zone.
Bearish Confirmation: A break and sustained move below 82,100.
Bullish Confirmation: A recapture of the 82,400 level.
Line in the Sand: The 81,800 - 82,000 zone. The overall bullish trend is in jeopardy if this level is decisively broken.
Exención de responsabilidad
La información y las publicaciones no constituyen, ni deben considerarse como asesoramiento o recomendaciones financieras, de inversión, de trading o de otro tipo proporcionadas o respaldadas por TradingView. Más información en Condiciones de uso.
Exención de responsabilidad
La información y las publicaciones no constituyen, ni deben considerarse como asesoramiento o recomendaciones financieras, de inversión, de trading o de otro tipo proporcionadas o respaldadas por TradingView. Más información en Condiciones de uso.