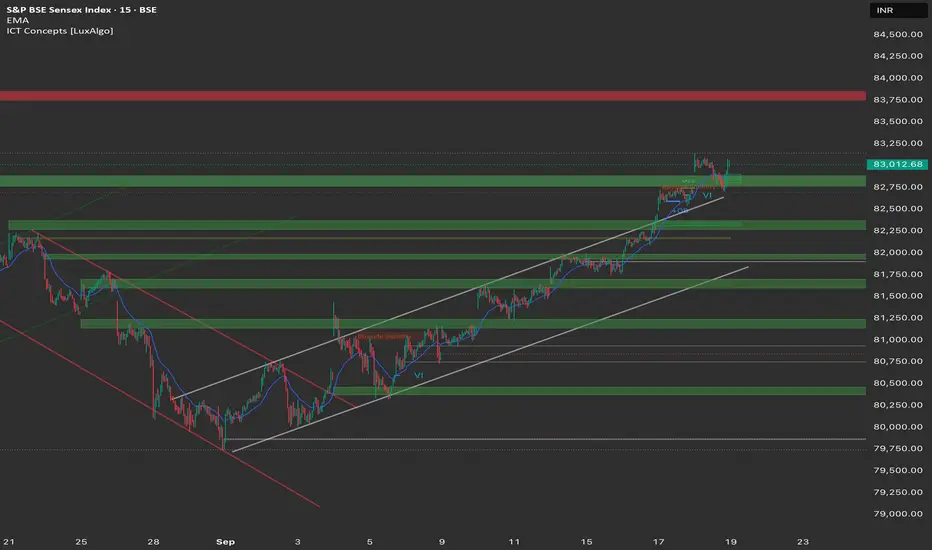
Current SENSEX (Yesterday's Close): 83,013.96
Overarching Theme: Similar to NIFTY and BANKNIFTY, Sensex is in a strong, impulsive uptrend. It has broken out of a recent consolidation and is now challenging a major resistance zone. The overall market sentiment is bullish.
Detailed Market Structure Breakdown
4-Hour Chart (Macro Trend)
Structure: The macro trend is clearly bullish. After a strong downward correction, the index formed an "Order Block" (OB) and then began a new, powerful uptrend. This is confirmed by the continuous "Break of Structure" (BOS) events and the price action staying within a well-defined ascending channel.
Key Levels:
Major Supply Zone (Resistance): 83,750 - 83,900. This is a major resistance level from a previous high. A decisive breakout here would confirm a strong continuation of the rally toward a new all-time high.
Major Demand Zone (Support): 81,800 - 82,000. This zone, which aligns with a previous resistance, has now become a solid support. It also contains a FVG (Fair Value Gap), making it a high-probability reversal area for any major pullback.
Outlook: The 4H chart suggests a bullish continuation. The recent BOS indicates strong buying interest, and any pullback to the 82,500 area would be a healthy re-test of the broken resistance.
1-Hour Chart (Intermediate View)
Structure: The 1H chart shows the short-term trend within the larger bullish structure. The price is trading within the ascending channel and recently broke above the 82,500 level. A minor correction is currently underway, bringing the price back to test the breakout level.
Key Levels:
Immediate Resistance: The recent high around 83,100.
Immediate Support: The 82,750 zone. This area marks the top of the previous consolidation and now acts as immediate support.
Outlook: The 1H chart shows a small correction is likely, but the trend remains bullish. The price is expected to find support at the 82,750 level before resuming its upward move.
15-Minute Chart (Intraday View)
Structure: The 15M chart shows the most recent price action, with the index consolidating after a sharp move up. It is currently trading sideways, and a "Market Structure Shift" (MSS) has occurred, signaling a possible temporary pause or reversal.
Key Levels:
Intraday Supply Zone: The high around 83,100.
Intraday Demand Zone: The low of the recent consolidation around 82,750.
Outlook: The short-term bias is neutral as the market awaits a catalyst. A breakout from this range will determine the intraday direction.
📈 Today's Trade Plan
Market Outlook: Sensex is bullish on all major timeframes. The intraday consolidation is a crucial "decision point" for today's trading.
Bullish Scenario (Primary Plan)
Justification: The strong underlying trend suggests a continuation towards the major resistance zone.
Entry: Place a long entry on a decisive break and 15-minute candle close above the 83,100 intraday high.
Stop Loss (SL): Below 82,900 to protect against a reversal.
Targets:
T1: 83,300 (Minor psychological resistance).
T2: 83,750 (Major 4H chart supply zone).
Bearish Scenario (Counter-Trend Plan)
Justification: This plan is for a short-term correction within the uptrend, should the consolidation break to the downside.
Trigger: A confirmed breakdown and 15-minute candle close below the 82,750 immediate support.
Entry: Short entry on a breakdown retest of the 82,750 level.
Stop Loss (SL): Above 82,900.
Targets:
T1: 82,500 (Previous breakout level and first strong support).
T2: 82,200 (Further demand zone).
Key Levels for Observation:
Immediate Decision Point: 82,750 - 83,100.
Bullish Confirmation: A break above 83,100.
Warning Sign: A drop below 82,750.
Exención de responsabilidad
La información y las publicaciones que ofrecemos, no implican ni constituyen un asesoramiento financiero, ni de inversión, trading o cualquier otro tipo de consejo o recomendación emitida o respaldada por TradingView. Puede obtener información adicional en las Condiciones de uso.